I believe there are many factors that drive stock prices and one of them is investor sentiment. However, enthusiasm and panic can also reach extremes, which drives the opposite trend.
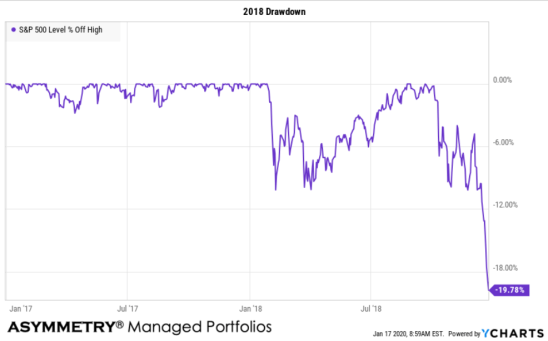
When investors are extremely bullish they help drives up as long as they keep buying stocks. But, at some point, their buying enthusiasm or capacity to buy gets exhausted and the buying pressure dries up. We saw this in rare form in 2017 as investor sentiment was excessively bullish as prices kept trending up. In the chart below I show the breakout after a very volatile period (yellow) and a smooth uptrend in 2017 (green line), but then it was interpreted sharply early 2018 and then corrected even more by the end of ’18.
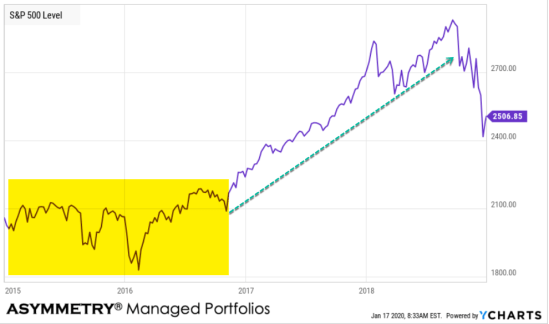
In fact, as an example of the challenge of this period, if we had applied a trend following system that entered the breakout above the 2015-16 trading range and but didn’t exit at some point in the uptrend, this stock index declined all the way back to the breakout entry point. 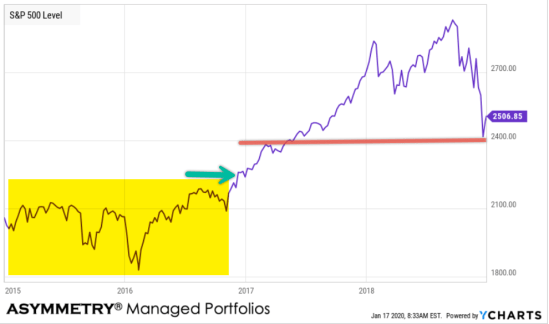
We can say the same for buy and hold; if someone held stocks over this period the end of 2018 they were looking back three years without much capital gain. So, the point in time investors decide to do their lookback makes all the difference.
Back to investor sentiment…
Another observation about investor sentiment is after prices trend up, investors get more and more optimistic about prices trending up, so the trend and momentum itself attract stock buying enthusiasm. At major bull market peaks, like in 1999, it brings out the masses. I remember grandmothers cashing out bank CD’s wanting to buy stocks then.
The same applies on the downside. After prices fall, investors become more and more afraid of deeper losses in their portfolio, which results in more selling pressure.
Everyone has an uncle point, it can either be predefined like mine is, or you can find out the hard day after your losses get large enough you tap out at lower prices.
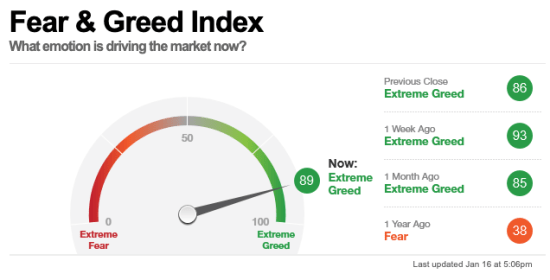
Since I shared my observations of investor sentiment in You probably want to invest in stocks last week, the CNN Fear & Greed Index, made up of 7 investor sentiment indicators, remains dialed up to “Extreme Greed”, so investors and the market seem to be optimistic about up-trending stock prices.
In fact, based on the historical trend cycle of the CNN Fear & Greed Index the market seems to be as optimistic about up-trending stock prices as it’s been in years. Only late 2017 did we see as much enthusiasm.
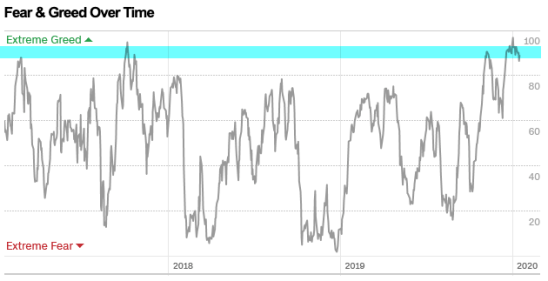
Who remembers how that turned out?
On sentiment indicator, I noted last week that wasn’t as bullish as others were the AAII Individual Investor Sentiment Survey. That changed this week.
US Investor Sentiment, % Bull-Bear Spread is at 14.33%, compared to 3.17% last week and 9.09% last year. This is higher than the long term average of 7.72%. 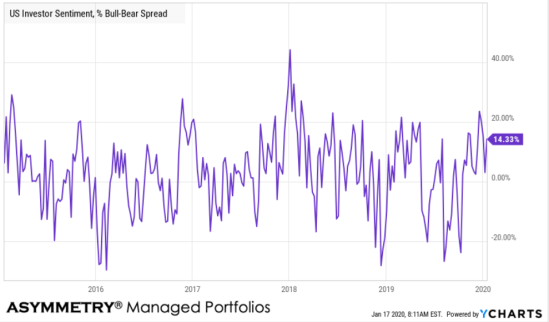
So, individual investors are bullish, according to AAII.
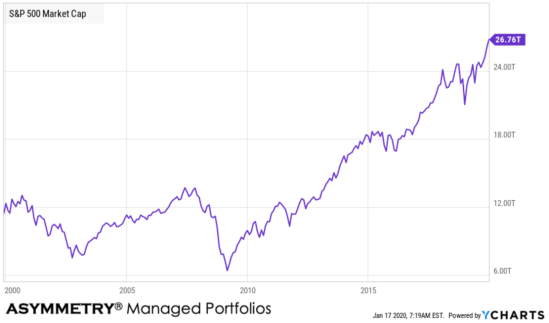
What’s driving all this enthusiasm for the stock market?
The trend is up, and here is a chart of the S&P 500 market capitalization showing the value of the stocks in the index based on the current price.
Most investors follow trends whether they realize it or not. Trend following can be a good thing as long as the trend continues. It’s when the trends change we find out who’s who.
You can probably see why I believe it is essential to actively manage investment risk and apply robust drawdown controls to avoid the bad ending. For me, it’s a combination of predetermined exits to cut losses short and asymmetric hedging.

You must be logged in to post a comment.