Recessions are officially announced long after they begin.
It usually takes nine to twelve months before the National Bureau of Economic Research (NBER) to announce when a recession started.
For example, on June 8, 2020, the National Bureau of Economic Research announced the U.S. economy was officially in a recession. The COVID lockdown-driven recession was so obvious NBER’s Business Cycle Dating Committee didn’t need the typical time frame to decide.
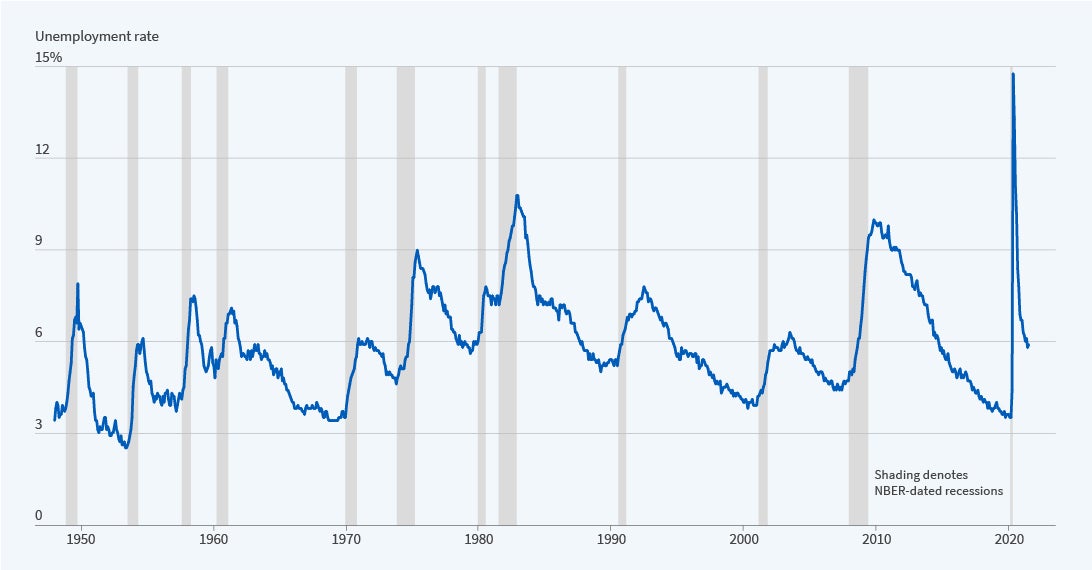
Here’s the Unemployment Rate with NBER-dated recessions in gray, for an example of business cycle dating.
Who is the National Bureau of Economic Research and its Business Cycle Dating Committee?
The NBER’s Business Cycle Dating Committee maintains a chronology of US business cycles. The chronology identifies the dates of peaks and troughs that frame economic recessions and expansions. A recession is the period between a peak of economic activity and its subsequent trough, or lowest point. Between trough and peak, the economy is in an expansion. Expansion is the normal state of the economy; most recessions are brief. However, the time that it takes for the economy to return to its previous peak level of activity or its previous trend path may be quite extended.
According to the NBER chronology, the most recent peak occurred in February 2020. The most recent trough occurred in April 2020.
That was quick!
But the NBER’s Business Cycle Dating Committee maintains a chronology of US business cycles in the past, which tells us nothing about here, now.
I follow the 10-2 Treasury Yield Spread as an early warning signal of an imminent recession.
The 10-2 Treasury Yield Spread is the difference between the 10 year treasury rate and the 2 year treasury rate. This yield spread is commonly used as the main indicator of the steepness of the yield curve.
A yield curve is a visual representation of yields (interest rates) on U. S. Treasury bonds across a range of different maturities. In normal circumstances, the shape of the trend is upward; short-term rates are lower than long-term rates. It makes sense because if we are investing in bonds to earn interest, we should expect a higher rate for investing for a longer period. Another reason is a risk premium longer-term bonds as longer term durations are exposed to a greater probability interest rates will change over its remaining duration, causing the price to fluctuate.
If you invest in a bond that doesn’t mature for 10 or 20 years and rates of new bonds being issued increase, as they are now, the price of the bonds you hold will decline in price so their yield matches about what the market is paying now. This is a risk for bond holders in a rising interest rate environment as we are in now, driving by rising inflation.
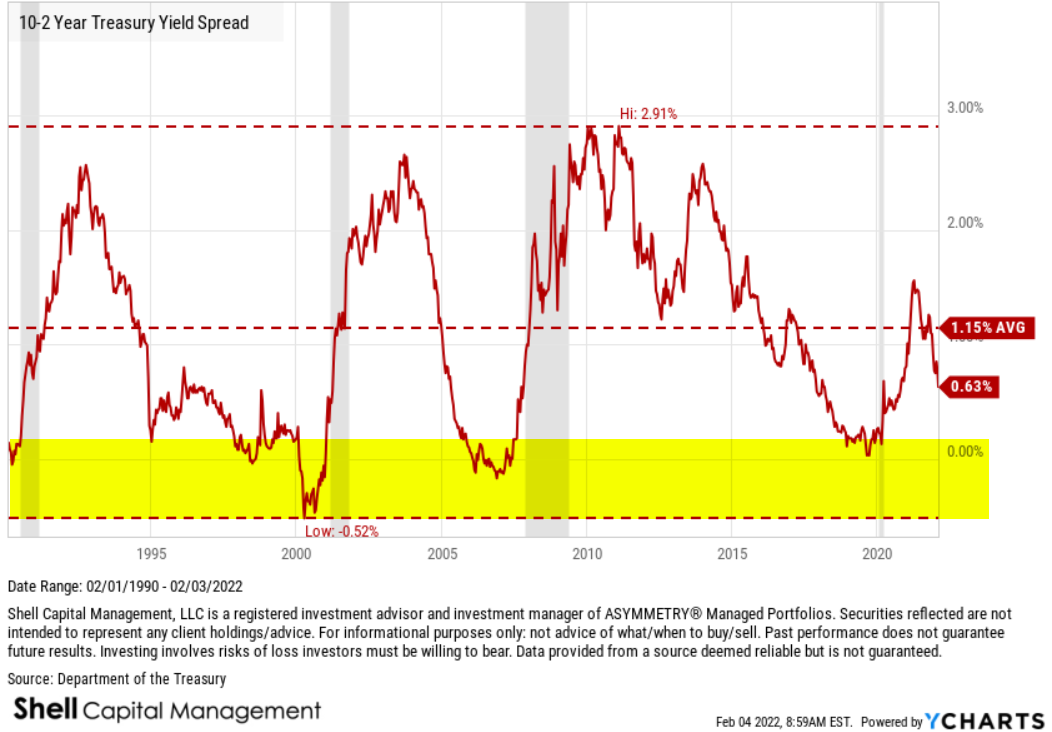
As the 10-2 Treasury spread approaches zero it signals a “flattening” of the yield curve. Here is the spread today, and it’s history over the past few decades. I shaded in gray the historical recessions to see how the 10-2 Treasury spread preceded historical recessions several months in advance. I also highlighted the area below zero where the signal occurs as the yield curve is flat. Right now, because short term interest rates are trending up driven by the U. S. Federal Reserve, the yield curve is trending toward flattening.
Only time will tell if the yield curve goes flat, where the short term (2 year) rate is the same as the longer term (10 year) yield, but we see its the directional trend at this point.
But what’s the 10-2 Treasury spread signal?
A negative 10-2 yield spread has historically been considered a precursor to a recessionary period.
A negative 10-2 spread has predicted every recession from 1955 to 2020, but has inverted 6 – 24 months before the recession occurring, so it is a far-leading indicator.
The 10-2 spread reached a high of 2.91% in 2011, and went as low as -2.41% in 1980.
10-2 Year Treasury Yield Spread is currently at 0.62%, compared to 1.01% last year, and its lower than the long term average of 0.93%.
If the 10-2 Year Treasury Yield Spread crosses below zero, and the yield curve becomes inverted, that’s what will signal a recession is probably imminent, but a recession may not be identified until 6 – 24 months later.
Or, it could be very fast, like 2020.
Until then, I’m systematically monitoring the 10-2 Year Treasury Yield Spread for the advance warning.
For information about our proactive investment management, active risk management, hedging your risks, and ASYMMETRY® Managed Portfolios, contact us.
Mike Shell is the Founder and Chief Investment Officer of Shell Capital Management, LLC, and the portfolio manager of ASYMMETRY® Managed Portfolios. Mike Shell and Shell Capital Management, LLC is a registered investment advisor focused on asymmetric risk-reward and absolute return strategies and provides investment advice and portfolio management only to clients with a signed and executed investment management agreement. The observations shared on this website are for general information only and should not be construed as advice to buy or sell any security. Securities reflected are not intended to represent any client holdings or any recommendations made by the firm. Any opinions expressed may change as subsequent conditions change. Please do not make any investment decisions based on such information, as it is subject to change. Investing involves risk, including the potential loss of principal an investor must be willing to bear. Past performance is no guarantee of future results. All information and data are deemed reliable but are not guaranteed and should be independently verified. The presence of this website on the Internet shall in no direct or indirect way raise an implication that Shell Capital Management, LLC is offering to sell or soliciting to sell advisory services to residents of any state in which the firm is not registered as an investment advisor. The views and opinions expressed in ASYMMETRY® Observations are those of the authors and do not necessarily reflect a position of Shell Capital Management, LLC. The use of this website is subject to its terms and conditions.

You must be logged in to post a comment.