We measure investor sentiment in many ways from indicators that illustrate the result of investor actions from trading such as the Cboe Volatility Index® (VIX®), the first index to measure the market’s expectation of future volatility. Volatility can be measured using actual historical price changes (realized volatility) or it can be a measure of expected future volatility that is implied by option prices. The VIX Index is a measure of expected future volatility as implied by options.
The VIX Index is a calculation designed to produce a measure of constant 30-day expected volatility of the U.S. stock market, derived from real-time, mid-quote prices of S&P 500® Index (SPX℠) call and put options. On a global basis, it is one of the most recognized measures of volatility — widely reported by financial media and closely followed by a variety of market participants as a daily market indicator.
Currently, the VIX has trended around 30, which I consider a volatility expansion. As you can see in the chart, the long-term average is around 20, so levels above average are periods expected to see a wider range of prices as prices, and more indecision.
When the VIX is elevated, it suggests the market is paying more for the protection of options, so many consider the VIX a “fear gauge.”

The good news is stock market returns have historically been higher after VIX trends above 30. Because it’s a sentiment indicator, the market eventually gets so bearish investors who desire to sell have already sold, and those who want to hedge (with options) have hedged.
Today’s VIX at 30 is far from an extreme spike we’ve seen before, but still elevated.
We’re going to venture far beyond the VIX today.
The VIX is one of 7 indicators included in the CNN Fear & Greed Index we have been monitoring for years. The Fear & Greed Index isn’t designed for market timing per se, but it can be a useful reminder of your own sentiment. At the extremes, you may consider feeling more contrarian and following the most famous contrarians mantra:
“Be fearful when others are greedy, and greedy when others are fearful.” – Warren Buffett
Right now, the Fear & Greed Index suggests Extreme Fear is driving the stock market.
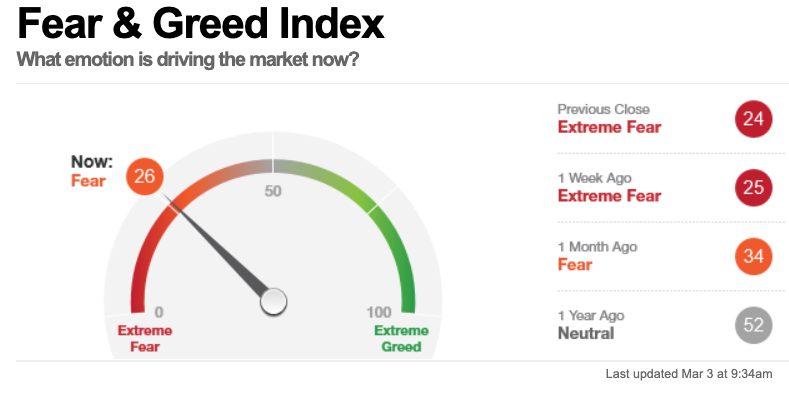
Looking inside the Fear & Greed Index the CBOE Volatility Index (VIX) at 30 is part of the weight of the evidence used to drive the gauge. It uses a moving average applied to the VIX level and as of yesterday, it has changed from “Extreme Fear” to Neutral as implied volatility declined.
Another option-related indicator included is the CBOE 5-day average Put/Call Ratio. It now says, “during the last five trading days, volume in put options has lagged volume in call options by 65.73% as investors make bullish bets in their portfolios. This is a lower level of put buying than has been the norm during the last two years and is a neutral indication.”
Put options are used mostly to hedge portfolios against price declines. When investors hedge more, it’s a signal they are bearish, and when they hedge less, it’s assumed by and large they are less bearish.
Below is the trend of the Fear & Greed over time. As you can see, it’s down to the Extreme Fear level, which proceeds a low in the stock market, and eventually a new uptrend.
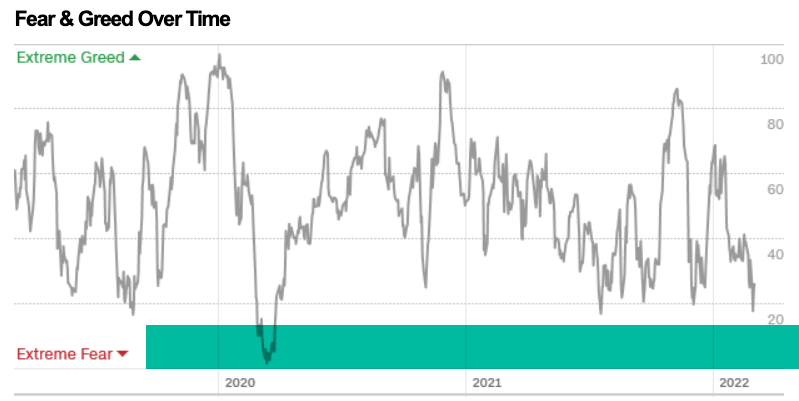
Once investors who want to sell have sold, we eventually see prices trend down to a low enough level it attracts buying demand.
To get an indication of when this may be near, we look at a wide range of investor/trader sentiment indicators, but also the price chart itself for clues.
I like to use the Fear & Greed Index here because it’s publically and freely available so anyone can observe and follow it, but there are many more we monitor that isn’t.
Advisor Sentiment from Investors Intelligence is one of my favorite investor sentiment indicators.
As you can see in the chart, bearish investment advisors now outnumber the bulls. The bull-bear spread narrowed to -4.6% and the first negative level since early April 2020. This is an extreme reading of bearishness, and historically precedes a reversal of a downtrend as it suggests those who have sold have sold, leaving buying demand in the dominant position.
According to Investors Intelligence, this extreme reading signals a lower risk level than before for tactical trading opportunities.

However, the caveat is it could absolutely get much worse because every eventual -50% decline in the stock market necessarily involves such extreme fear to drive prices lower. So, it’s essential to understand contrarian indicators are a windsock, but no indicator is flawless.
Sentiment indicators could remain extremely bearish for months in a long-lasting waterfall decline.
It’s essential to realize bearish sentiment necessarily proceeds large declines in the stock market, but eventually, the extreme pessimism signals the desire to sell may have faded enough for the demand to buy to become dominant.
When a market is falling, the prices trends are eventually driven down to a low enough point to attract new buying demand, and the trend reverses.
Indicators can be helpful to gauge sentiment and behavior, but nothing drives sentiment like a change it the price trend.
The price trend is the final arbiter.
“The trend is your friend until the end when it bends.” – Ed Seykota
Aguing with the trend is like arguing with a guard rail on a motorcycle. You can test it and try it, but it’s probably going to be a bad outcome.
A simple interpretation of the price trend of the stock market using the S&P 500 Index as a proxy is what was a low volatility primary uptrend has changed to a downtrend as defined by its lower highs, and lower lows.

Below we see my line in the sand, which shows the index is at a level it’s seen several times before.
For now, the stock market is attempting an uptrend.
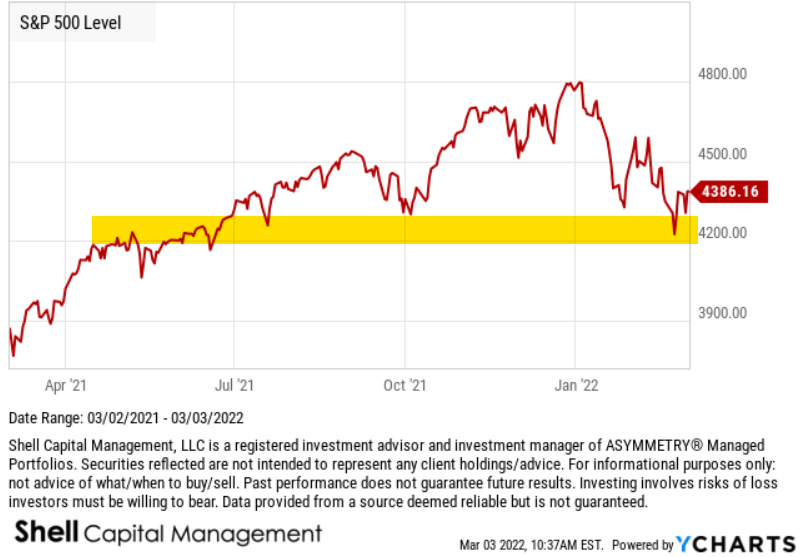
If the S&P 500 declines below 4200 I’ll consider it a continuation of the downtrend.
The moving average of the price is a common technical indicator used for trend following. The 50 day and 200 day are the most popular. As you can see, the S&P 500 is also defined as a downtrend using these trend following indicators.
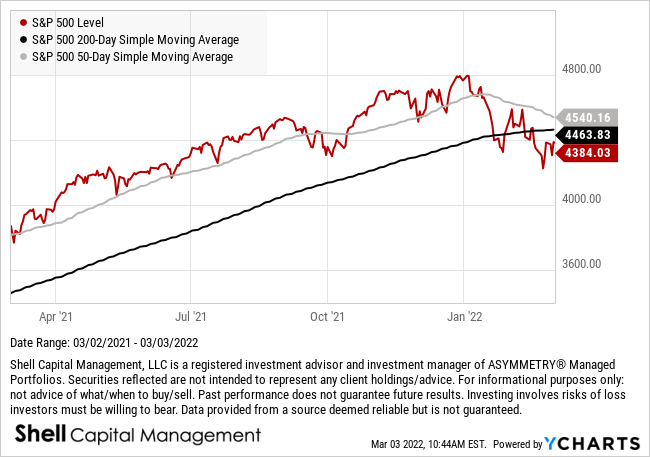
The SPX is down about -9% from its high, and was down as much as -12% as of last week. That’s far from a major decline, but enough to help drive a lot of fear of a further loss of value.

The bottom line is investor and advisor sentiment has reached an extreme level of pessimism that could proceed at least a short-term retracement of the stock market decline.
However, there is plenty of potential catalysts that could result in a price shock, or waterfall decline, such as a nuclear threat from Russia. For example, The New York Times reports “Putin Is Brandishing the Nuclear Option. How Serious Is the Threat?”
“Over the weekend, as his military laid siege to Ukraine for the fourth day, President Vladimir Putin ordered Russia’s nuclear forces into a higher state of alert, the first time the Kremlin has done so since the Russian Federation was established in 1991.”
And then there are actions from The Federal Open Market Committee (FOMC) of the Federal Reserve. Few things drive prices and sentiment more than changing interest rates.
Next up, I’ll take a look at what the stocks inside the index is doing to gauge how far they’ve trended and how far they may go.
Let’s see how it all plays out, but right now, we’re seeing early evidence of a possible capitulation, at least in the short term, barring no unknown, unknown, or nuclear attack.
In the meantime, I’m taking advance of some asymmetric risk-reward opportunities in our tactical trading.
For information about our proactive investment management, active risk management, hedging your risks, and ASYMMETRY® Managed Portfolios, contact us.
Mike Shell is the Founder and Chief Investment Officer of Shell Capital Management, LLC, and the portfolio manager of ASYMMETRY® Managed Portfolios. Mike Shell and Shell Capital Management, LLC is a registered investment advisor focused on asymmetric risk-reward and absolute return strategies and provides investment advice and portfolio management only to clients with a signed and executed investment management agreement. The observations shared on this website are for general information only and should not be construed as advice to buy or sell any security. Securities reflected are not intended to represent any client holdings or any recommendations made by the firm. Any opinions expressed may change as subsequent conditions change. Please do not make any investment decisions based on such information, as it is subject to change. Investing involves risk, including the potential loss of principal an investor must be willing to bear. Past performance is no guarantee of future results. All information and data are deemed reliable but are not guaranteed and should be independently verified. The presence of this website on the Internet shall in no direct or indirect way raise an implication that Shell Capital Management, LLC is offering to sell or soliciting to sell advisory services to residents of any state in which the firm is not registered as an investment advisor. The views and opinions expressed in ASYMMETRY® Observations are those of the authors and do not necessarily reflect a position of Shell Capital Management, LLC. The use of this website is subject to its terms and conditions.

You must be logged in to post a comment.