In the last observation, I shared “Implied volatility is indicating another possible volatility expansion” I pointed out that Implied volatility is indicating another possible volatility expansion.
The Volatility Index VIX was at 21, implying a range of stock prices (S&P 500) intraday of about 1.3% over the next 30 days.
On that same day, April 5th, my measure of realized, actual, historical near-term volatility was 1.6%.
Today the VIX is at 29, implying a 1.8% intraday range, and my measure of realized, actual, historical near-term volatility is 2% down a little from its 2.2% peak over the last 30 days.
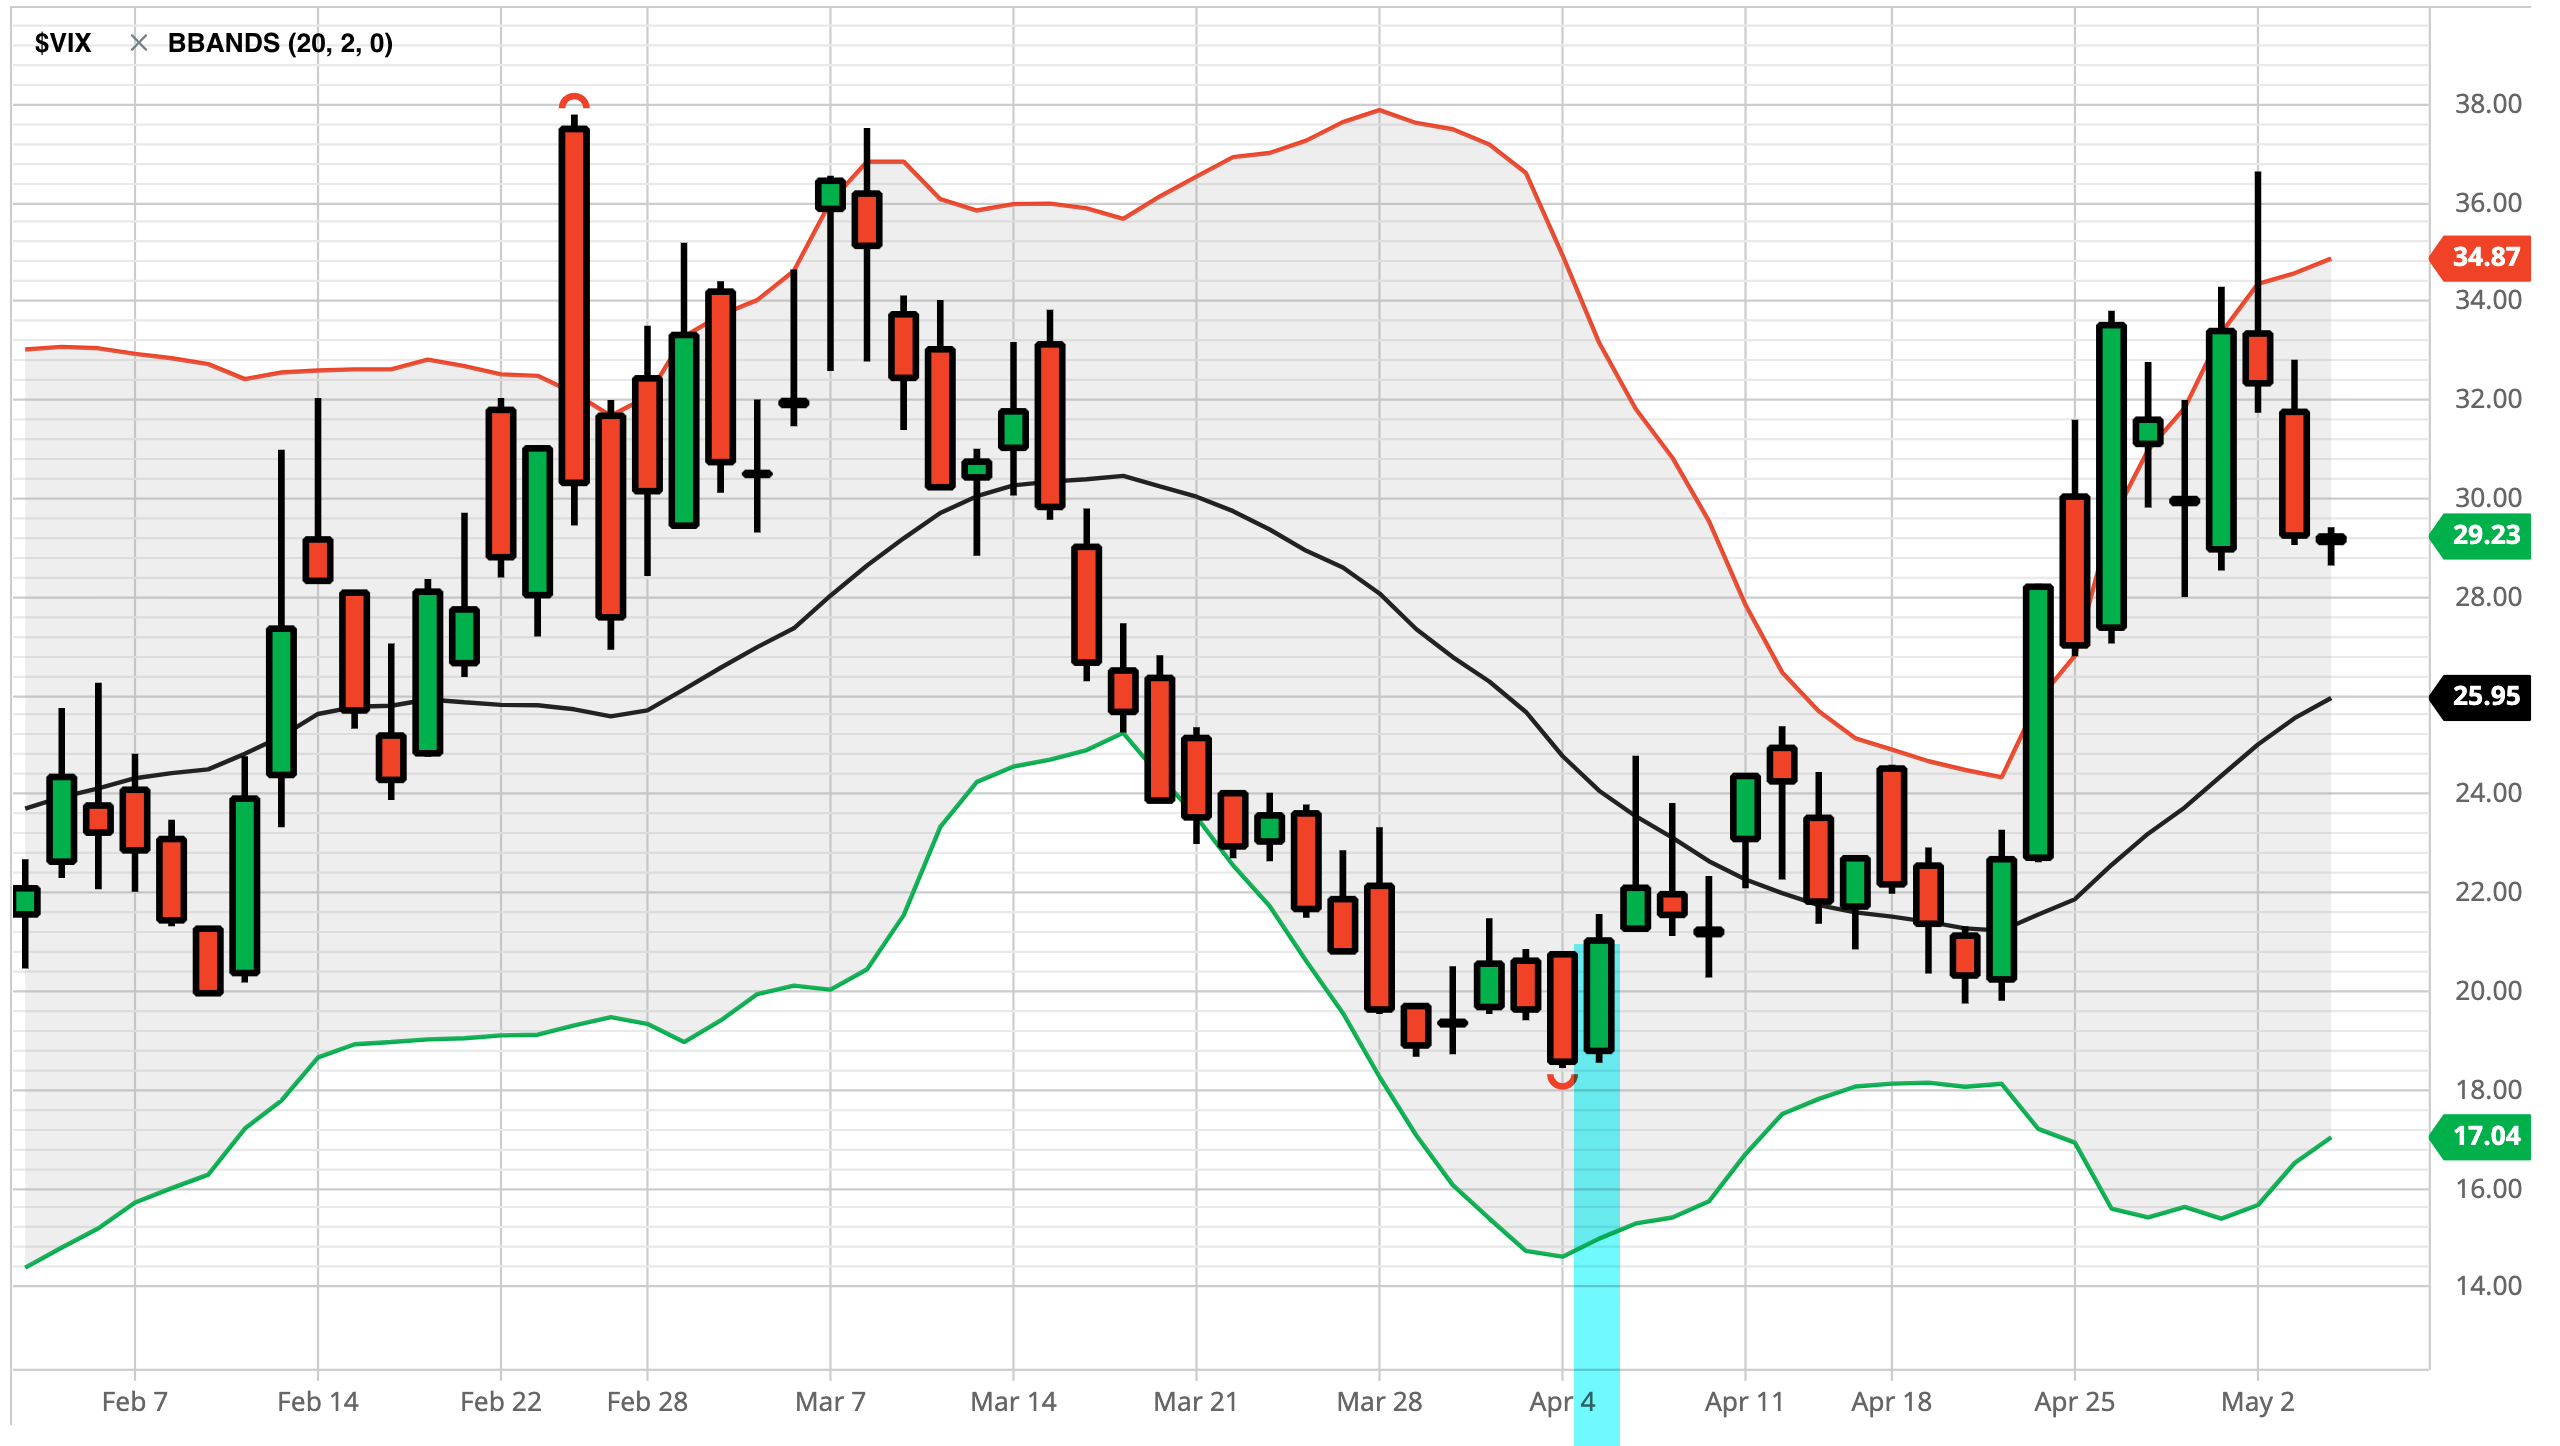
Clearly, the options market is still pricing in a volatility expansion or a wider range of stock prices.
Today is a big day for stock, bond, and commodity investors and traders as the Fed FOMC will announce its plans. According to data from CME, the Fed funds futures imply an expected 99.8% chance of a 0.50% interest rate increase. So, the market is clear about its expectations of the direction of short-term interest rates.

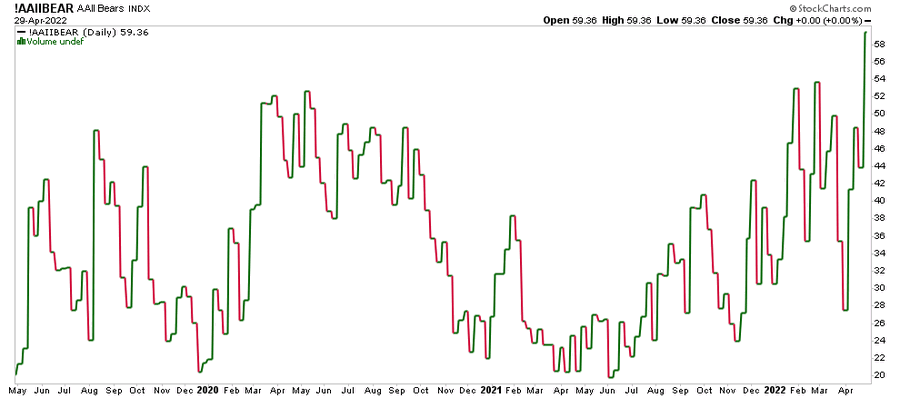
Individual investors are more bearish than they were in March 2020.
News eventually turns negative and the environment becomes hostile. The levels of bullish sentiment and risk-taking prove to be excessive. As prices trend down it drives bearish sentiment and selling, putting further downward pressure on prices.
There is certainly cause for concern by many measures.
For example, I’ve been saying; it’s eventually going to be payback time for the windfall stock market investors have received over the last decade if you don’t actively manage risk for drawdown control.
I say it’s eventually going to be payback time for the windfall stock market investors have received over the last decade because the Shiller PE Ratio has been extremely elevated, indicating stocks are generally expensive and overvalued.
The Shiller PE ratio for the S&P 500 is a price-to-earnings ratio based on average inflation-adjusted earnings from the previous 10 years, known as the Cyclically Adjusted PE Ratio (CAPE Ratio), Shiller PE Ratio, or PE 10.
The highest the Shiller PE Ratio reached was 44 at the Tech Bubble peak in 2000, now it’s at 35, the second-highest level in 140 years, and double the average and median.
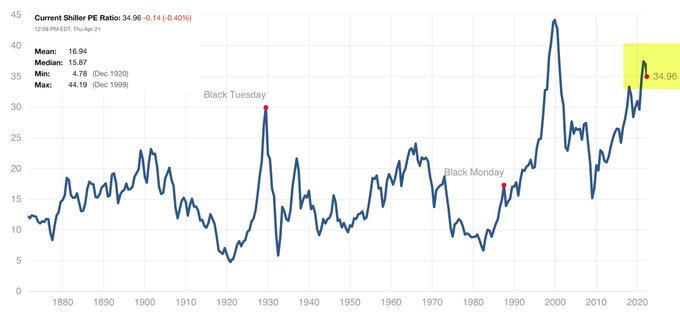
This long-term valuation measure is very bearish for the big picture.
Up until now, the high multiple of earnings prices was trading could be justified because of the very low level of inflation over the past decade.
That is no longer the case, and stock prices have trended down to reflect a new trend in inflation (rising prices.)
We haven’t seen the prices of things we buy increase this much, or the rate of change, in a long time.
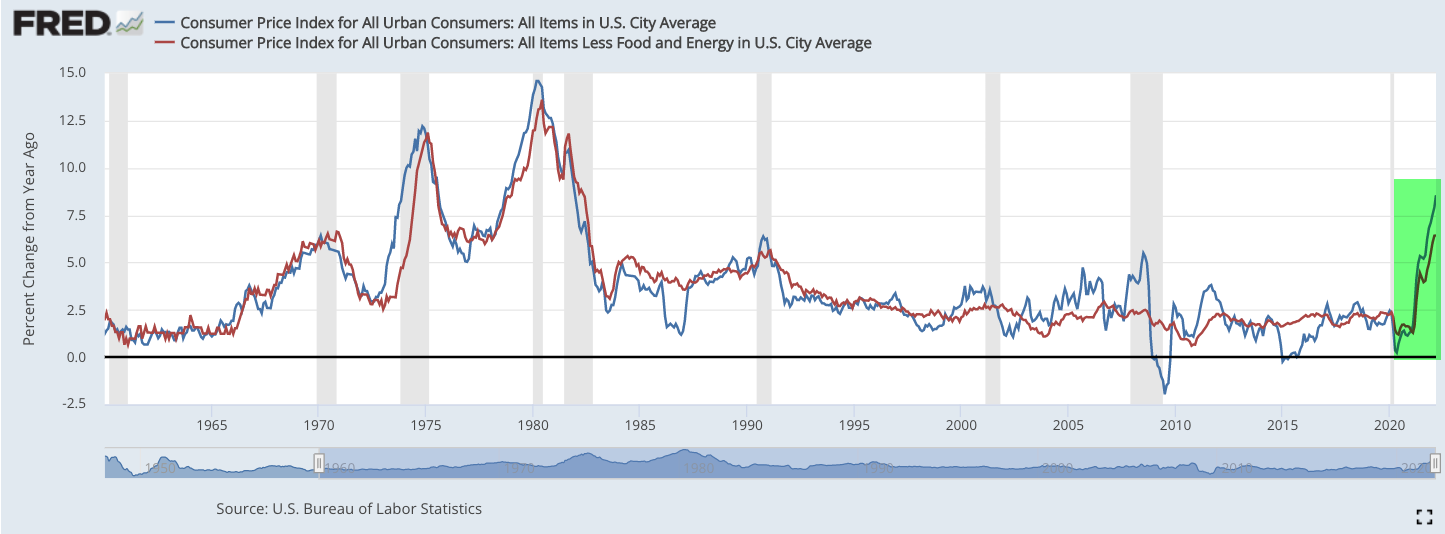
The Fed has been employing radical policies to stimulate the economy and prop up the stock market since the 2008 “Global Financial Crisis”, and it’s time to pay the piper.
The windfall investors received from buying and holding stocks and bonds is an anomaly, not their skill, so govern yourself accordingly.
Past performance does not assure future returns.
At times like this, it’s more likely the opposite.
That’s the big picture, here are some observations I see when I zoom in to the here, and now.
I’ve already pointed out that individual investors are very bearish according to the AAII survey and even more bearish than at the start of the global pandemic and waterfall decline in stocks in March 2020.
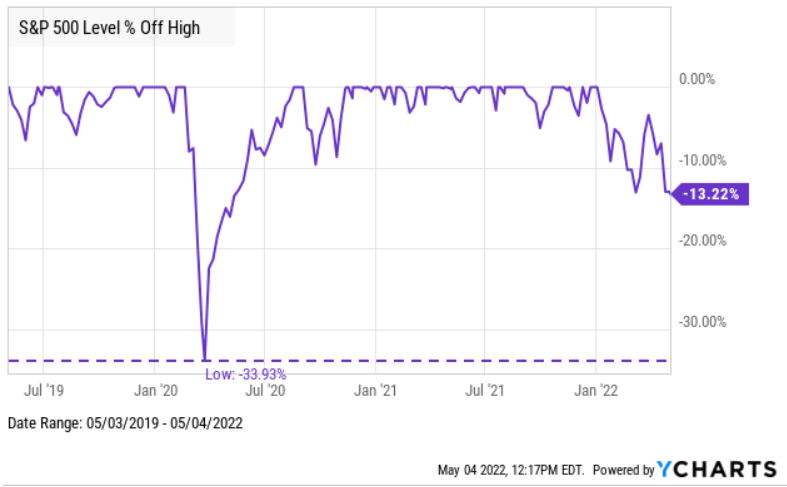
By waterfall decline, I’m referring to the -34% decline in the S&P 500 in the first part of March 2020 alone.
You can probably see it’s a big deal that individual investors surveyed are more bearish now than they were then. In comparison, here is a drawdown chart from YCharts showing the S&P is currently “only” down -13% from its high, far from the waterfall decline in 2020.
In the short run, though, there are some negatives becoming more positive, at least temporarily.
The Technology Sector has earned the top weighting of over 27% of the capitalization-weighted S&P 500 stock index.
Below is the price trend for the S&P 500 Information Technology Index, which shows it has found support, or buying interest, around the current level several times this year.

While the S&P 500 Information Technology Index is a sell from a trend following perspective, it has the potential for a countertrend if it can continue to hold the line. If it doesn’t and breaks below the lows, it’s probably going to get real ugly.
Looking inside the S&P 500 Information Technology Index, I monitor the percent of stocks above/below the trend-following moving averages.
At this moment, 38% of the S&P 500 Information Technology Index stocks are above the 5-day average, 23% are above the 20 day, and only 17% are above the 50-day average and the 200-day average.
Here’s what the percent of S&P 500 Information Technology Index stocks above the 50-day moving average looks like.
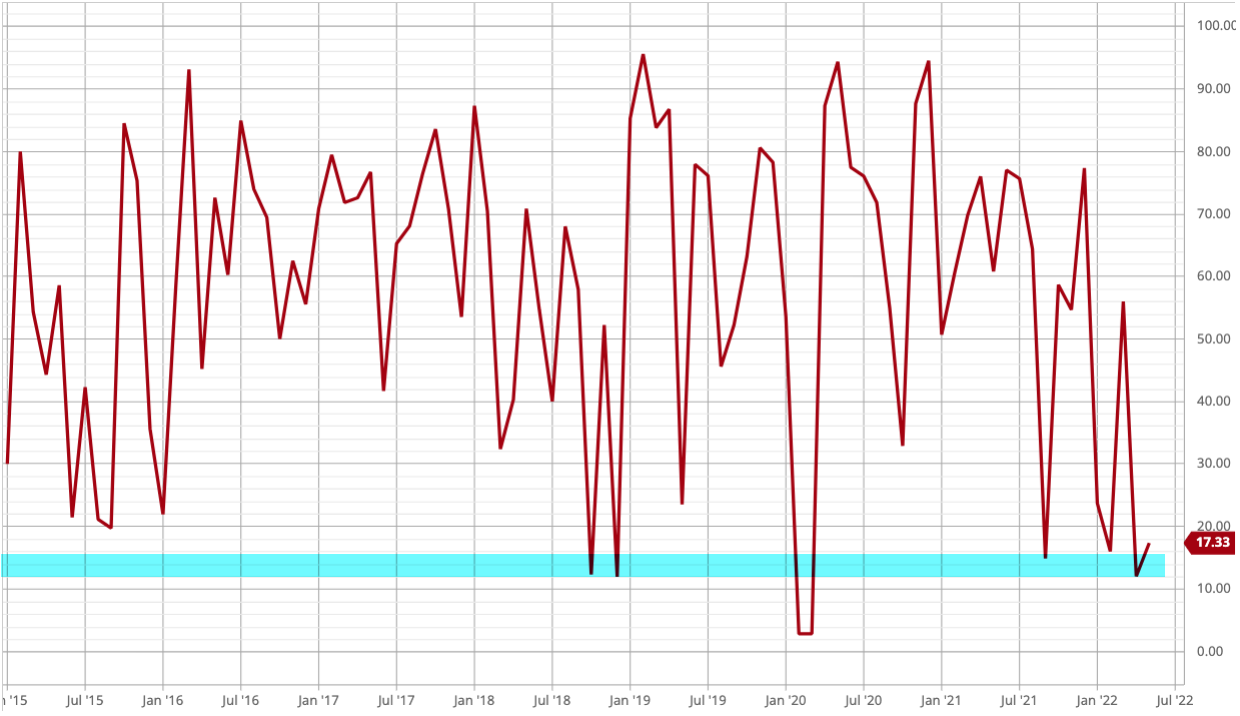
Yes, it’s pretty washed out as most of the technology stocks are already in downtrends, but that doesn’t imply they can’t go lower, but instead that selling pressure has already pushed the prices down to a level we normally see at lows.
Healthcare is the second-largest exposure in the S&P 500 at 14% of the index. While isn’t only about half of the Technology allocation, it’s material position size in the index.
The S&P 500 Health Care Sector Index has also trended down to near its prior low earlier this year, and its volatility has expanded as we can see in the volatility Bollinger Band around the price trend spreading out.

Like the Technology sector, it’s bearish looking from a trend following perspective, but after prices move to an extremely high or low, we start to wonder if the buying/selling has exhausted.
To get a clue, I look at the percent of stocks in the sector relative to their trend-following moving averages.
I also measure their momentum, volatility, and relative strength for overbought oversold, relative value of options prices, but for brevity, I’m showing only the basics.
As of right now, the S&P 500 Health Care Sector Index shows 51% are above the 5-day average price, 9% above the 20-day, 23% above the 50-day, and 33% of health stocks are above the 200-day average.
Here’s the visual on a chart.

Healthcare stocks have been under selling pressure, so the question is have those with a desire to sell already sold? What we know is it is reaching a level we’ve historically seen the downtrends start to shift back to uptrends, but it could always go lower.
Past performance is no guarantee of future results.
Next up is the S&P 500 Consumer Discretionary Sector Index, which has earned a weighting of 11.5% in the S&P 500 index, after these three sectors are reviewed, these three of eleven sectors are 53% of the overall allocation in the broad-based index.
The recent price trend of the S&P 500 Consumer Discretionary Sector Index looks similar to the others, as selling pressure has pushed down the prices to the prior low reached earlier this year.
Historically the S&P 500 Consumer Discretionary Sector Index has found buying interest at this level, but we’ll soon see if buyers continue to support this level or higher, or if it trends down to a lower low and a downtrend.

Below is the breadth trend of the stocks in the S&P 500 Consumer Discretionary Sector Index as defined as the percent of stocks above the 50-day average.
Once again, we see a washed-out condition, as 75% of the S&P 500 Consumer Discretionary Sector stocks are below the 50-day average price, and only 25% are above the 50-day average.

My interpretation is the stock market has already been dominated by sellers.
Sellers have already pushed stocks down near the low levels they have historically bottomed and reversed back up.
But, this time is different.
We now have high and rising inflation, and that’s not great for the multiple of earnings stocks trade.
I believe in the weeks after this Fed announcement today, we’re going to see what we got.
If these price trends keep trending lower, it’s likely to be a very ugly long drawn out bear market without the Fed providing its life support.
And then there’s the bond situation, but we’d do that later.
I expect to see some bounce, but what the price trends do in the coming weeks is more telling.
If we don’t see a bounce, look out below.
Sellers haven’t capitulated, but they will.
We’ve been very busy at Shell Capital coming off the best year in 2021 we’ve had in a decade and another great year in 2022 thanks to some asymmetric risk/reward payoffs from tactical trading and long exposure to commodities and other alternatives.
Individual investors are facing the most hostile conditions in decades right now with no place to hide for stock and bond investors, so we have decided to open our door to new clients for the first time in many years. The ASYMMETRY® Managed Portfolios program provides independent custody at Folio Institutional® by Goldman Sachs. Our clients own their accounts titled in their own name at Goldman Sachs, independent of us, and they give us the authority to trade their managed accounts via our investment management agreement.
If you need help, don’t hesitate to contact us.
We couldn’t be more prepared for whatever happens next, and we’ve tactically executed through challenging conditions many times over more than two decades.
Although we can’t assure future success, we’ve stacked the odds in our favor and can do the same for you.
Send us an email to see how we can help guide you in the right direction.
Mike Shell is the Founder and Chief Investment Officer of Shell Capital Management, LLC, and the portfolio manager of ASYMMETRY® Managed Portfolios. Mike Shell and Shell Capital Management, LLC is a registered investment advisor focused on asymmetric risk-reward and absolute return strategies and provides investment advice and portfolio management only to clients with a signed and executed investment management agreement. The observations shared on this website are for general information only and should not be construed as investment advice to buy or sell any security. This information does not suggest in any way that any graph, chart, or formula offered can solely guide an investor as to which securities to buy or sell, or when to buy or sell them. Securities reflected are not intended to represent any client holdings or recommendations made by the firm. In the event any past specific recommendations are referred to inadvertently, a list of all recommendations made by the company within at least the prior one-year period may be furnished upon request. It should not be assumed that recommendations made in the future will be profitable or will equal the performance of the securities on the list. Any opinions expressed may change as subsequent conditions change. Please do not make any investment decisions based on such information, as it is not advice and is subject to change without notice. Investing involves risk, including the potential loss of principal an investor must be willing to bear. Past performance is no guarantee of future results. All information and data are deemed reliable but are not guaranteed and should be independently verified. The presence of this website on the Internet shall in no direct or indirect way raise an implication that Shell Capital Management, LLC is offering to sell or soliciting to sell advisory services to residents of any state in which the firm is not registered as an investment advisor. The views and opinions expressed in ASYMMETRY® Observations are those of the authors and do not necessarily reflect the position of Shell Capital Management, LLC. The use of this website is subject to its terms and conditions.

You must be logged in to post a comment.