With perfect hindsight, we now all know that January 26th was the recent price peak in the U.S. stock market. Since then, the S&P 500 has declined about -10% and the Dow Jones Industrial Average about -12%. For simplicity, I’m going to focus on U.S. stock market here.
I wasn’t surprised to see the decline and am not surprised to see “more volatility,” because it would be getting back to “normal.”
But I see recent price action has sure gotten the attention of many on social media. Some even seem dazed and confused.
I’m not surprised about that, either.
On January 11, before stock market declined prices started swinging up and down (volatility), I shared an observation with my friends on Twitter and a warning:
On January 24th, I again warned of complacency. The message was clear:
At this point, this is a normal and expected “correction” of what was an upside overreaction in the prior months. The stock index has declined about -10%, regained some of the loss in March and more recently retested the February 8th low. As long as the lows hold, I consider this a normal correction.
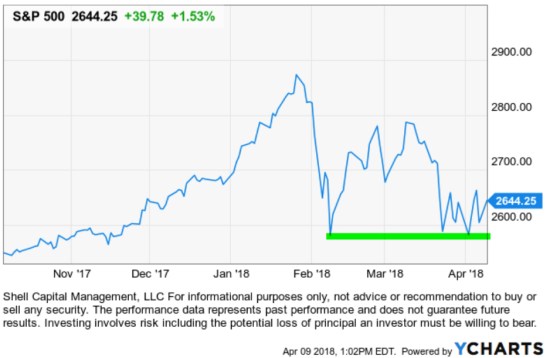
Sure, the decline was sharp and fast, but that’s no surprise for me after such an upside move. I said it was “expected” because, as I pointed out above, 2017 was very abnormal because it lacked the typical -5% to -10% declines we normally see over most 12 month periods in the stock indexes.
Another way I define a “normal correction” is a simple trend line drawn under the price over the past 12 months. Without adding a lot of complicated looking indicators to express it, below we see the stock index has just “reverted to its trend.” The peak in December and January was an abnormal overreaction on the upside, which I pointed out as it was happening. The recent -10% decline has simply put the trend back in a more normal range.

What is normal, typical, or expected?
I’m observing a lot of commentaries as if this correction and volatility isn’t normal. The fact is, many people often include their emotions and feelings along with price action.
Investors perceive what they believe is driving a price trend and what they believe is always true for them.
The February decline was commonly blamed on “the machines,” which got a little silly.
This time, it’s geopolitics.
I believe it’s just the market, doing what it does, and there are so many drivers at the same time I don’t bother to attempt such a narrative. My narrative is simple; the force of sellers took control and outweighed the enthusiasm of buyers. It is just the market, doing what it does.
I’ve been seeing and experiencing these trends so closely for so long and I remember the regime shifts. I want to share with you my observations of what have been “normal” corrections in terms of drawdowns. A drawdown is the % decline from a prior price high to its low. I show only the period of the past 9 years, which is one of the longest bull markets in history (without a -20% decline).
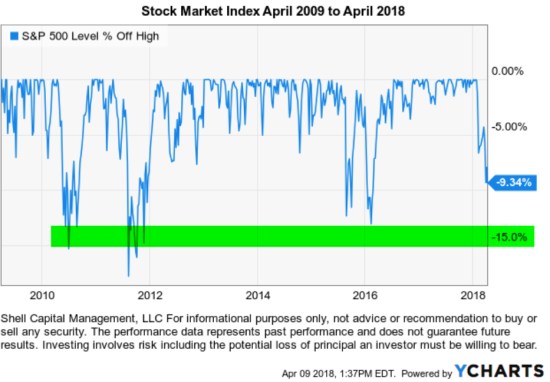
As you can see, since April 2009, we’ve seen four declines of -15% or more and it took them several months to recover.
These declines of -15% or more are why many people have been unable to hold on to the stock market since the March 2009 low with any meaningful allocation to stocks. When prices fall -10%, investor sentiment shifts from greed to extreme fear. Some of them may even begin to tap out by selling their stock holdings for fear of more losses.
To be sure, here is an investor sentiment indicator at the February 8, 2018 low.

In fact, investment managers like me who have dynamic risk management systems may even sell to reduce exposure to loss as an intentional drawdown control. But this time, as I pointed out, the stock market was already at risk of a reversal before this decline. So, a robust risk management system may have reduced exposure before the decline, not after.
We find that declines over -10% get more attention, especially when they get down to -15%. Those can also be more hostile conditions for trend systems, too, as risk management systems cause us to exit and later re-enter.
The point is, over the past 9 years a -15% decline has been a “normal” occurrence and there are many -5% (or more) declines too.
It is only at a -10%, so far, and that’s not unusual.
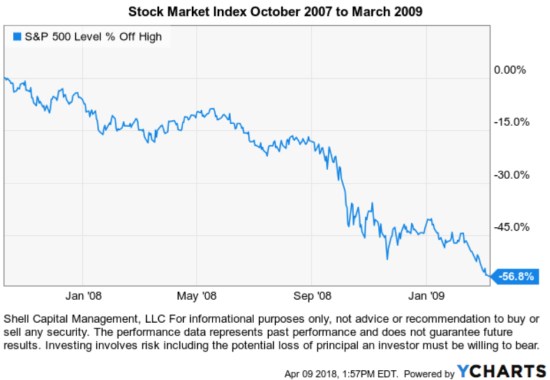
I intentionally used the last 9 years. Not to show an arbitrary 9 year period, but instead to intentionally leave off March 2009. I did that because the first three months of 2009 was a -24% decline, a continuation of the 2008 waterfall decline. The stock market was still in the bear market that began October 2007. So, this wouldn’t be complete without a reminder of what that period looked like before I go on to show the pre-2008 period.
All bear markets do necessarily begin with declines of -10%, -15%, -20% . They are actually made of many swings up and down along the way. We often hear people speak of the last bear market as “2008” as though the only loss was the -37% decline in the S&P 500 in 2008.
That is far from reality.
The decline was -56%.
The drawdowns we’ve seen since 2008 are more than twice what we saw in the bull market from 2003 to 2008 after the “tech wreck.” Below we see the typical decline then was closer to -5% with only a few getting into the -7% or more range. 
Clearly, it was a lot easier to hold a larger allocation of stocks, then.
What is normal and what has changed?
The last 9 years has been more hostile for passive asset allocation investors to hold on to their stock positions because the declines were -15% or so and take months to recover. It’s also been more challenging for active risk managers since a drawdown control system necessarily reduces exposure as prices fall with the intent to control drawdown.
But, to define what is normal today, a -10% to -15% decline is within a normal corrective drawdown.
The recent past matters simply because that’s what investors and traders anchor to. Most people put more emphasis on the recent past. Our experience and how much we’ve studied and observed the trends determine how much we can recall easily. I’ve been an investment manager most of my life, over two decades now. For me, it hasn’t been a hobby or part-time venture, it’s what I do and who I am. So, my memory of these trends and intuitions about what is normal, or not, is what it is.
If you are wondering, here are the drawdowns for the S&P 500 going back about 70 years. I highlighted the -15% declines or more, which obviously gets investors attention.

Clearly, there are a lot of -15% or greater declines. In fact, there are several -30% and three in the -45% or larger drawdowns.
Knowing this, it’s why I say:
We believe world markets require active risk management to avoid large losses and directional trend systems to position capital in profitable price trends.
And, I also say:
It doesn’t matter how much the return is if the downside risk is so high you tap out before it’s achieved.
But at this point, you can probably see that the current -10% decline is so far within a “normal correction.”
Though, as I shared in The enthusiasm to sell overwhelmed the desire to buy March 19, 2018, I expect to see more swings (volatility) than last year, and that would be “normal” too.
I define this as a non-trending market. When I factor in how the range of price movement has spread out more than double what it was, I call it a non-trending volatile condition.
Markets decline to a low enough point to attract buying demand. Only time will tell how it all plays out from here.
If you enjoyed this, I encourage you to read “What About the Stock Market Has Changed? A Look at Ten Years of Volatility”
Mike Shell is the Founder and Chief Investment Officer of Shell Capital Management, LLC, and the portfolio manager of ASYMMETRY® Global Tactical.
You can follow ASYMMETRY® Observations by click on on “Get Updates by Email” on the top right or follow us on Twitter.
The observations shared in this material are for general information only and are not intended to provide specific advice or recommendations for any individual. Investing involves risk including the potential loss of principal an investor must be willing to bear. Past performance is no guarantee of future results.

You must be logged in to post a comment.