You probably want to invest in stocks right now, I bet.
If you are already invested in stocks, you probably want to be more aggressive in investing in stocks. Maybe it’s selling bonds to buy more stocks, or investing that extra cash, or something really aggressive like adding leverage or buying more risky stocks.
I believe this because investor sentiment is dialed up and 2020 started out about as enthusiastic as it gets. Well, and we’re getting calls from people wanting to invest.

The Fear & Greed Index is driven by seven different investor sentiment indicators. If you’re an investor, I encourage you to use it as a gauge for your own enthusiasm and panic. When you feel one way or another about the future direction of the stock market, check the indicator to see what emotion is driving the stock market now.
Avoiding costly mistakes is essential in money management, so if we can help you avoid buying too high and then tapping out at the lows, that’s an edge. That’s the behavioral counseling we do; investor behavior modification. It’s one of the main observations I share here. If nothing else, I hope I can help you avoid making costly emotional decisions as many investors do.
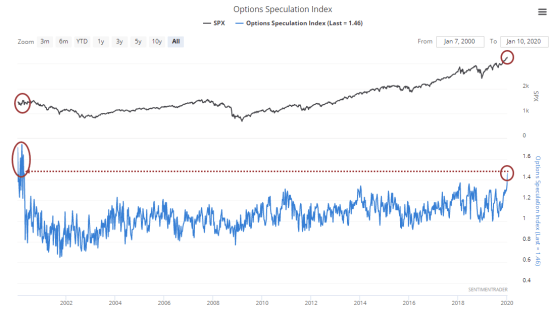
The Options Speculation Index measures speculative call buying as a % of total option activity. Right now, it shows the options market bought to open 21.6 million speculative call options, the most ever, according to SentimentTrader. The previous record was 19.7 million during the week of Jan 26, 2018. The total bullish/bearish volume was the most since March 2000. This is extreme.
Investors sentiment trend to follow price trends, so investors or trend followers.
After prices trend up, investors get more bullish, expecting the gains to continue.
After prices trend down, investors get more bearish, expecting the losses to continue.
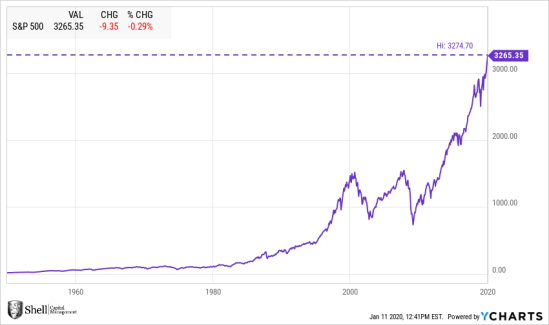
So, it isn’t a surprise to see this level of enthusiasm, considering the stock index is at an all-time high.
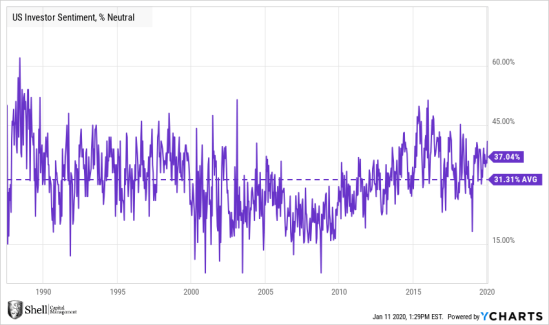
The AAII Investor Sentiment Survey is a another gauge that offers insight into the mood of individual investors. Each week, AAII asks its members a simple question: Do they feel the direction of the stock market over the next six months will be up (bullish), no change (neutral) or down (bearish)? They refer to this question as the AAII Sentiment Survey. Since they started polling members in 1987, our survey has provided insight into the moods of individual investors.
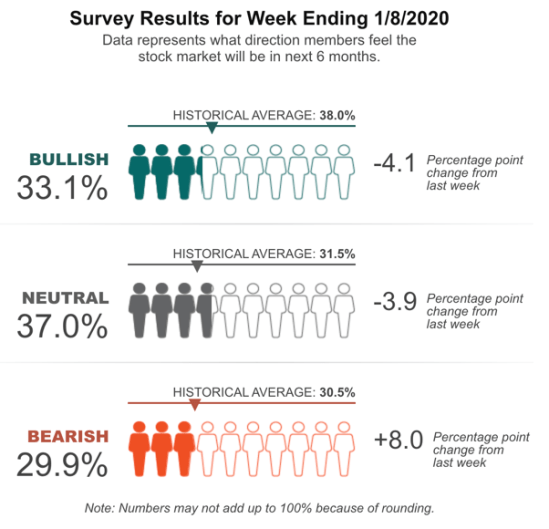
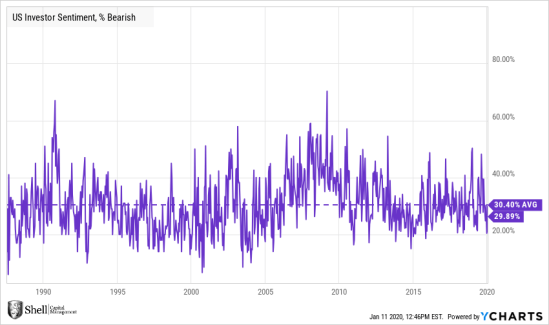
Pessimism among individual investors about the short-term direction of the stock market is at a six-week high. The latest AAII Sentiment Survey also shows lower levels of bullish and neutral sentiment. Below is a chart I drew of the % Bearish sentiment from the survey with a line marketing its long-time average. Investors are not bearish, as the level is at its long term average. So, this gauge doesn’t match the Extreme Greed of the Fear & Greed Index.
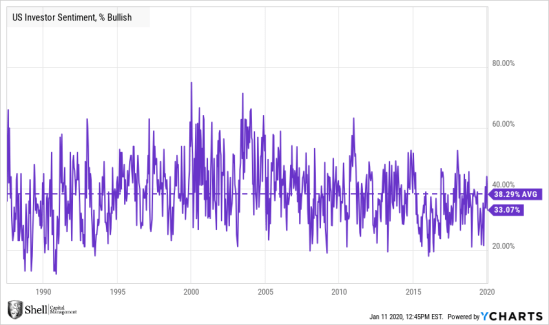
The % Bullish is actually below average by this measure. Bullish sentiment, expectations that stock prices will rise over the next six months, fell 4.1 percentage points to 33.1%. The historical average is 38.0%. Optimism has been below this average during 41 out of the last 52 weeks.
AAII guesses:
Two important conclusions:
“The failure of sentiment to work perfectly highlights two important points. Though correlations between sentiment levels and market direction have appeared in the past, the AAII Sentiment Survey does not predict future market direction. Overly optimistic and pessimistic investor attitudes are characteristics of market tops and bottoms, but they do not cause stock prices to change direction. Rather, it is changes in expectations of future earnings and economic and valuation trends that move stock prices. The timing of such changes has proven to be difficult to predict with accuracy.
This leads to my second concluding point: Never rely on a single indicator when forecasting market direction. Rather, consider a variety of factors—including prevailing valuations, economic data, Federal Reserve policy, government policies and other prevailing macro trends—and allow for a large margin of error in your forecast.:
As the saying attributed to John Maynard Keynes goes, “the market can stay irrational longer than you can stay solvent.”
As many studies like Dalbar show; individual investors have difficulty achieving good results over the long term, so they must be focused and doing the wrong things.
“Since 1994, DALBAR’s Quantitative Analysis of Investor Behavior (QAIB) has measured the effects of investor decisions to buy, sell and switch into and out of mutual funds over short and long-term timeframes. These effects are measured from the perspective of the investor and do not represent the performance of the investments themselves. The results consistently show that the average investor earns less – in many cases, much less – than mutual fund performance reports would suggest.”
None of the global macro news items they listed can possibly be predicted, so it is futile. So, if investors using this type of information for investment decision making, you can probably see how they may end up “switching in and out of mutual funds” at the wrong time.
By focusing on the price trend and its statistical possibilities and actively managing risk and drawdown, I believe we stack the odds in our favor by focusing our resources on the few things we can control.
Is it a good time to buy stocks? That’s my next observation as I’ll share the big picture.
Got questions? need help? Send me an email here.

You must be logged in to post a comment.