I know, you’re thinking this is about the Tennessee Vols.
Nope.
Different vol.
I’m not talking about Tennessee Volunteers, I’m talking about the volatility of the stock market.
Someone asked:
“With the S&P 500 is up 3.43% on Friday, volatility is up, way up. So, why is the VIX down -16%? “
The short answer is the CBOE Volatility Index (VIX) is volatility implied by S&P 500 options prices, so it’s expected future volatility, not actual or realized historical volatility. In fact, the VIX is an estimate of volatility for the next 30 days. Part of the price of S&P 500 options is an estimate of how volatile the S&P 500 will be between now and the option’s expiration date. This estimate is not directly observed but is implied by how much buyers are willing to pay for options. If the market has been volatile as it has been recently, option premiums will increase with the volatility expansion. When the stock market is calm and smooth like it was in 2017, options prices will decrease as a volatility contraction. So, the VIX is implied volatility, not historical realized volatility.
Since investors tend to extrapolate the recent past into the future, they usually expect recent calm markets to continue and violent swings to persist. However, we’ve experienced nearly a year of a high volatility regime with the S&P 500 swinging up and down in a range as high as 20%. However, we’ve now seen two high volume up days and the second is considered to be an upward follow-through day. Such a thrust seems to have the options market expecting lower volatility over at least the next month. That’s how I see it. Others may believe its a reaction to the economic news. It is what it is.
What is perplexing to those not familiar with VIX movement is it decreased so dramatically as the price actually gained a lot. Volatility actually expanded, but to the upside, and implied volatility evaporated. That doesn’t sound like a volatility gauge.
Another issue is not all volatile calculations really measure upside and downside vol the same way. Below is the S&P 500 index.
- The first chart in the next window below the price trend is an average true range (ATR) of the price over the past 14 days.
- The second chart is the VIX.
- The chart in the last window is the standard deviation.
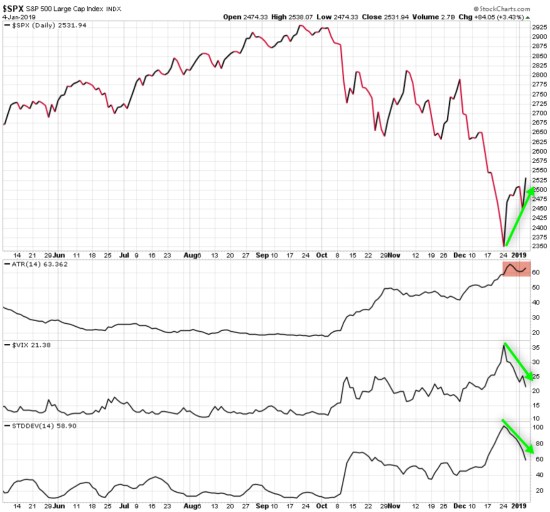
A few observations:
- The price of the S&P 500 has increased sharply the past two weeks.
- The VIX is trending down sharply and so is the standard deviation.
- The average true range isn’t trending down. It has stayed about the same.
As the price has spiked up, historical volatility as measured by standard deviation is trending down sharply and so is implied volatility. The only measure actually accounting for this wide range of prices (up in this case) is the average true range.
You may be wondering why?
Standard deviation a statistical model that measures the volatility of a price trend. The calculation assumes that two standard deviations should contain 95% of the price data.
The average true range includes the total “true” range of the price trend by comparing highs, lows, and closes, and compares the price change over different days to account for gaps up and down in price.
As you can see, the average true range of price appears to more accurately reflect the volatility as prices spread out. The standard deviation is recovering from the large deviations as the average true range is reflecting remaining day to day volatility.
What does it matter, anyway?
Volatility measures may be used to create indicators for trading signals. For example, in the chart, I added channels above and below the price trend that are 2 times the standard deviation. These bands are expected to include about 95% of price action.
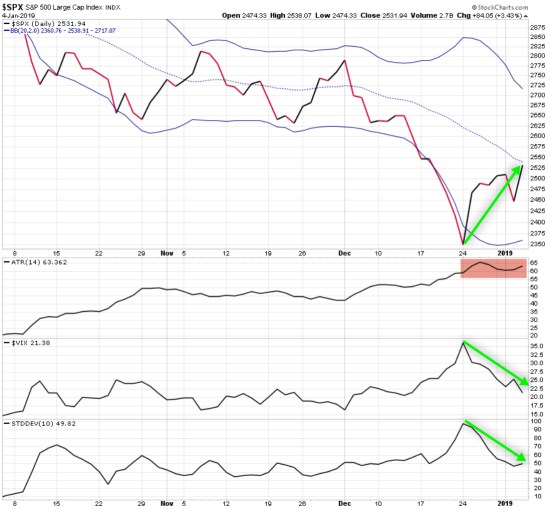
There are two ways it may be used for tactical trading.
A trend following system may use them to identify a breakout because moves outside the price range are rare. A trend following system expects such strong momentum will continue.
- When the price breaks out the upside, a trend follower may buy, expecting the momentum of the price will keep trending up.
- If the price breaks out to the downside, the trend following system may sell (short), expecting the downside momentum to continue.
A countertrend system does just the opposite.
- If the channel is reached on the upside, the countertrend system will sell, expecting the price will reverse back down within the range.
- If the price falls to the lower channel, the countertrend system will buy, expecting the price is more likely to trend back up within the range.
I’m just sharing this as an observation to answer a question. We could test these signals to see their results as a system to quantify which one may have a better asymmetric risk/reward. But, for this purpose, we can see how these three volatility indicators are similar or different.
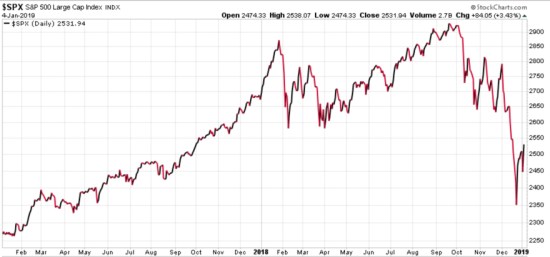
I could have titled this observation “A Tale of 4 Vols” since we can observe the distinctions between “lower volatility” and “higher volatility” by simply looking at the price trend. Over the past two years, we’ve certainly observed a period of low vol change into high vol. I call it a volatility expansion and though, for me, using the VIX and other indicators signaled the possible change, the price trend itself is the final arbiter.
By the way, what about the other vol? The Tennessee Vol? Why do they call Tennessee the “Volunteer State” and the Tennessee Volunteers?
Appalachian Magazine shares the story:
“The proclamation went out from Nashville that the federal government needed 2,600 volunteers to assist in the war with Mexico… Within a week’s time, more than 30,000 Tennesseans responded to the call to arms. And it was from this overwhelming show of patriotism that the State of Tennessee not only assisted in winning the outright sovereignty of the State of Texas, but also in securing its lasting title as The Volunteer State.”
So, there you have it.
I guess I could have titled this observation “A Tale of Five Vols.” You can probably see how observations can spread out to a wider range and become more volatile. It’s even true for the topic of volatility.
Mike Shell is the Founder and Chief Investment Officer of Shell Capital Management, LLC, and the portfolio manager of ASYMMETRY® Global Tactical.
The observations shared on this website are for general information only and are not specific advice, research, or buy or sell recommendations for any individual. Investing involves risk including the potential loss of principal an investor must be willing to bear. Past performance is no guarantee of future results. The presence of this website on the Internet shall in no direct or indirect way raise an implication that Shell Capital Management, LLC is offering to sell or soliciting to sell advisory services to residents of any state in which the firm is not registered as an investment advisor. Use of this website is subject to its terms and conditions.

You must be logged in to post a comment.