I know, it sounds obvious, but yeah, expect wider price swings in a volatility expansion.
The CBOE S&P 500 Volatility Index (VIX) is a popular measure of the stock market’s expectation of volatility based on S&P 500 index options. The VIX Index is a calculation designed to produce a measure of a constant, 30-day expected volatility of the US stock market, derived from real-time, mid-quote prices of the S&P 500® Index (SPXSM) call and put options.
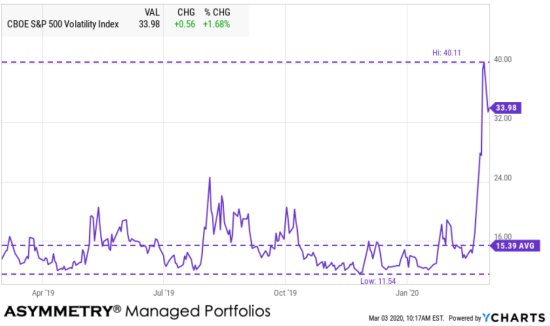
The VIX index shows us the 30-day expected volatility increased 200% during the February 2020 volatility expansion. I may have to define this rate of change as a volatility explosion. Expansion is the act or process of expanding to become or make larger or more extensive. An explosion is a rapid increase in volume and release of energy in an extreme manner. This looks explosive.
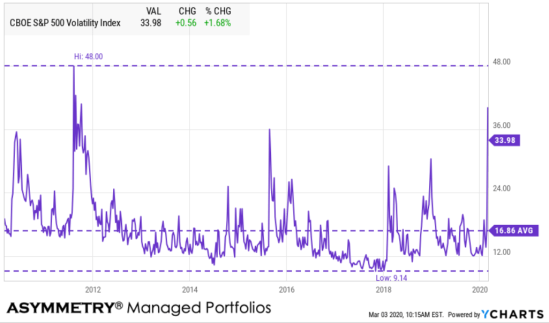
Viewing it over a wide range of the past 10 years, the 30-day expected volatility is elevated to the second-highest level seen since the 2007-09 stock market crash. In 2011, the VIX spiked to 48.
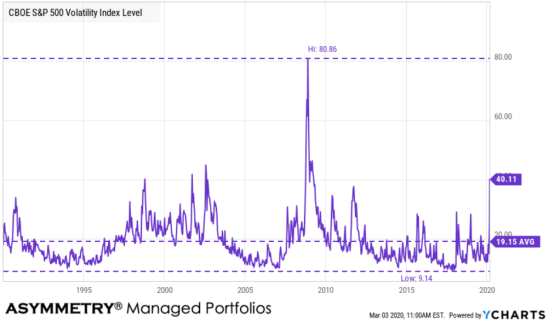
Putting it into an even broader perspective with the larger sample size of 26 years of historical data, the recent 40 level is about as elevated as 30-day expected volatility gets.
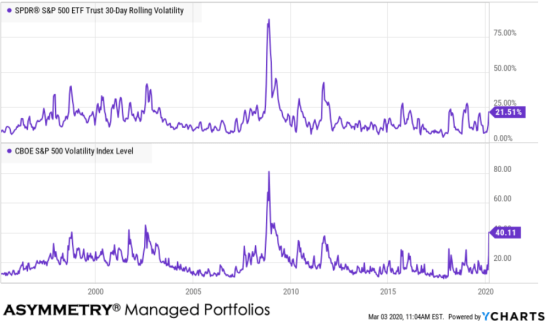
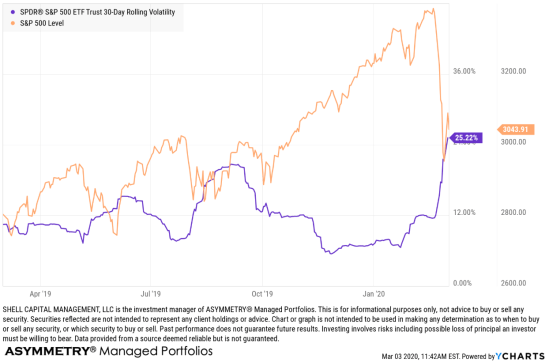
I observe volatility from a perspective of both implied (expected) volatility and historical (realized) volatility. Implied volatility a measured by the VIX Index, is typically priced at a premium since options trading sentiment tends to have more of a hedging tilt. In theory, the VIX at 40 suggested expected 30-day volatility of 40%, which is much higher than the 21.5% realized vol as measured by 30-day Rolling Volatility derived from the actual past 30 days of price action. This is just an idealized, overly simplified example, but the point is both realized and expected vol is elevated.
Asymmetric volatility is what we see when equities fall sharply. The asymmetric volatility phenomenon is the observed tendency of equity market volatility to be higher in declining markets than in rising markets. Volatility tends to decrease after prices have trended up as investors and traders (the market) become more and more complacent, expecting a smooth uptrend will continue. Then, after prices decline, complacent investors and traders are caught off guard and surprised when prices trend down, and the more prices fall, the more they fear losing more money. The fear of losing money, then, is another driver of asymmetric volatility; Investors experience the pain of loss twice as much as the joy of gains. Nobel Prize-winning behavioral research finds that losses loom larger than gains and that people are loss averse. So, after prices have fallen, investors and traders sell simply because prices are falling, to cut their losses, and avoid larger losses. This selling pressure becomes a serial correlation, contagion, and prices keep falling until the desire to sell has dried up. It’s what I believe, at least, after studying and observing price trends in real-time professionally over two decades.
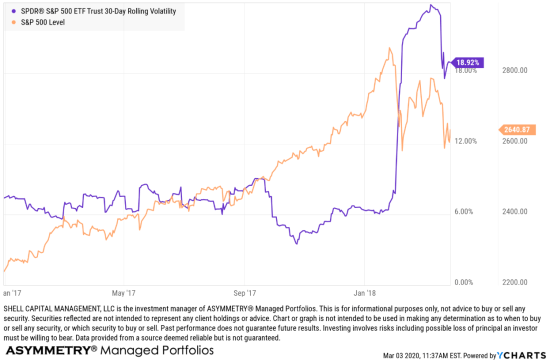
We saw asymmetric volatility expansion after the astonishingly smooth uptrend in 2017. In the chart, I overlay the 30 Day Rolling Volatility to visualize how the realized vol declined as the S&P 500 trended up quietly. But lower and falling volatility periods tend to be followed by periods of rising volatility.
US equities went on to recover two major price shocks and asymmetric volatility expansions in 2018, but here we are in 2020 seeing another smooth uptrend with great momentum interrupted by volatility expansion driven by a waterfall decline in stocks.
Asymmetric volatility is when prices drift (trend) up and then crash down.
When realized and implied volatility is elevated, we should expect to see price swings both up and down. Recovery from a downtrend like this is a process, not an event. We’ll probably see many swings up and down along the way, which is especially true if this unfolds into a bigger bear market level downtrend. Although anything can happen, bear markets don’t just happen all at once. The worst bear markets like 2007 to 2009 unfolded with price swings over many years, not just in 2008.
Only time will tell if this is the early stage of a bigger move, but in the meantime, expect larger price swings as prices spread out and the weight of investors decide which direction to lean.
Mike Shell is the Founder and Chief Investment Officer of Shell Capital Management, LLC, and the portfolio manager of ASYMMETRY® Global Tactical. Mike Shell and Shell Capital Management, LLC is a registered investment advisor in Florida, Tennessee, and Texas. Shell Capital is focused on asymmetric risk-reward and absolute return strategies and provides investment advice and portfolio management only to clients with a signed and executed investment management agreement. The observations shared on this website are for general information only and should not be construed as advice to buy or sell any security. Securities reflected are not intended to represent any client holdings or any recommendations made by the firm. I observe the charts and graphs to visually see what is going on with price trends and volatility, it is not intended to be used in making any determination as to when to buy or sell any security, or which security to buy or sell. Instead, these are observations of the data as a visual representation of what is going on with the trend and its volatility for situational awareness. I do not necessarily make any buy or sell decisions based on it. Any opinions expressed may change as subsequent conditions change. Do not make any investment decisions based on such information as it is subject to change. Investing involves risk, including the potential loss of principal an investor must be willing to bear. Past performance is no guarantee of future results. All information and data are deemed reliable but is not guaranteed and should be independently verified. The presence of this website on the Internet shall in no direct or indirect way raise an implication that Shell Capital Management, LLC is offering to sell or soliciting to sell advisory services to residents of any state in which the firm is not registered as an investment advisor. The views and opinions expressed in ASYMMETRY® Observations are those of the authors and do not necessarily reflect a position of Shell Capital Management, LLC. The use of this website is subject to its terms and conditions.

You must be logged in to post a comment.