When Donald Trump was elected the President of the United States the headlines read like this one from MarketWatch:
Dow futures plunge 750 points as Trump takes key battleground states
Stock markets are not handling Election Night well.
Futures for the Dow Jones Industrial Average plunged as Republican presidential nominee Donald Trump’s lead widened in the presidential race against Democratic rival Hillary Clinton.
And CNN:
Wall Street welcomes Trump with a bang – Business – CNN.com
Nov 9, 2016 – An overnight panic in global markets evaporated as Wall Street gave an … Trump’s election would bring about a plunge in the stock market. … “The selloff last night was an hysterical reaction,”
Since then I’ve heard a lot of hedge fund type investment managers who operate investment strategies that include risk management, hedging, or trend following complain about the hostile conditions. Some of them blame it on algorithms, but it seems most of them blame it on Trump’s tweets. One trader recently said:
“Trump completely screwed me over these past two years by rocking the markets with constant vol spikes. Had we had a reasonable president, I probably would have made a lot more money.”
To that, I replied:
“Well, ya know, “everyone gets what they want from the market” and personal responsibly (respond-ability) is the foundation of good results. SPX has gained 58% with declining vol since the last election.”
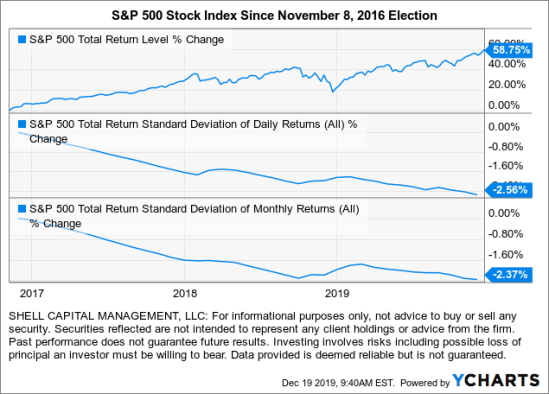
Sure enough, after the “plunge” headlines that probably shocked a lot of individual investors out of the stock market who weren’t already out, the S&P 500 went on to deliver an even more surprising total return since then. I also pointed out volatility as measured by standard deviations has somewhat declined since then.
Who knew?
No one!
Who believed the stock index would gain so much over a period of geopolitical instability and vol spikes?
I don’t know anyone. Well, except those who buy and hold. Periods like this are favorable to those who buy and hold. That is if they can hold through the drawdowns, volatility, and news headlines, which ain’t easy. Don’t forget, that would be the same investors who held through a -56% loss in the S&P 500 that took many years to recover from. Most people can’t do it, because when they’re down -50% they don’t know if the losses are over or will get even worse.
It only takes once.
So, the essential element is knowing your risk tolerance.
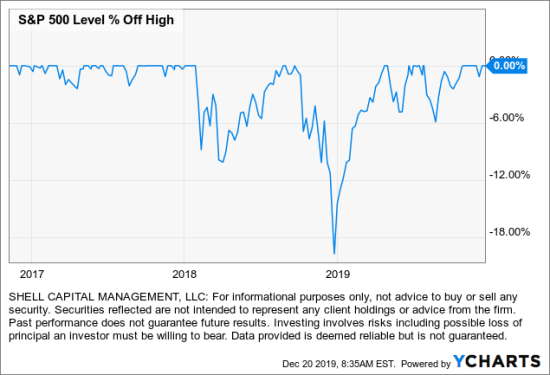
Standard deviation, a measure of historical volatility has declined, but that trend doesn’t reflect what real people deal with; drawdowns in their account values. Below are drawdowns in the stock index since the 2016 election. The first year as abnormally quiet, and then we’ve observed two very sharp waterfall declines.
My trader friend goes on to say:
“Yeah 2017 was phenomenal. This year, however, was absolute misery if you weren’t a buy-and-holder. Basically, any sort of “market goes up, quickly shocks down, then continues right back up again” just makes any sort of momentum/trend-follower system look like an idiot.”
To that I replied:
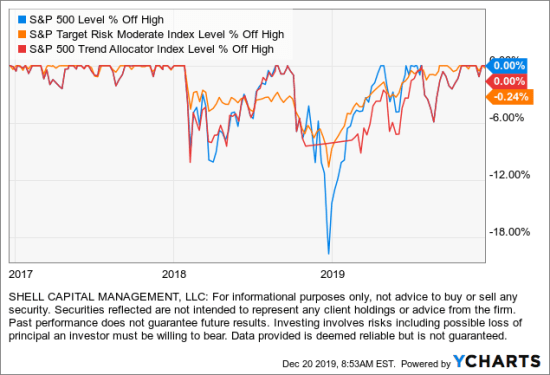
“It didn’t seem too bad to me. The S&P Trend Allocator index tracks the performance of a systematic trend strategy allocating between the S&P 500 and cash, based on price trends. If the SPX is observed to be in a positive trend, its allocated to the SPX therwise, it is allocated to cash.”
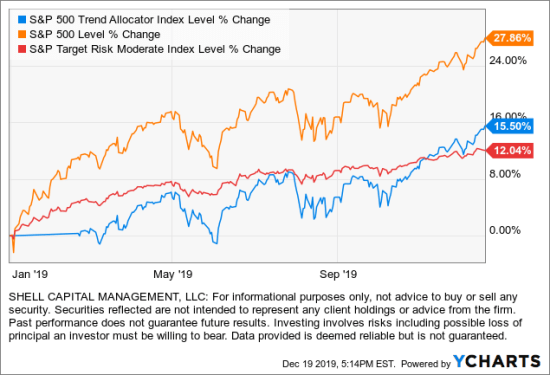
As seen in the chart, the S&P 500 recovered from the -20% loss at the end of last year and made an even higher gain. The blue line is the S&P Trend Allocation index, a trend following model applied to the S&P 500 stock index that exits when the index falls. This index cannot be invested in directly, but it shows us the results of the model. You can see it was in cash in January because of the big decline in late 2018. It finally got back in synch with the S&P 500 around March, but it “missed out” on the sharp recover over those first three months. This is the cost of active risk management with a trend following system. If you want to avoid big losses, this is the price you pay.
In the chart, I also included the S&P Target Risk Moderate Index, which is a global asset allocation of 60% stocks and 40% bonds. It was smoother in 2019, but the bonds, too, offset gains. So, for those who say “I’ll put most of my money in stocks, but not all of it” that’s about what it would have looked like. However, indexes don’t include fees and expenses.
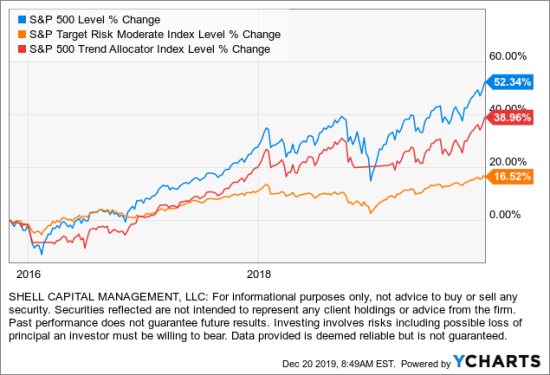
Next, I expand the time frame back to about three years to the inception of the S&P Trend Allocator index to see it’s risk-reward. Yes, it achieved less total return and its trend following strategy exits a little late, resulting in missing some of the price trend recoveries, but in a major decline it would potentially pay off.
Here is a comparison of the downside drawdowns where we can see the red line trend model missed half of the drawdown late 2018. For that peace of mind, it didn’t capture all of the 2019 recovery.
The S&P Trend Allocator index is a very simple trend-following model. Though I have similar systems, this isn’t what I do. My systems include many more parts, different parameters, and apply trend following and countertrend in an unconstrained way to a global opportunity set of markets. To me, the issue with the S&P Trend Allocator index is its symmetrical trading system; it enters and exits with the same method. Mine are an asymmetrical trading system: entering the trend one way, exiting another. I believe trends waterfall down faster than they drift up, so my strategy is more focused on those beliefs.
We’ve had a great year in 2019 in regard to risk-adjusted returns because I’ve been more focused on countertrend moves along with some trend following. I believe everyone gets what they want from the market. Most investors can’t tolerate large losses of 100% stocks all the time, so they need active risk management. If we miss those big down moves, we don’t have the asymmetry of losses working against us as we compound capital over the long-term.
If you make investment decisions based on elections and politics, you’re probably going to be surprised over and over.
If your investment strategy doesn’t account for volatility, no matter what causes it, you may be doing the wrong thing at the wrong time.
Mike Shell is the Founder and Chief Investment Officer of Shell Capital Management, LLC, and the portfolio manager of ASYMMETRY® Global Tactical.
Mike Shell and Shell Capital Management, LLC is a registered investment advisor focused on asymmetric risk-reward and absolute return strategies and provides investment advice and portfolio management only to clients with a signed and executed investment management agreement. The observations shared on this website are for general information only and should not be construed as advice to buy or sell any security. Securities reflected are not intended to represent any client holdings or any recommendations made by the firm. Any opinions expressed may change as subsequent conditions change. Do not make any investment decisions based on such information as it is subject to change. Investing involves risk, including the potential loss of principal an investor must be willing to bear. Past performance is no guarantee of future results. All information and data are deemed reliable but is not guaranteed and should be independently verified. The presence of this website on the Internet shall in no direct or indirect way raise an implication that Shell Capital Management, LLC is offering to sell or soliciting to sell advisory services to residents of any state in which the firm is not registered as an investment advisor. The views and opinions expressed in ASYMMETRY® Observations are those of the authors and do not necessarily reflect a position of Shell Capital Management, LLC. The use of this website is subject to its terms and conditions.

You must be logged in to post a comment.