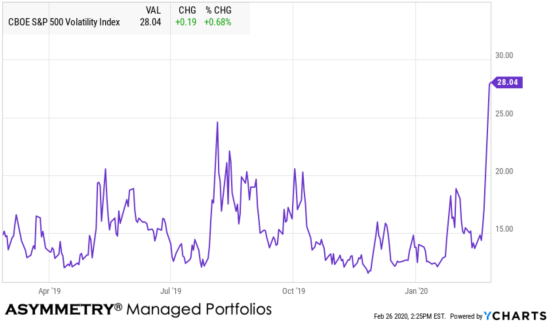
A volatility expansion implies that stock prices are expected to spread out more, as measured by the (VIX) CBOE Volatility Index. Currently, it’s at 28, which would imply a 28% expected volatility over the next 30 days, except it tends to be priced at a premium above realized vol.
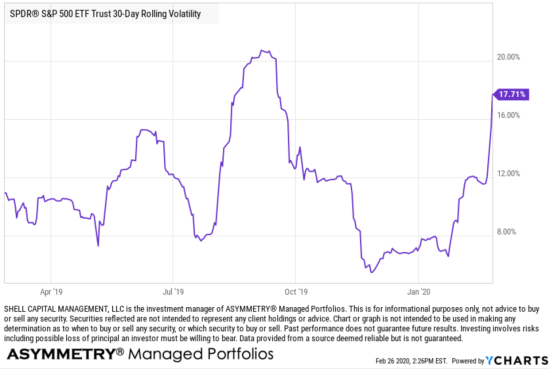
Then, historical volatility, or realized actual volatility, such as the 30-day rolling volatility, suggests prices are indeed spreading out. So, expect a wider range up AND down in volatility expansions. In the chart below, 30 Day Rolling Volatility = Standard Deviation of the last 30 percentage changes in Total Return Price * Square-root of 252. At this point, it’s at 17.71% when applied to the S&P 500 stock index data.
Here they are together, expected volatility on top of realized volatility.
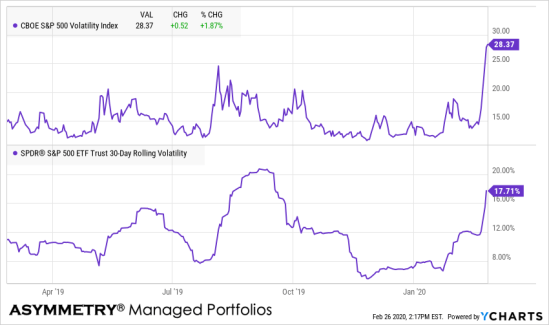
A volatility expansion like this suggests in the near term stock prices are expected to spread out more, but up and down.
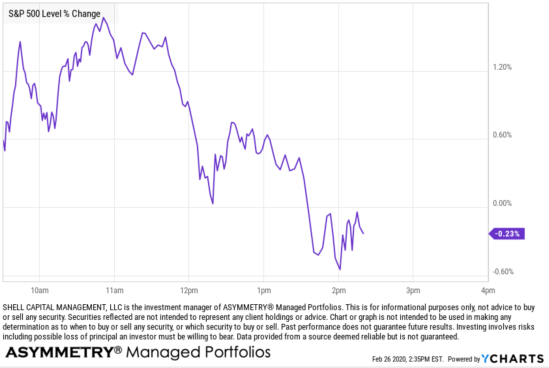
We are seeing a broad range of prices today, form up 1.4% to down -0.60%, as seen below.
So, if you are invested in the stock market, prepare yourself accordingly. Need help? Contact us here.
Mike Shell is the Founder and Chief Investment Officer of Shell Capital Management, LLC, and the portfolio manager of ASYMMETRY® Global Tactical. Mike Shell and Shell Capital Management, LLC is a registered investment advisor in Florida, Tennessee, and Texas focused on asymmetric risk-reward and absolute return strategies and provides investment advice and portfolio management only to clients with a signed and executed investment management agreement. The observations shared on this website are for general information only and should not be construed as advice to buy or sell any security. Securities reflected are not intended to represent any client holdings or any recommendations made by the firm. I observe the charts and graphs to visually see what is going on with price trends and volatility, it is not intended to be used in making any determination as to when to buy or sell any security, or which security to buy or sell. Instead, these are observations of the data as a visual representation of what is going on with the trend and its volatility for situational awareness. I do not necessarily make any buy or sell decisions based on it. Any opinions expressed may change as subsequent conditions change. Do not make any investment decisions based on such information as it is subject to change. Investing involves risk, including the potential loss of principal an investor must be willing to bear. Past performance is no guarantee of future results. All information and data are deemed reliable but is not guaranteed and should be independently verified. The presence of this website on the Internet shall in no direct or indirect way raise an implication that Shell Capital Management, LLC is offering to sell or soliciting to sell advisory services to residents of any state in which the firm is not registered as an investment advisor. The views and opinions expressed in ASYMMETRY® Observations are those of the authors and do not necessarily reflect a position of Shell Capital Management, LLC. The use of this website is subject to its terms and conditions.

You must be logged in to post a comment.