The past five days have been a little choppy in price action.
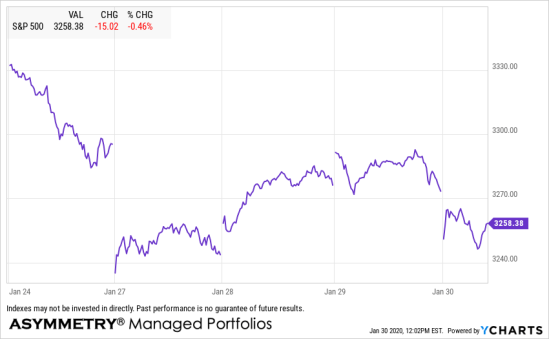
If you’ve been following my observations, it should be a surprise as a volatility expansion was expected.
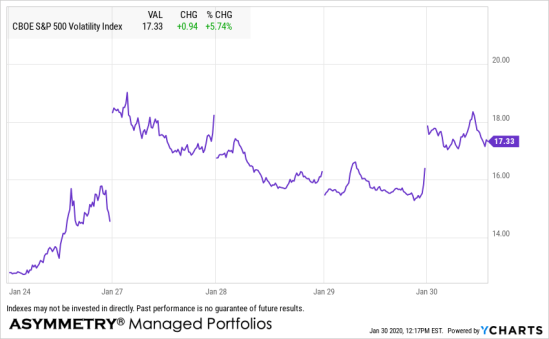
The VIX CBOE S&P 500 Volatility Index has gained 34% the past five days, so it’s a volatility expansion indeed. At the 17 level, the VIX now implies a 17% volatility in prices over the next 30 days. So, the options market traders expect more vol.
I’m no day trader, but I monitor global macro trends daily both systematically through my programs as well as manually and visually. For me, the global macro trend includes other countries and over 100 markets including volatility.
Speaking of other countries…
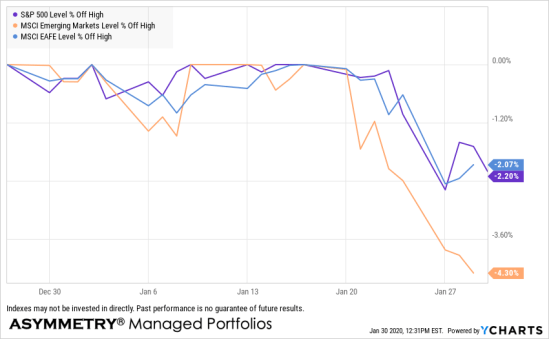
Below is the US equity index drawdown so far relative to the Emerging Markets Index and EAFE which is developed international countries. Emerging Markets EM is the laggard.
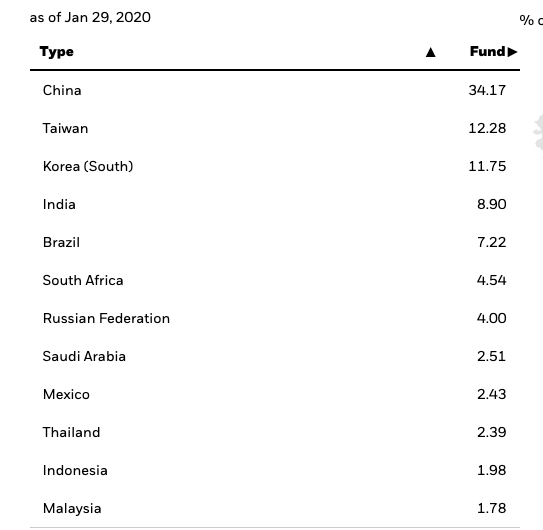
Looking deeper, here are the country holdings for EEM. China, Taiwan, South Korea, and India are the main exposures in the EM index.
Here are the price trends of China, Taiwan, South Korea, and India that are the principal exposures in the EM index.
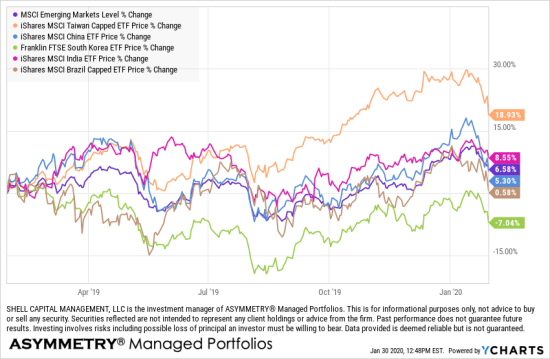
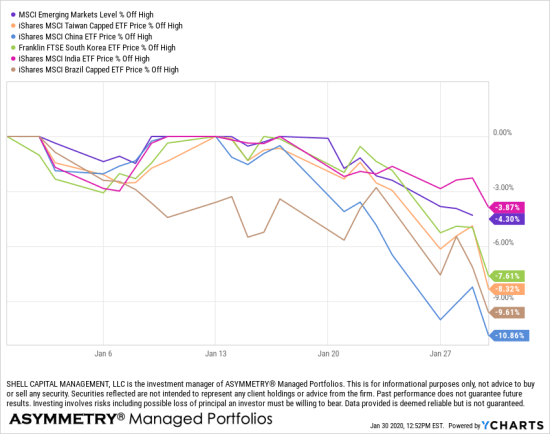
The drawdowns of these emerging markets countries have been notably greater than the US so far. China and Brazil have fallen the most. As we have been positioned in short tern U.S. Treasuries recently, We have no exposure to these markets.
I’m sure many investors believe it’s caused by the Coronavirus spreading across China and now the world. At this point, it may be driving some selling for some, but it’s really the market, doing what it does. To be clear, I’m saying the market would respond similarly regardless of the news headlines, because of the math. For some, that may sound provocative and I hope it is at least thought-provoking because I mean it.
To be sure… my assumption is testable.
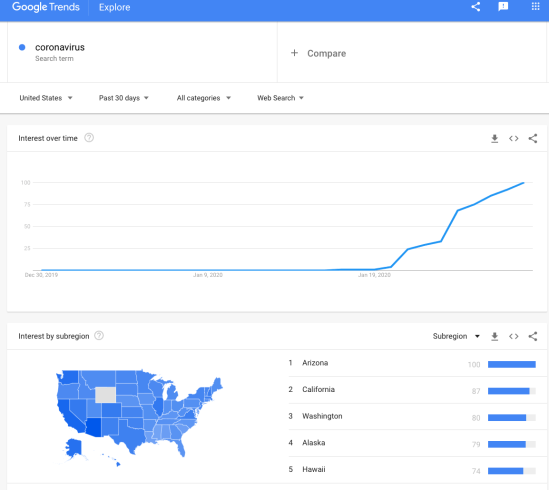
The coronavirus was first detected in Wuhan city, Central China, in December 2019. It is believed to have originated from wild animals, passing to humans due to the wildlife trade and wet markets. However, Google Trends doesn’t show any activity until January 17th and then it jumped on January 24th.
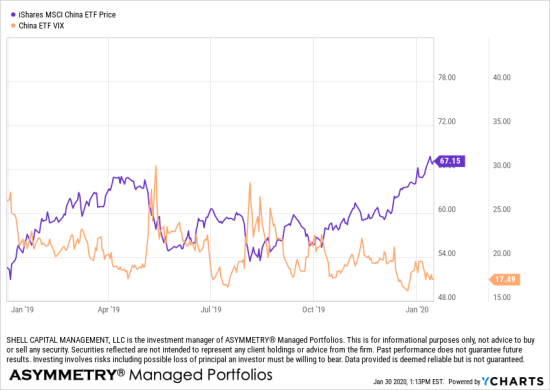
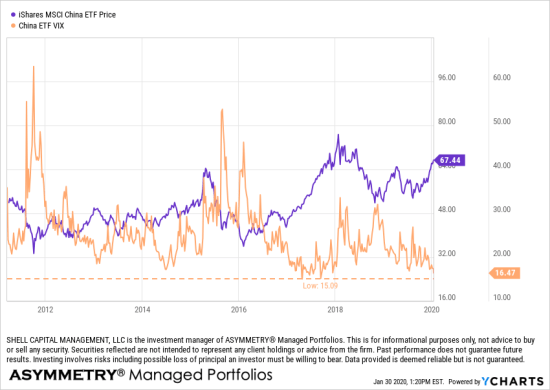
Next, I chart the price trend of the MSCI China stock index ETF along with the CBOE China ETF Volatility Index. Cboe Options Exchange (Cboe) now applies its proprietary Cboe Volatility Index® (VIX®) methodology to create indexes that reflect expected volatility for options on select exchange-traded funds (ETFs). Cboe calculates and disseminates the Cboe China ETF Volatility Index (ticker VXFXI), which reflects the implied volatility of the FXI ETF.
Here we see the price trend up to January 17th was up over the past year and the implied volatility was near its low.
And to be sure, here is the chart going back a decade and I marked the lowest point of the China ETF VIX index to show implied volatility had reached an extreme low this month prior to the coronavirus outbreak.
So, here is the price trend of the China ETF and its volatility index over the past 30 days. The low implied volatility was January 17th, so I was expecting a volatility expansion regardless of any news headlines that would suggest the blame for it. Indeed that’s what we’ve seen.
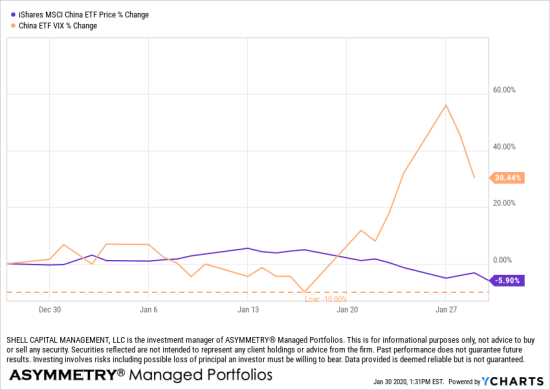
I believe the markets do what they do and some news gets the headline and the blame. Trends trend and then reverse because mathematically, they reach extreme lows and highs in their momentum making them more likely to reverse direction.
We have no way of knowing exactly why there has been enough selling pressure from investors and traders drive down China stocks, but I expected a volaltity expansion anyway, so if I had exposure to the China ETF I would have responded accordingly. I didn’t and still don’t, so this is simply for informational purposes, as always.
I believe my systems and methods are robust because I focus on the actual direction of the price trend and its volatility, and the price trend is the final arbiter. I’ve been doing what I do, over and over, for over two decades now. I’ve just gotten better at it with experience.
I don’t care so much about what news may be driving the trend, I focus on the market overreaction and underreaction and that’s observed in the price and volatility.
Mike Shell is the Founder and Chief Investment Officer of Shell Capital Management, LLC, and the portfolio manager of ASYMMETRY® Global Tactical. Mike Shell and Shell Capital Management, LLC is a registered investment advisor in Florida, Tennessee, and Texas focused on asymmetric risk-reward and absolute return strategies and provides investment advice and portfolio management only to clients with a signed and executed investment management agreement. The observations shared on this website are for general information only and should not be construed as advice to buy or sell any security. Securities reflected are not intended to represent any client holdings or any recommendations made by the firm. Any opinions expressed may change as subsequent conditions change. Do not make any investment decisions based on such information as it is subject to change. Investing involves risk, including the potential loss of principal an investor must be willing to bear. Past performance is no guarantee of future results. All information and data are deemed reliable but is not guaranteed and should be independently verified. The presence of this website on the Internet shall in no direct or indirect way raise an implication that Shell Capital Management, LLC is offering to sell or soliciting to sell advisory services to residents of any state in which the firm is not registered as an investment advisor. The views and opinions expressed in ASYMMETRY® Observations are those of the authors and do not necessarily reflect a position of Shell Capital Management, LLC. The use of this website is subject to its terms and conditions.

You must be logged in to post a comment.