Investor sentiment measures may be used as contrarian indicators. We expect the market to do the opposite of what the indicators are saying when they reach an extreme level of bullish/greed/optimism or bearish/fear/pessimism. Identifying extreme levels of positive or negative sentiment may give us an indicator of the direction the stock market is likely to trend next.
I observe when sentiment reaches overly optimistic levels like it did late 2017 into January 2018, the stock market trend trends down or at least sideways afterward. In reverse, after investor sentiment becomes extremely pessimistic, the stock market tends to trend back up.
Although extreme investor sentiment may be used as a contrarian indicator, I do not base my investment or tactical trading decisions on it by itself. I use investor sentiment measures and indicators to indicate and confirm my other signals of a potential trend change. For example, when bullish investor sentiment is rising from a lower level but not yet reached an extreme high, it’s just confirming trend following. However, when bullish sentiment reaches an extreme it warns me to be prepared for a potential countertrend. All those who want to buy may have bought, so buying enthusiasm may be exhausted. That’s what I observed in January 2018. After prices fall investor sentiment shifts to bearish and they fear more loss. Once the level of fear reaches an extreme it begins to suggest those who want to sell have sold and we could see selling become exhausted and a selling climax.
We have two types of investor sentiment measures: Polls and indicators.
Investor sentiment polls actually survey investors to ask them what they believe about the market. The AAII Investor Sentiment Survey has become a widely followed measure of the mood of individual investors. Since 1987, AAII members have been answering the same simple question each week:
“Do you feel the direction of the market over the next six months will be up (bullish), no change (neutral) or down (bearish)?”
The results are then consolidated into the AAII Investor Sentiment Survey, which offers us some insight into the mood of individual investors.
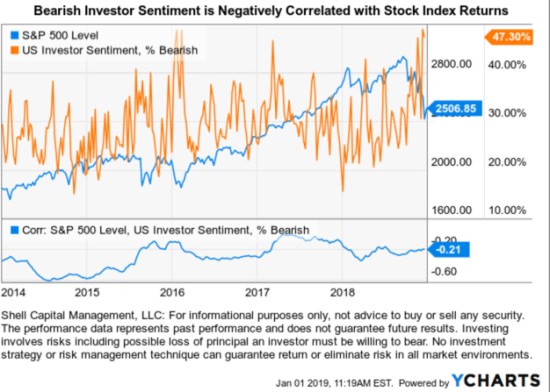
Bearish investor sentiment is negatively correlated with stock market index returns. Below I created a chart of the S&P 500 stock index with an overlay of the % bearish investor sentiment. On the bottom, I added the correlation between the S&P 500 and the % bearish investor sentiment. We can visually see there is a negative correlation between investors getting more bearish as stock prices fall. For example, few investors were bearish in 2014 into 2015 until the stock index fell -12% in August 2015, then the % of bearish investors spiked up. We also saw the % of bearish investors extremely low in January 2018 as the stock index reached an all-time high. After the stock index declined -20% at the end of 2018 we saw the % of bearish investors spike up again. As we enter 2019, the % of bearish investors is at a historical extreme high level so we may be observing a selling climax as the desire to sell gets exhausted.
Bullish investor sentiment is positively correlated with stock index returns, except after stock prices fall, then investors lose their optimism. In the chart below, we see the % of bullish investors trending up along with stocks 2014 into 2015, but then as prices fell late 2015 into 2016 they lose their optimism for stocks. We saw another spike to an extreme level of bullishness late 2017 into 2018 as the stock index reached all-time highs. The % of bullish investors declined with great momentum after prices fell sharply. As we enter 2019, the % of bullish investors is very low, leaving much room for the desire to buy to take over.

Investor sentiment surveys like AAII are useful tools to get an idea of extreme sentiment levels when selling pressure or buying enthusiasm may be becoming exhausted. However, their potential weakness is they are ultimately just polls asking people what they believe, not what they are actually doing. Regardless, they do seem to have enough accuracy to be used as a guide to confirm other indicators.
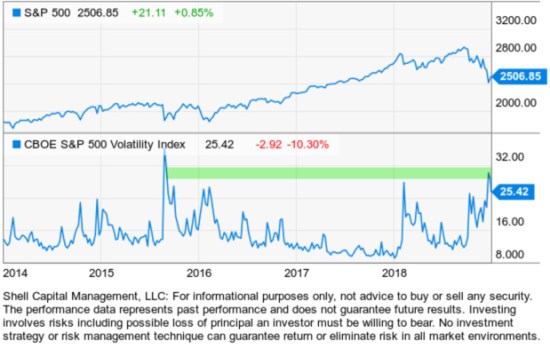
As I’ve observed extreme levels of investor sentiment and participation in the 2018 downtrend in global markets, I’ve shared these indicators several times. As we saw in the investor sentiment survey, the VIX spiked in 2015, then spiked again but to a lower high in 2016 as the stock index fell. The VIX spiked again in February 2018 as the S&P 500 quickly declined -10%. After prices trended back up implied volatility contracted all the way to the low level of 12. The stock index started to decline again, so the VIX once again indicated a volatility expansion. As we enter 2019, the CBOE S&P 500 Volatility Index VIX is at 25.42, just over its long-term average of 20. The VIX implies an expected volatility range of 25% over the next 30 days.
I’ve shared several observations the past few months of the Put/Call Ratio. The Put/Call Ratio is a range bound indicator that swings above and below 1, so reveals a shifting preference between put volume to call volume. When the level is high, it indicates high put volume. Since puts are used for hedging or bearish trades, I consider it a contrary indicator at extremely high levels.
The Equity Put/Call Ratio measures the put and call volume on equities, leaving out indexes. The Equity Put/Call Ratio spiked to a high level of put volume when it reached 1.13 on December 21, 2018, as the stock index was declining. The high Equity Put/Call indicated options trading volume was much higher for protective puts than call volume. The Equity Put/Call Ratio is considered to be mostly non-professional traders who tend to be more bullish, so it keeps call volume relatively high and the ratio low. Its high level has so far turned out to be a reliable short-term indicator of a short-term low in stocks. As we enter 2019, the Equity Put/Call Ratio is at .60, which is at a normal range. We normally see more call volume than put volume in the Equity Put/Call Ratio, so the ratio is its normal level as you can see in the chart.

The CBOE Index Put/Call Ratio is applied to index options without equity options. We believe professional traders and portfolio managers mostly use index options for hedging or directional positions. The total volume of the Index Put/Call Ratio is asymmetric toward puts for hedging purposes. As we can observe in the chart below, the current level at the beginning of 2019 is 1.09 dropping about 35% from it’s December peak at 1.67.
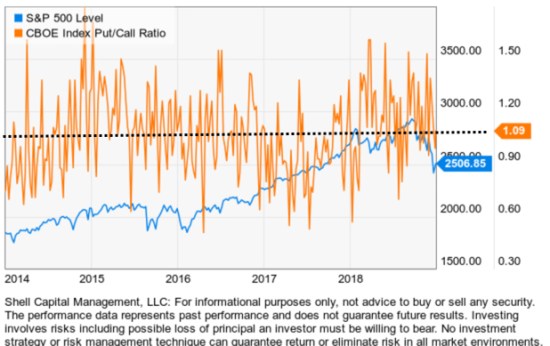
We can visually see the tendency in Index Put/Call is around 1 as the Equity Put/Call Ratio is around 0.60. Equity Put/Call Ratio has a more optimistic/bullish tendency as individual stock options are used more for bullish bets as index options are used more as for hedging.
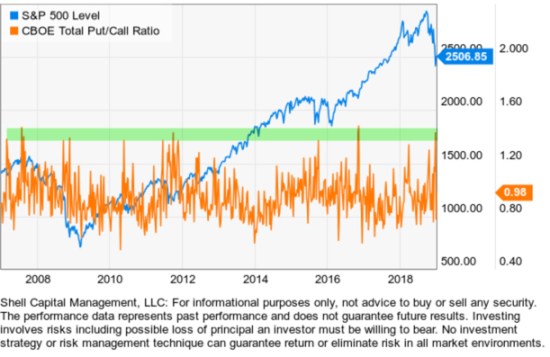
The CBOE Total Put/Call Ratio combines both equity and index options to create a range bound oscillator that swings above and below 1. With the Total Put/Call Ratio, I believe the put bias in index options is offset by the call bias in equity options. The Total Put/Call Ratio spiked to its highest ever reading of 1.82 on December 20, 2018, as the stock index was entering the -20% “bear market” level. I consider a level above 1.20 to be bullish as it indicates an extreme in put volume over call volume. A reading below 0.70 is more bearish since there is an asymmetry between call volume over put volume. Above 1.20 is an elevated put trading volume. As a bet that stock prices will fall or hedge against them, buying put options is a bearish sentiment. Of course, some of the volume could have been traders selling puts which are a very speculative bullish bet, but since I pointed it out the stock indexes reversed up sharply, so I believe it turned out to be a reliable short-term indicator of a short-term low in stocks. As we enter 2019, the Total Put/Call Ratio is at .98 which is still high. We usually see more call volume than put volume, so the ratio is typically well below 1 as you can see in the chart.
There is no better indicator of a shift in investor sentiment than price action. No one believes that any more than me. The direction of the price trend is the final arbiter, and I’ve believed it over two decades. Any indicator that is a derivative of price or non-price trend economic data has the potential to stray far from the reality of the price trend. The price trend determines the value and the outcome of a position. As we enter 2019, the S&P 500 stock index has declined -20% off it’s September high and after a sharp reversal up since December 24th, it’s currently in a short-term downtrend, but at a level, the countertrend back up may continue.

Even if you don’t observe investor sentiment measures as an indicator or trade signal, it’s still useful to observe the extremes to help avoid becoming overly bullish or overly bearish and part of the herd. The herd tends to be wrong at extremes, and most investors tend to do the wrong thing at the wrong time. If I am to create better results, I must necessarily do the opposite of most investors.
As a tactical investment manager, I identify changes in price trends, inter-market relationships, investor sentiment, and market conditions aiming for better risk-adjusted returns. My objective is asymmetric investment returns, so I necessarily focus on asymmetric risk/reward positions, and that includes focusing on asymmetries between bullish and bearish investor sentiment.
Mike Shell is the Founder and Chief Investment Officer of Shell Capital Management, LLC, and the portfolio manager of ASYMMETRY® Global Tactical.
The observations shared on this website are for general information only and are not specific advice, research, or buy or sell recommendations for any individual. Investing involves risk including the potential loss of principal an investor must be willing to bear. Past performance is no guarantee of future results. The presence of this website on the Internet shall in no direct or indirect way raise an implication that Shell Capital Management, LLC is offering to sell or soliciting to sell advisory services to residents of any state in which the firm is not registered as an investment advisor. Use of this website is subject to its terms and conditions.

Pingback: Stock Market Update « ASYMMETRY® Observations