“I still had much to learn, but I knew what to do. No more floundering, no more half-right methods. Tape reading was an important part of the game; so was beginning at the right time; so was sticking to your position. But my greatest discovery was that a man must study general conditions, to size them so as to be able to anticipate probabilities.” – Jesse Livermore, Reminiscences of a Stock Operator, by Edwin Lefèvre, first published in 1923.
The US stock market is now at risk of another decline
First, the relative strength of the S&P 500 has reached a level I consider overbought for the first time since the crash.
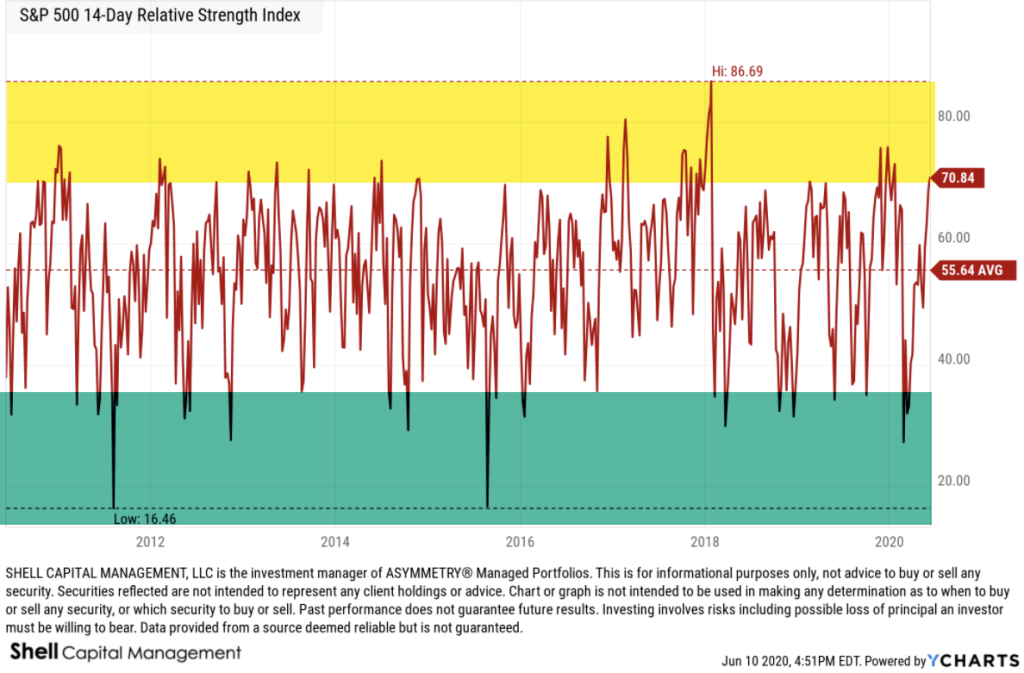
It’s a measure of too far, too fast.
The Relative Strength Index (RSI), developed by J. Welles Wilder. Born in Noris, Tennessee, Wilder was a mechanical engineer, turned real estate developer, turned technical analyst, and best known for his work in technical analysis. Wilder created the Average True Range, the Relative Strength Index (RSI), Average Directional Index, and the Parabolic SAR, which he published in 1978 in New Concepts in Technical Trading Systems.
is a momentum oscillator that measures the speed and magnitude of directional price trends. The RSI oscillates between zero and 100, so it is range bound.I The RSI is defined as overbought when it reaches 70 or higher and oversold below 30.
Another useful measure of market trend conditions is breath. The percent of S&P 500 stocks above their 50 day moving average shows us how many stocks are participating in the uptrend. Since June 1st, 97% of the stock are trending above their 50 day moving average, so they are in short term uptrends.
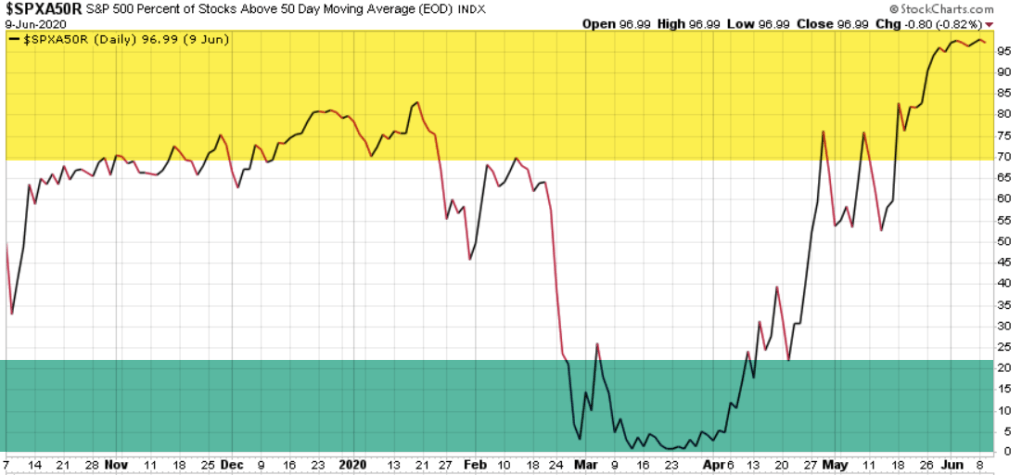
Strong breadth of participation is a good thing, until it reaches an extreme. A breath thrust as we saw begin the start in April was a good sign as the stock market was trending up, more and more stocks were entering uptrends. However, once all of the stocks are already in uptrends, we eventually have to wonder what is going to keep driving them higher.
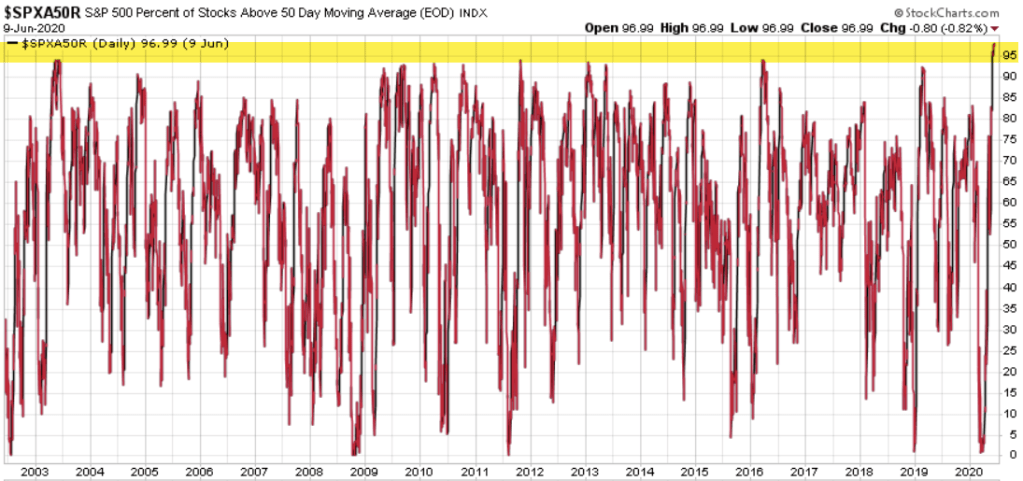
Much of investment management is an understanding of what other market participants are likely to do next. When I see the percent of SPX stocks above their 50 day moving average at the highest level in twenty years, it simply tells us most of the stocks are in short term uptrends, but, the next direction for buying enthusiasm is going to be down.
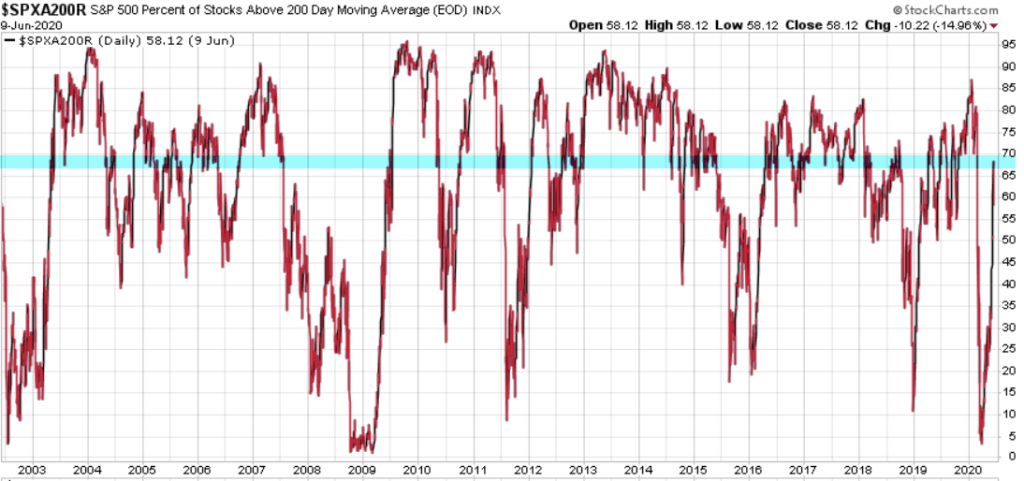
On a longer term time frame, which is the 200 day moving average, only about 60% of the S&P 500 stocks are in longer term uptrends, so there is plenty of room for continuation.
Next up is the good ole NYSE Bullish Percent.
The NYSE Bullish Percent was the first breadth indicator. The NYSE Bullish Percent was developed by Abe Cohen, the founder of Investors Intelligence in 1955. Abe Cohen was an early pioneer of point & figure charting , which he believed provided the ideal building blocks for a market barometer. By recording stock prices, P&F charts effectively map out the relationship between demand (buyers) and supply (sellers). The advantage of P&F charts is the supply/demand asymmetries are clear cut and easy to identify:
If demand outstrips supply, a P&F buy signal is generated
If supply outstrips demand a P&F sell signal is generated.
The Bullish Percent, then, is a breadth indicator that shows the percentage of stocks on Point & Figure Buy Signals. As with other oscillators, the Bullish Percent Index is range bound and fluctuates between 0% and 100%. In its most basic form, the Bullish Percent Index favors the bulls when above 50% and the bears when below 50%. Bullish Percent is considered overbought and a higher risk zone when above 70% and oversold and a lower risk level when below 30%.
At the current reading of 83, it’s clearly in the “high risk” zone.
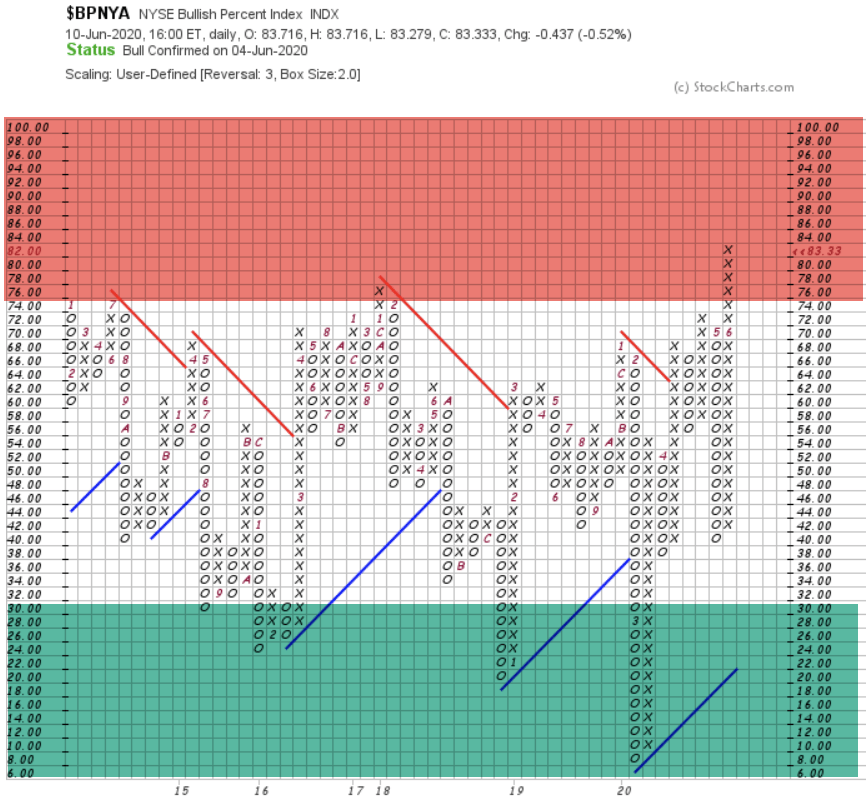
So, I wouldn’t be surprised to see this uptrend at least stall here, temporarily.
If we’re going to see a second leg down, this is where I believe it will start.
The Federal Reserve is fully committed to keeping this trend going, so we’ll see…
Risk management is essential for all investments because all investments have a risk of loss.
As a tactical decision to reduce our exposure to loss in response to the elevated risk levels I’m seeing, I sold to take profits on our remaining stock positions on Tuesday and invested in US Treasuries.
“But my greatest discovery was that a man must study general conditions, to size them so as to be able to anticipate probabilities. ”
– Jesse Livermore, Reminiscences of a Stock Operator, by Edwin Lefèvre, first published in 1923.
Mike Shell is the Founder and Chief Investment Officer of Shell Capital Management, LLC, and the portfolio manager of ASYMMETRY® Global Tactical. Mike Shell and Shell Capital Management, LLC is a registered investment advisor focused on asymmetric risk-reward and absolute return strategies and provides investment advice and portfolio management only to clients with a signed and executed investment management agreement. The observations shared on this website are for general information only and should not be construed as advice to buy or sell any security. Securities reflected are not intended to represent any client holdings or any recommendations made by the firm. Any opinions expressed may change as subsequent conditions change. Do not make any investment decisions based on such information as it is subject to change. Investing involves risk, including the potential loss of principal an investor must be willing to bear. Past performance is no guarantee of future results. All information and data are deemed reliable but is not guaranteed and should be independently verified. The presence of this website on the Internet shall in no direct or indirect way raise an implication that Shell Capital Management, LLC is offering to sell or soliciting to sell advisory services to residents of any state in which the firm is not registered as an investment advisor. The views and opinions expressed in ASYMMETRY® Observations are those of the authors and do not necessarily reflect a position of Shell Capital Management, LLC. The use of this website is subject to its terms and conditions.

You must be logged in to post a comment.