On November 15, 2019, I published “Periods of low volatility are often followed by volatility expansions” and included the below chart.
The point is just as the title said, when stock prices trend up quietly, they are eventually interrupted by the loud bang of falling prices.

In this case, it took a few months to see it play out.
Below, I updated the chart so it still has the same starting date, but shows us what happened after I posted it. The 11/15/19 day is labeled on the chart. It had a small decline shortly after, but then resumed the uptrend.
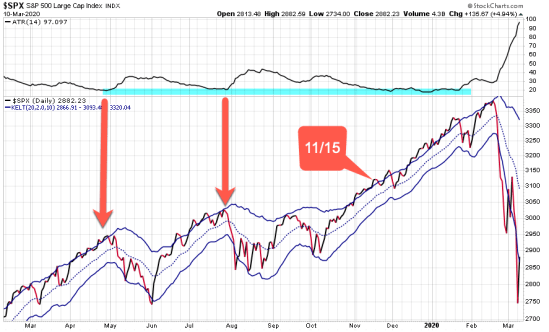
In fact, the stock index went on to gain 9% from that point and was interrupted by only two small countertrend declines of 3-4%.
That is, until February 19th.
Since the peak, the stock index has declined -19% and volatility has exploded.
The volatility measure I used in the chart is an average of the true range, which accounts for a full price range of the period. The average true range is also what I used to draw the channels above and below the price trend to define “normal” price action.
The average true range of the price trend has increased by 420% since December, from 17 to 97. I know it shocked most people in the market and while I didn’t expect a -19% waterfall in just three weeks, I expected a volatility expansion and mean reversion. As I exited stocks a little early, we see now it didn’t matter this time as the stock market has given up far more upside than we missed out on over those few weeks.
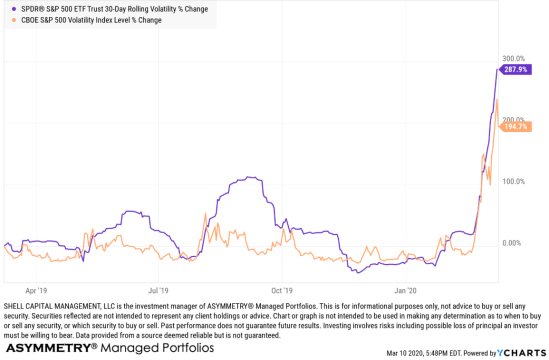
Next, let’s look at a chart of implied volatility as indicated by the VIX based on how the market is pricing options. Implied vol spiked over 200%. I also included the 30-Day rolling volatility of the S&P 500 ETF. Implied volatility lead realized, historical, volatility to the upside.
So, the condition of the US stock market is volatile one as prices and swinging up and down, and only December 2008 in the middle of the Financial Crisis was it higher.
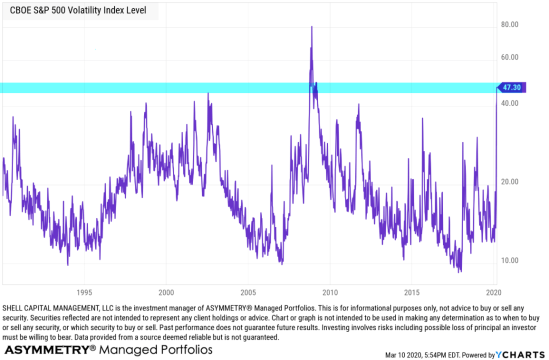
If the VIX is a fear gauge, it’s signaling a lot of fear.
Again, “Periods of low volatility are often followed by volatility expansions” and that’s what we got. This time it got stretched on the upside so far it has snapped back to very quickly and violently correct it.
The good news is, the opposite is also true; periods of high volaltity are eventually followed by volatility contractions.
But, just as before, as it took time for the volatility contraction to become a volatility expansion, we’ll probably see a continuation of price swings and elevated volatility for a while.
Eventually, this too shall pass.
Mike Shell is the Founder and Chief Investment Officer of Shell Capital Management, LLC, and the portfolio manager of ASYMMETRY® Global Tactical. Mike Shell and Shell Capital Management, LLC is a registered investment advisor in Florida, Tennessee, and Texas. Shell Capital is focused on asymmetric risk-reward and absolute return strategies and provides investment advice and portfolio management only to clients with a signed and executed investment management agreement. The observations shared on this website are for general information only and should not be construed as advice to buy or sell any security. Securities reflected are not intended to represent any client holdings or any recommendations made by the firm. I observe the charts and graphs to visually see what is going on with price trends and volatility, it is not intended to be used in making any determination as to when to buy or sell any security, or which security to buy or sell. Instead, these are observations of the data as a visual representation of what is going on with the trend and its volatility for situational awareness. I do not necessarily make any buy or sell decisions based on it. Any opinions expressed may change as subsequent conditions change. Do not make any investment decisions based on such information as it is subject to change. Investing involves risk, including the potential loss of principal an investor must be willing to bear. Past performance is no guarantee of future results. All information and data are deemed reliable but is not guaranteed and should be independently verified. The presence of this website on the Internet shall in no direct or indirect way raise an implication that Shell Capital Management, LLC is offering to sell or soliciting to sell advisory services to residents of any state in which the firm is not registered as an investment advisor. The views and opinions expressed in ASYMMETRY® Observations are those of the authors and do not necessarily reflect a position of Shell Capital Management, LLC. The use of this website is subject to its terms and conditions.

You must be logged in to post a comment.