I like uptrends, until the end when they bend.
This uptrend in U.S. stocks hasn’t seemed ready to bend, but we are observing signs a reversal down could be soon. I’m not necessarily talking about a market crash of -50%, but instead a decline of around -5% or so that we typically see a few times a year as we’ve seen twice this year.
The “long term” investors may wonder why it matters?
All big waterfall declines begin with smaller downtrends. Few stay “long term” investors after large declines. After -30% declines or more, most anyone’s financial plans become negatively impacted. It’s especially true since we don’t know how long it will take to recover and there is no guarantee it will.
So, as a tactical risk manager, I necessarily prepare and apply situational awareness. If we want to manage our drawdowns, we want to do it sooner than later. Everyone is always giddy at all-time highs, then regretful if they don’t derisk or hedge after a downtrend.
Below is an example of a measure of realized volatility charted with the stock index. The top line is the 20-day average true range of the S&P 500 (SPX) and the lower is its price trend. I marked it up to show the average true range indicates a volaltity contraction like we’ve seen twice this year. The point is it preceded a volatility expansion and price declines. I also added the blue bands around the price trend that reflect two times the average true range of the price trend. When the price trend moves outside this volatility band, I consider it simply outside its recently normal range. As you can see, it can stay outside its range for a while, but the price trend mostly oscillates inside this range. When it swings outside the range, it means reverts or swings the other way.

We can say the same for expected volatility, as measured by the CBOE Volatility Index, which measures implied volatility on the S&P 500 stocks. The VIX has declined to the 12 level, the low level of its historical range.
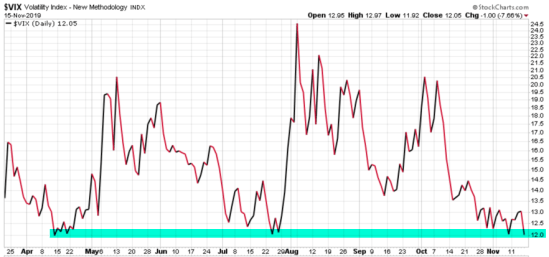
Periods of low volatility are often followed by volatility expansions.
The SPX trend can trend higher, and volaltity can drift lower, but in the short run, it’s a good time to check thy risk.
Investment management is all about probabilities and possibilities, so you can probably see the direction is most probable, though anything is possible.
Why does any of this matter? read Why we row, not sail.
For an update, see A volatility expansion seems imminent
Mike Shell is the Founder and Chief Investment Officer of Shell Capital Management, LLC, and the portfolio manager of ASYMMETRY® Global Tactical.
Mike Shell and Shell Capital Management, LLC is a registered investment advisor focused on asymmetric risk-reward and absolute return strategies and provides investment advice and portfolio management only to clients with a signed and executed investment management agreement. The observations shared on this website are for general information only and should not be construed as advice to buy or sell any security. Securities reflected are not intended to represent any client holdings or any recommendations made by the firm. Any opinions expressed may change as subsequent conditions change. Do not make any investment decisions based on such information as it is subject to change. Investing involves risk, including the potential loss of principal an investor must be willing to bear. Past performance is no guarantee of future results. All information and data are deemed reliable but is not guaranteed and should be independently verified. The presence of this website on the Internet shall in no direct or indirect way raise an implication that Shell Capital Management, LLC is offering to sell or soliciting to sell advisory services to residents of any state in which the firm is not registered as an investment advisor. The use of this website is subject to its terms and conditions.

You must be logged in to post a comment.