On February 6th, I shared and observation in “19 is the new 20, but is this a new low volatility regime?” the lower level of implied (expected) volatility at the time may be driven by two factors that may have been resulting in less concern for volatility. I wrote:
The current bull market that started in March 2009 is the longest bull market in history. It exceeded the bull market of the 1990s that lasted 113 months in terms of time, though still not as much gain as the 90s.
The U.S. is in its longest economic expansion in history, breaking the record of 120 months of economic growth from March 1991 to March 2001, according to the National Bureau of Economic Research. However, this record-setting run observed GDP growth far slower than previous expansions.
The aged bull market and economic expansion can naturally lead to some level of complacency and expectation for less downside and tighter price trends. When investors are uncertain, their indecision shows up in a wide range of prices. When investors are smugger and confident, they are less indecisive and it’s usually after a smooth uptrend they expect to continue.
Well, so much for that.
Here we are, the bull market was interrupted by a -37% in the Dow Jones. So, any higher highs from here will be labeled a new bull market.

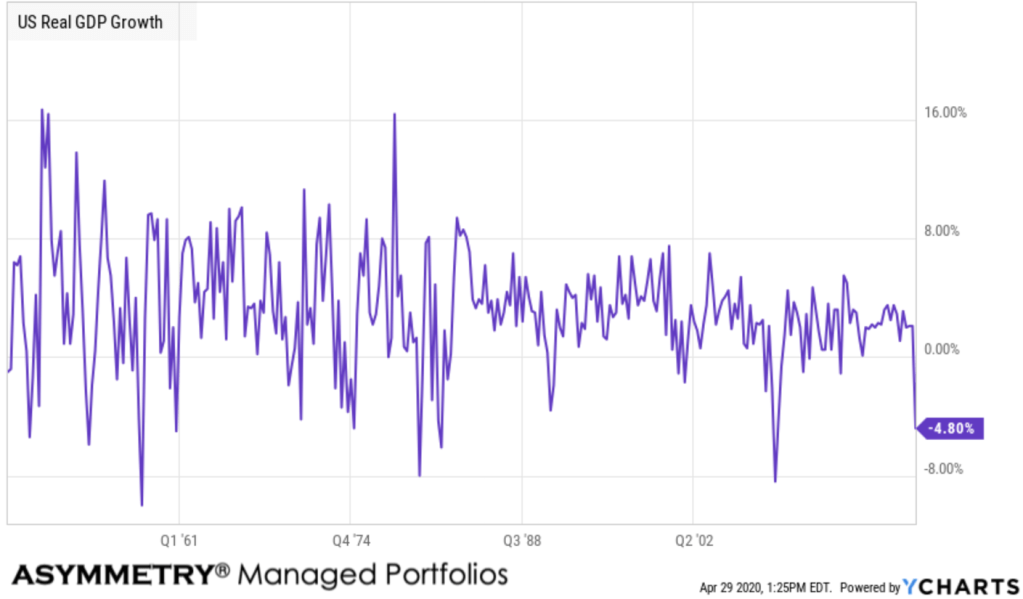
The US is now in a recession. The longest economic expansion is over, interrupted by a -4.8% GDP, as discussed in “The longest economic expansion in U.S. history is over, but…”
What about volatlity?
I shared several observations of volatility and
Back in December, I wrote “A volatility expansion seems imminent” which was a follow up to November 16th, “Periods of low volatility are often followed by volatility expansions”.
Don’t say I didn’t tell so, in advance.
I also wrote:
Is the volatility expansion over? in December.
On January 27th, published “Here comes the volatility expansion, but is the coronavirus outbreak in China to blame?”
January 30th “Global Macro: is the coronavirus outbreak crushing the China ETF and causing the volatility expansion?”
February 26th was “What volatility expansions tell us about expectations for stock market trends”
March 3rd was pretty clear “Expect wider price swings in a volatility expansion”
Then, on March 10th I wrote again about the volatility expansion “
Why I’m not surprised to see such a volatility expansion”
This chart was featured in the Wall Street Journal by one of the few outside research I read; The Daily Shot.

Oh yes, did that chart reverse trend as expected.
Now there’s this. The CBOE Volatility Index (VIX) spiked to 82, the highest level of implied vol on record.
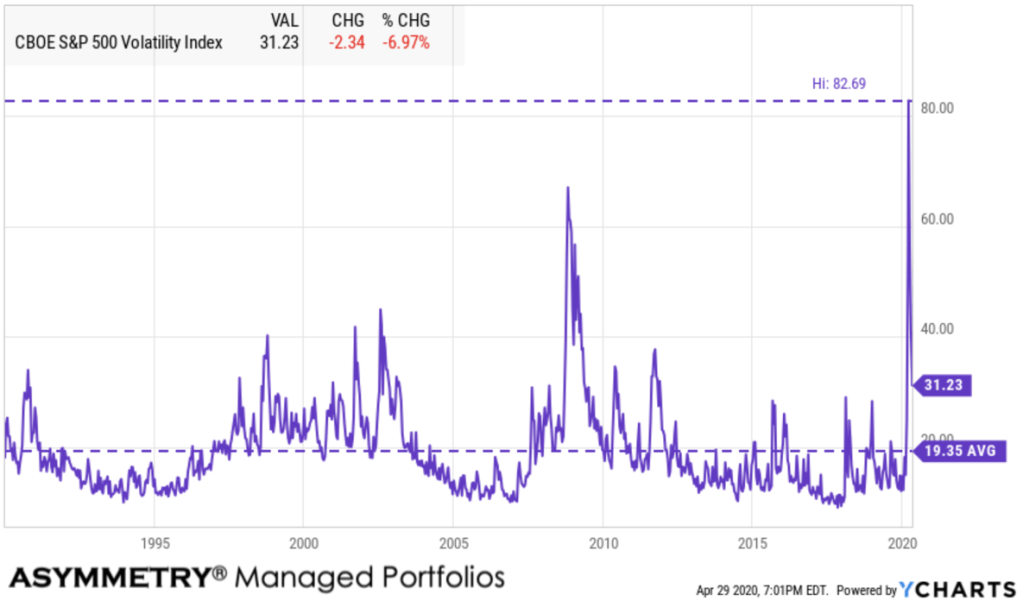
But since then, it is gradually trending down.
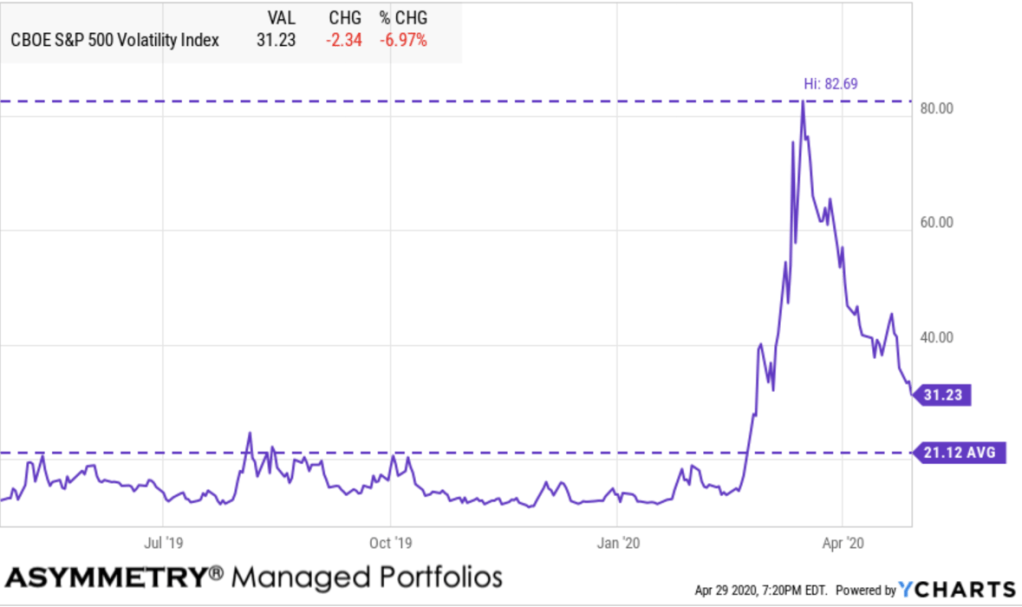
The options market is pricing in less expected volatility for the S&P 500 stocks over the next 30 days.
It’s a volatility contraction.
Will it continue?
It will as long as expected vol keeps declining. I know; captain obvious.
VIX is trending down, but it’s still at 31, and still a wider than average range of prices spreading out.
If we see a reversal down in stocks, then we’ll see volatility spike again. But for now, it’s a volatility contraction, so I’ll take it.
The Fear & Greed Index is only dialed half way up.
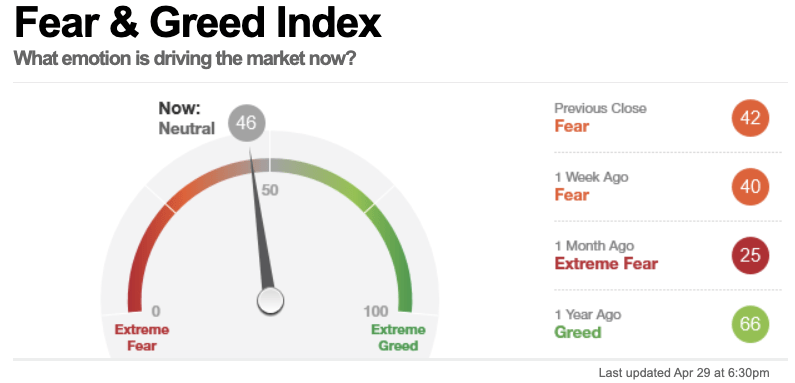

Only two of the Fear & Greed Index indicators are showing greed. Safe haven demand is the biggest, which is the difference between the 20-day stock and bond returns. Stocks have outperformed bonds by 16.29% the last 20 trading days. This is close to the strongest performance for stocks relative to bonds in the past two years and suggests investors are rotating into stocks from the relative safety of bonds.

The other is the Put/Call Ratio. During the last five trading days, volume in put options has lagged volume in call options by 44.87% as investors make bullish bets in their portfolios. However, this among the lowest levels of put buying seen during the last two years, indicating greed on the part of investors.

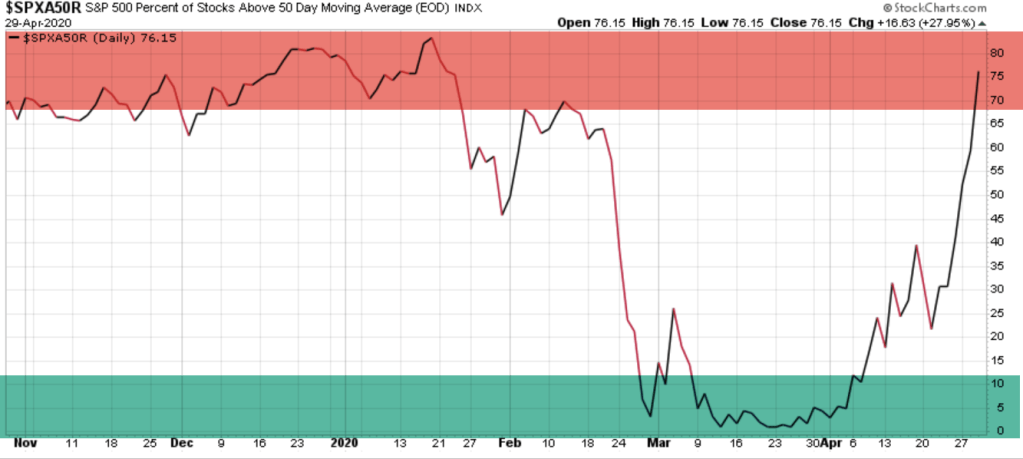
By my measures, the stock market is just now entering the overbought range, technically, on a short term basis.
For example, the percent of S&P 500 stocks above their 50 day moving average is now up to 74% after todays close. It’s the higher risk zone.
As a testiment to the internal damage done, I present the percent of S&P 500 stocks above their 200 day moving average, which is only at 30%. It tells us most stocks are still in a longer term downtrend after reaching a low of only 3% of stocks above their trend line on March 20th.
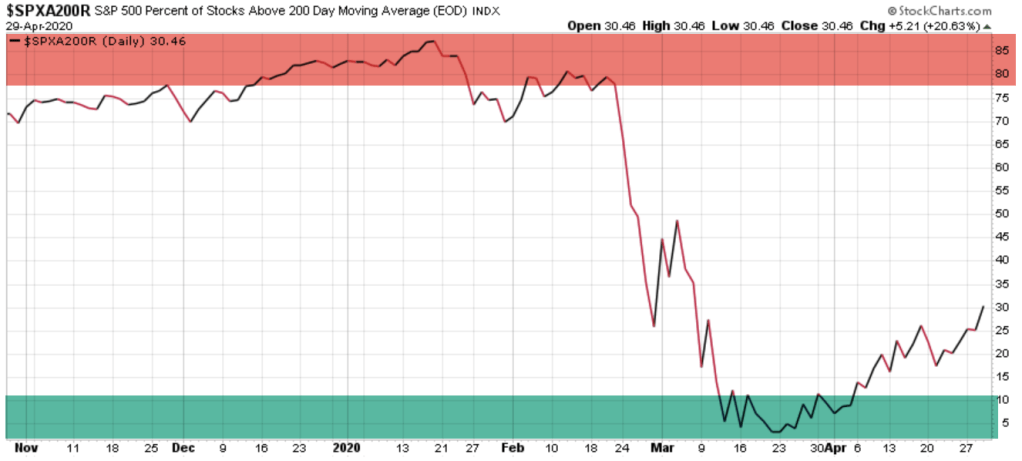
And yes, it was very near the March 23rd low only three days later.
Most stocks are participating in the uptrend, as measured by 70% of them above their average of the past 50 days.
Volatiltiy is contracting.
Investor sentiment is gradually shifting. Nothing drives sentiment like the price trend. The price trend is the leading indicator, investors enthusiasm follows it.
All while we just saw the largest drop in economic growth since 2008.
Mike Shell is the Founder and Chief Investment Officer of Shell Capital Management, LLC, and the portfolio manager of ASYMMETRY® Global Tactical. Mike Shell and Shell Capital Management, LLC is a registered investment advisor focused on asymmetric risk-reward and absolute return strategies and provides investment advice and portfolio management only to clients with a signed and executed investment management agreement. The observations shared on this website are for general information only and should not be construed as advice to buy or sell any security. Securities reflected are not intended to represent any client holdings or any recommendations made by the firm. Any opinions expressed may change as subsequent conditions change. Do not make any investment decisions based on such information as it is subject to change. Investing involves risk, including the potential loss of principal an investor must be willing to bear. Past performance is no guarantee of future results. All information and data are deemed reliable but is not guaranteed and should be independently verified. The presence of this website on the Internet shall in no direct or indirect way raise an implication that Shell Capital Management, LLC is offering to sell or soliciting to sell advisory services to residents of any state in which the firm is not registered as an investment advisor. The views and opinions expressed in ASYMMETRY® Observations are those of the authors and do not necessarily reflect a position of Shell Capital Management, LLC. The use of this website is subject to its terms and conditions.

You must be logged in to post a comment.