To no surprise, we are observing a volatility expansion.
I say it isn’t a surprise, because I shared my observation on July 28th in Is volatility setting up for an expansion? the following:
I’m not going to be surprised if we see a VIX volatility expansion this week along with the range of stock prices spreading out.
There are plenty of potential catalysts that could drive volatility and uncertainty higher for those who need a story driving it.
This morning, the CBOE Volatility Index® (VIX® Index®) is trending 20% to 21.20, which is its long term historical average. As I pointed out before, it was at 12 when I pointed out the possibility of a volatility expansion. I didn’t expect to see it just because it was at a low level of 12, but instead because there was no shortage of potential catalyst that could cause prices to spread out into a wide range from indecision.

The CBOE Volatility Index® (VIX® Index®) is a key measure of market expectations of near-term volatility conveyed by S&P 500 stock index option prices. Since its introduction in 1993, theVIX®Index has been considered by many to be the world’s premier barometer of investor sentiment and market volatility.
The VIX has gained 76% since I shared the observation.

Is there a way to trade this volatility? Yes, there is, and it’s easier said than done. Tactical traders can trade VIX options, futures, ETFs, or the ETN. I share the below chart for informational purposes only. It’s the iPath® Series B S&P 500® VIX Short-Term FuturesTMETN charted along with the VIX index and does not necessarily represent any position I have taken. As you can see, it has gained 27% over the past week as the VIX gained 76%, but past performance is not necessarily indicative of future results. In fact, trading the VXX is very tricky and timing is everything.

A deep dive into VXX and long volatility ETFs is beyond the scope of my mission here as I just want to show a simple example of “long volatility” for asymmetric hedging. The succinct reason the VXX didn’t track the VIX index perfectly is because he Index offers exposure to a daily rolling long position in the first and second month VIX futures contracts and reflects market participants’ views of the future direction of the VIX index at the time of expiration of the VIX futures contracts comprising the Index. Owning the ETNs is not the same as owning interests in the index components included in the Index or a security directly linked to the performance of the Index. For additional information including the risks associated with VXX and ETNs, please see the VXX prospectus. The bottom line is, to successfully trade the VXX is beyond simply trading its price trend, it also requires understanding its roll yield issues and the VIX term structure.
While CBOE Volatility Index® (VIX® Index®) is a measure of market expectations of near-term volatility conveyed by S&P 500 stock index option prices, I use other measures to observe actual, realized, historical volatility.
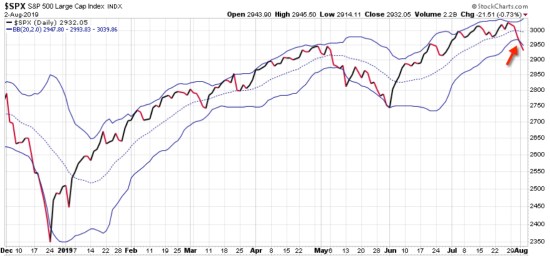
Below is the S&P 500 stock index with bands of standard deviation. As you can see, the red arrow shows the price has spread out below the lower volatility band. These volatility bands normally contain the range of price, until it doesn’t. In this case, the volaltity is measured by the standard deviation, so this is a simple observation of the standard deviation shortfall. A price trend can and does trend beyond its normal range.
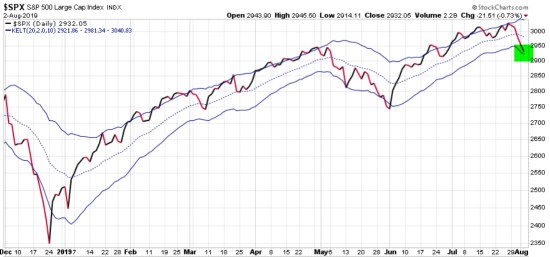
In the next chart, I use channels that represent a band of the average true range. In this case, the average true range is adapting more responsive by spreading out faster, so the SPX price trend is still within its lower channel as the price trends down.
The bottom line is, we’re seeing a volatility expansion as I suspected we could.
We’ll see where it goes from here…
Mike Shell is the Founder and Chief Investment Officer of Shell Capital Management, LLC, and the portfolio manager of ASYMMETRY® Global Tactical.
Mike Shell and Shell Capital Management, LLC is a registered investment advisor and provides investment advice and portfolio management exclusively to clients with a signed and executed investment management agreement. The observations shared on this website are for general information only and should not be construed as advice to buy or sell any security. Securities reflected are not intended to represent any client holdings or any recommendations made by the firm. Investing involves risk including the potential loss of principal an investor must be willing to bear. Past performance is no guarantee of future results. All information and data is deemed reliable, but is not guaranteed and should be independently verified. The presence of this website on the Internet shall in no direct or indirect way raise an implication that Shell Capital Management, LLC is offering to sell or soliciting to sell advisory services to residents of any state in which the firm is not registered as an investment advisor. Use of this website is subject to its terms and conditions.

You must be logged in to post a comment.