We used to say the long term average for the Cboe Volatility Index VIX is 20.
Some would mistakenly say that VIX “reverts to the mean”, suggesting it is drawn to the average level of 20, which isn’t exactly the condition. It doesn’t cycle up and down to trend around 20 most of the time, but instead, it spends much of the time between 10 and 30.
Prior to 2015, the long term average of VIX since its inception was 20 and we heard the number 20 referenced with VIX often. 
Since January 2015, we’ve seen the long term average decline to the 19 levels. 
So, 19 is the new 20.
What caused the downtrend in the long term average?
Obviously, it would take a very low level of readings to drive down the long term average of a volatility index introduced in 1993.
What happened in the past 5 years that impacted the prior 21 years of data so much to bring the 26-year average down?
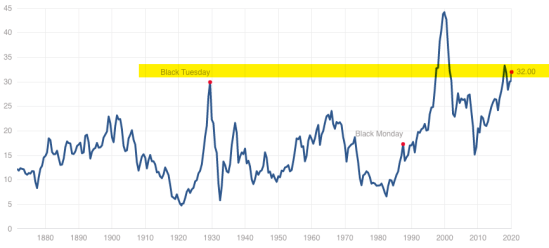
A 5 year period of low implied volatility happened with an average of 15% and a low of 9.14%. Said another way; the past 5 years expected volatility priced into S&P 500 stock options has been about 25% lower than the prior two decades, or 75% of what we previously observed. Here is the trend for VIX from 2015 to today. A VIX level of 15 translates to implied volatility of 15% on the S&P 500.

Is this a new low volatility regime?
Anything is possible, but I’m guessing the lower level of implied (expected) volatility may be driven by two facts that can both result in less concern for volatility.
- The current bull market that started in March 2009 is the longest bull market in history. It exceeded the bull market of the 1990s that lasted 113 months in terms of time, though still not as much gain as the 90s.
- The U.S. is in its longest economic expansion in history, breaking the record of 120 months of economic growth from March 1991 to March 2001, according to the National Bureau of Economic Research. However, this record-setting run observed GDP growth far slower than previous expansions.
The aged bull market and economic expansion can naturally lead to some level of complacency and expectation for less downside and tighter price trends. When investors are uncertain, their indecision shows up in a wide range of prices. When investors are smugger and confident, they are less indecisive and it’s usually after a smooth uptrend they expect to continue.
Is it another regime of irrational exuberance?
“Irrational exuberance” was the expression used by the former Federal Reserve Board chairman, Alan Greenspan, in a speech given during the dot-com bubble of the 1990s. The expression was interpreted as a warning that the stock market may have been overvalued. It was.
Irrational exuberance suggests investor enthusiasm drives asset prices up to levels that aren’t supported by fundamental financial conditions. The 90s ended with a Shiller PE Ratio over 40, far more than any other time in more than a century.
Is the stock market at a level of irrational exuberance?
Maybe so, as this is the second-highest valuation in the past 150 years according to the Shiller PE.
But, the driver here is inflation. When inflation rates are really low, we can justify a higher price to earnings ratio for stocks, so they say.
A new VIX average level of 19 translates to the implied volatility of 19% on the S&P 500 instead of the former after of 20%. It isn’t a huge range difference.
Looking over the full 26 years of implied volaltity, the more elevated levels in the past included the late 90s into around 2003, which elevated the average. Since then, we’ve seen more spikes up but not as many volatility expansions that stay high for longer periods. 
A behavior of implied volatility I’ve observed over time is it spikes up very fast when the stock market drops and then trends back down more gradually as stocks trend back up. For this reason, derivatives of volatility provide us an opportunity for asymmetric hedging.
I doubt this is a new lower long term volatility regime. My guess is we’ll see a very significant volatility expansion again at some point during the next bear market and economic recession. Historically we’ve observed trends that stretch far and wide swing back the other way, far and wide.
At a minimum, it’s no time for complacency.
Mike Shell is the Founder and Chief Investment Officer of Shell Capital Management, LLC, and the portfolio manager of ASYMMETRY® Global Tactical. Mike Shell and Shell Capital Management, LLC is a registered investment advisor in Florida, Tennessee, and Texas focused on asymmetric risk-reward and absolute return strategies and provides investment advice and portfolio management only to clients with a signed and executed investment management agreement. The observations shared on this website are for general information only and should not be construed as advice to buy or sell any security. Securities reflected are not intended to represent any client holdings or any recommendations made by the firm. Any opinions expressed may change as subsequent conditions change. Do not make any investment decisions based on such information as it is subject to change. Investing involves risk, including the potential loss of principal an investor must be willing to bear. Past performance is no guarantee of future results. All information and data are deemed reliable but is not guaranteed and should be independently verified. The presence of this website on the Internet shall in no direct or indirect way raise an implication that Shell Capital Management, LLC is offering to sell or soliciting to sell advisory services to residents of any state in which the firm is not registered as an investment advisor. The views and opinions expressed in ASYMMETRY® Observations are those of the authors and do not necessarily reflect a position of Shell Capital Management, LLC. The use of this website is subject to its terms and conditions.

You must be logged in to post a comment.