Dow Jones is down -10% off its high. I don’t pay much attention to the Dow Jones Industrial Average as it’s a price-weighted index of 30 stocks. But, the S&P 500 capitalization-weighted index of approximately 500 stocks seems a better proxy for “the market,” and it’s not far behind.
Here is the percent off high (drawdown) chart year to date.
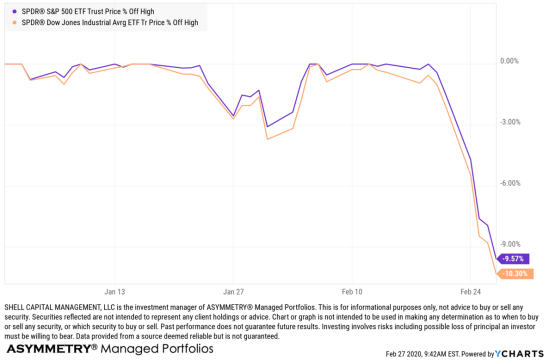
We don’t own either of these ETFs, they are for illustration only. In fact, our portfolio is was 85% U.S. Treasuries, and 15% invested in high dividend-yielding positions. One of them has a dividend yield of 9.8% and the other 11.9%, so while their prices may be falling with the stock market, we have some margin of safety from the high yield. In fact, as the prices fall, the yield rises from that starting point.
Speaking of dividend yield below is a visual of the dividend yield of the S&P 500 (1.84’%) and the Dow (2.27%), which are relatively low historically. But, as prices fall, the yields will rise, assuming the stocks in the index keep paying dividends.
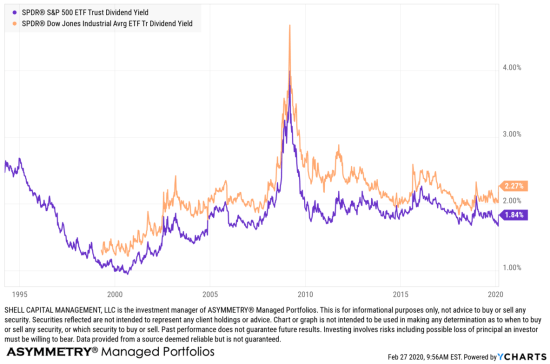
In the above chart, I’m using the ETF dividend yields as they are real-time. Since the ETFs have only been trading for two or three decades, to see what I mean by “long term” I look at the S&P 500 Stock Index dividend yield (calculated as 12-month dividend per share)/price) to see how low the yield has been the past twenty years.
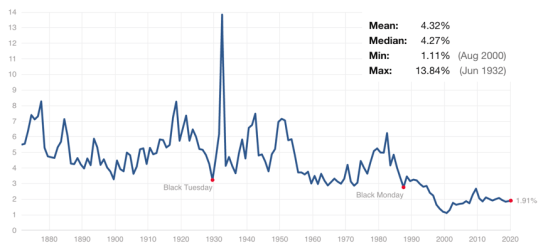
So, the future expected return from dividend yields on these stocks indexes is relatively low, looking back 150 years. The spikes you see are after stock market crashes as the price falls, the yield rises, as with bonds. Low dividend yield also suggests the stock market is overvalued. A higher dividend yield indicates the stock market is undervalued, and if nothing else, investors earn a higher income from the dividends from a lower starting price.
Back to the year to date, the short term, the S&P 500 is now down -5% in 2020, and the Dow Jones is down -7%.
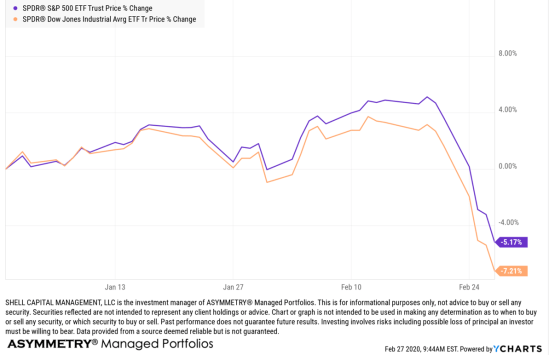
I believe this may be the fastest -10% decline in the history of the Dow Jones Industrial average.
I’m just glad we aren’t in it.
This is when drawdown controls and risk management pays. More importantly, it’s when discipline pays. While some investment managers want to manage risk to limit their drawdowns, they don’t always excel at doing it. Discipline is a personal edge. It doesn’t matter how good our scientifically tested quantitative models with a mathematical basis for believing in them are if we lack the discipline to execute them with precision. I can also say it isn’t enough for me to have all the discipline either, as we must necessarily help our investment management clients stick with it, too. So, investor behavior modification is part of our wealth management services. It’s why Christi Shell is not only a Certified Wealth Strategist® with over twenty-six years of experience helping high net worth families with the overall management of assets but also a certified Behavioral Financial Advisor® (BFA®) to help them manage themselves.
It’s what we do.
Need help? Contact us here.
Mike Shell is the Founder and Chief Investment Officer of Shell Capital Management, LLC, and the portfolio manager of ASYMMETRY® Global Tactical. Mike Shell and Shell Capital Management, LLC is a registered investment advisor in Florida, Tennessee, and Texas focused on asymmetric risk-reward and absolute return strategies and provides investment advice and portfolio management only to clients with a signed and executed investment management agreement. The observations shared on this website are for general information only and should not be construed as advice to buy or sell any security. Securities reflected are not intended to represent any client holdings or any recommendations made by the firm. I observe the charts and graphs to visually see what is going on with price trends and volatility, it is not intended to be used in making any determination as to when to buy or sell any security, or which security to buy or sell. Instead, these are observations of the data as a visual representation of what is going on with the trend and its volatility for situational awareness. I do not necessarily make any buy or sell decisions based on it. Any opinions expressed may change as subsequent conditions change. Do not make any investment decisions based on such information as it is subject to change. Investing involves risk, including the potential loss of principal an investor must be willing to bear. Past performance is no guarantee of future results. All information and data are deemed reliable but is not guaranteed and should be independently verified. The presence of this website on the Internet shall in no direct or indirect way raise an implication that Shell Capital Management, LLC is offering to sell or soliciting to sell advisory services to residents of any state in which the firm is not registered as an investment advisor. The views and opinions expressed in ASYMMETRY® Observations are those of the authors and do not necessarily reflect a position of Shell Capital Management, LLC. The use of this website is subject to its terms and conditions.

You must be logged in to post a comment.