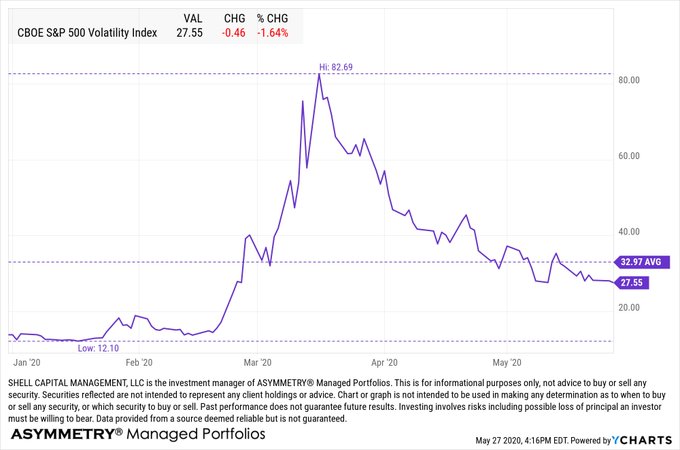
The CBOE Volatility Index (VIX) estimates expected volatility by aggregating the weighted prices of S&P 500 Index (SPX) puts and calls over a wide range of strike prices. Specifically, the prices used to calculate VIX Index values are midpoints of real-time SPX option bid/ask price quotations.
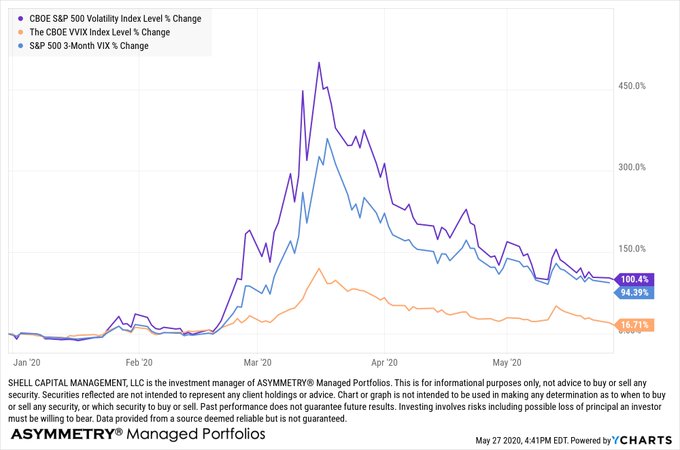
CBOE Volatility Index (VIX) has averaged 33 this year with a low of 12 and high of 83.69, the highest implied volatility has ever been.
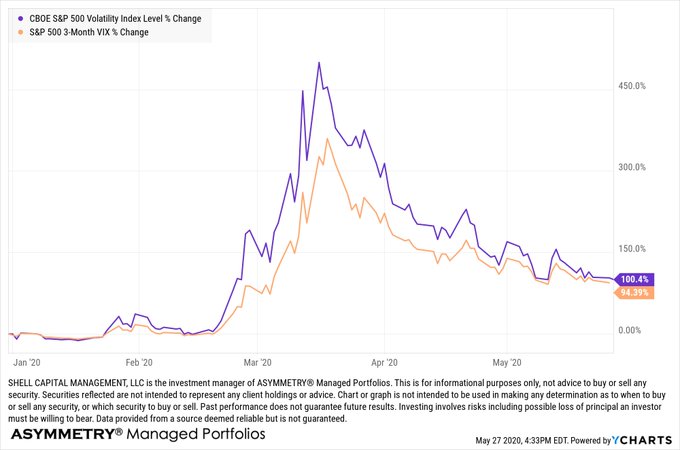
The VIX futures curve is in contango about 80% of the time and normally goes into backwardation in stressed markets.
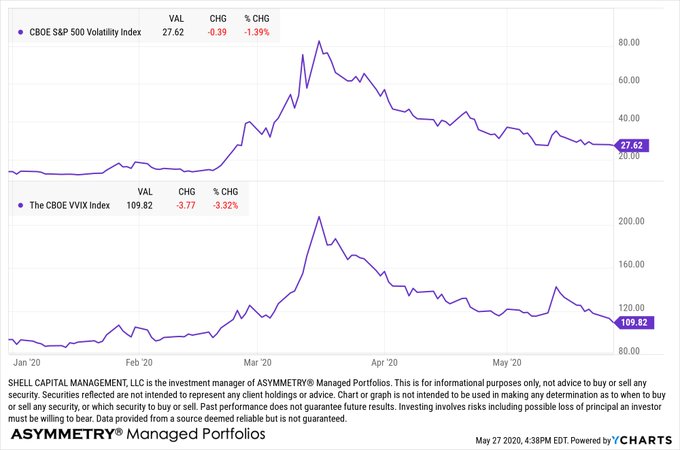
VIX is a gauge of expected future volatility and VVIX is the vol of VIX. Both suggest a lower future vol. We’ll see.
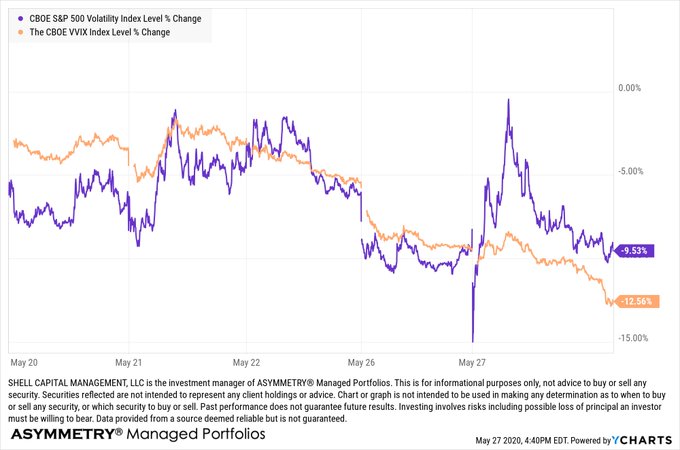
The VVIX is drifting down relative to VIX the past five days.
Forecasts of volatility for stocks are valuable for investors as a measure of traders’ uncertainty about a stock or index price. With VIX we can quickly gauge the future expectation for volatility priced by options. If it’s a “fear gauge”, it’s indicating less fear.
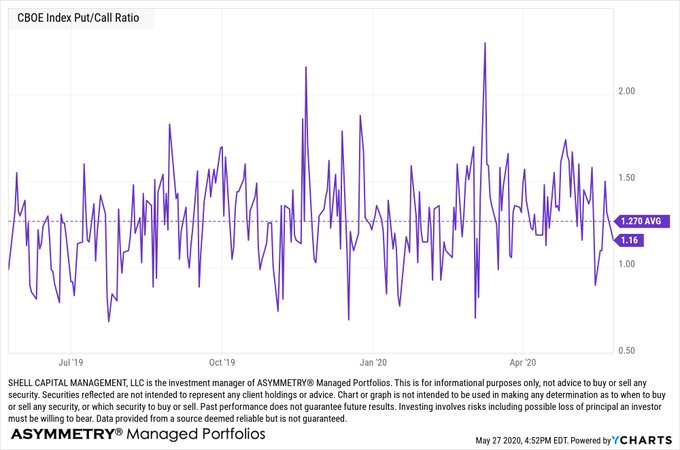
The CBOE Index Put/Call Ratio is back to its long term average. I believe index options are mostly traded by fund managers for hedging.
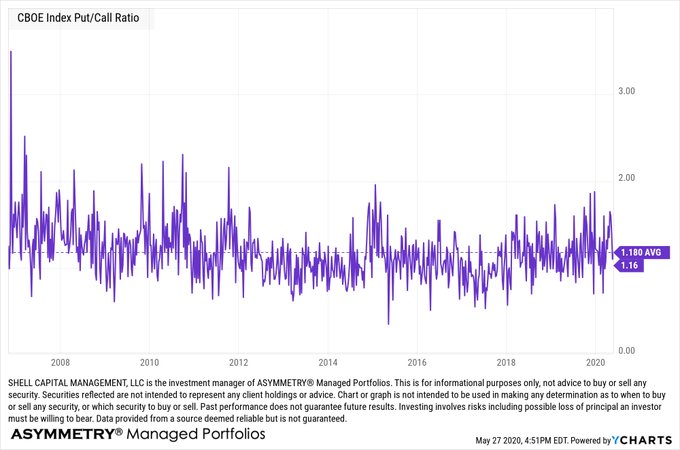
The CBOE Index Put/Call Ratio is just under its one year average. It was about 0.70 before the March waterfall decline.
CBOE Equity Put/Call Ratio is trending toward the low level was saw before the waterfall decline in March. A falling put-call ratio, or a ratio less than 1, means that traders are buying fewer puts than calls. It suggests that bullish sentiment is building in the market.
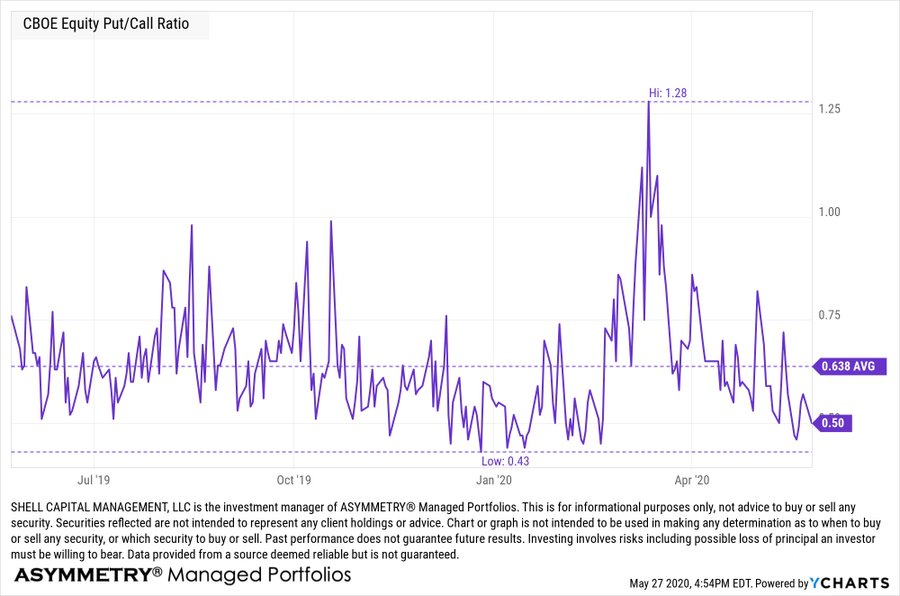
CBOE Equity Put/Call Ratio drifting down to 0.50 may be an early warning sign the market is becoming complacent.
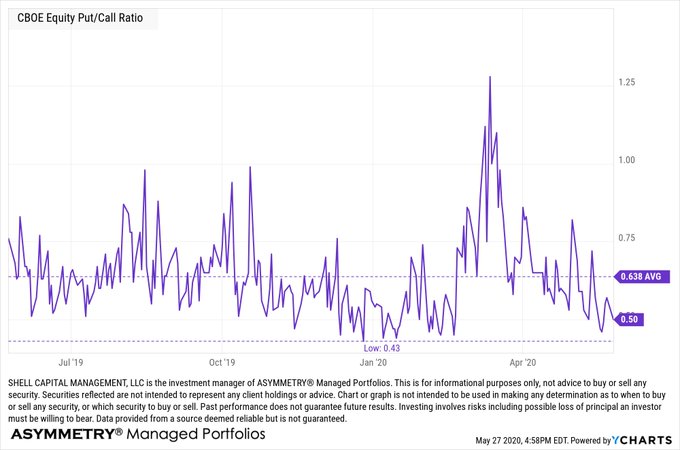
Since I believe index options are mostly used by money managers for hedging, I consider its level around average to be normal. But I believe equity options are traded more by speculators, so it may be the earlier gauge of a shift in sentiment.
I was talking volatility trading with someone recently when it occurred to me I was learning Lotus 1-2-3 for advanced accounting in the 90s when I first started exploring volatility and VIX indexes. So, I’ve been observing the volatility profile a long time.
I wouldn’t be surprised to see another volatility expansion before we see implied volatility back down dow 20 or lower.
Another useful way I like to illustrate the volatility contractions and expansions to clients is a volatility channel. In the chart I used two standard deviations from the 20 day moving average around the S&P 500 price trend to show an upside breakout known as Bollinger Bands. The chart below is is the width of the bands, which is a good illustration of the volatility expansion and contraction the past two months.
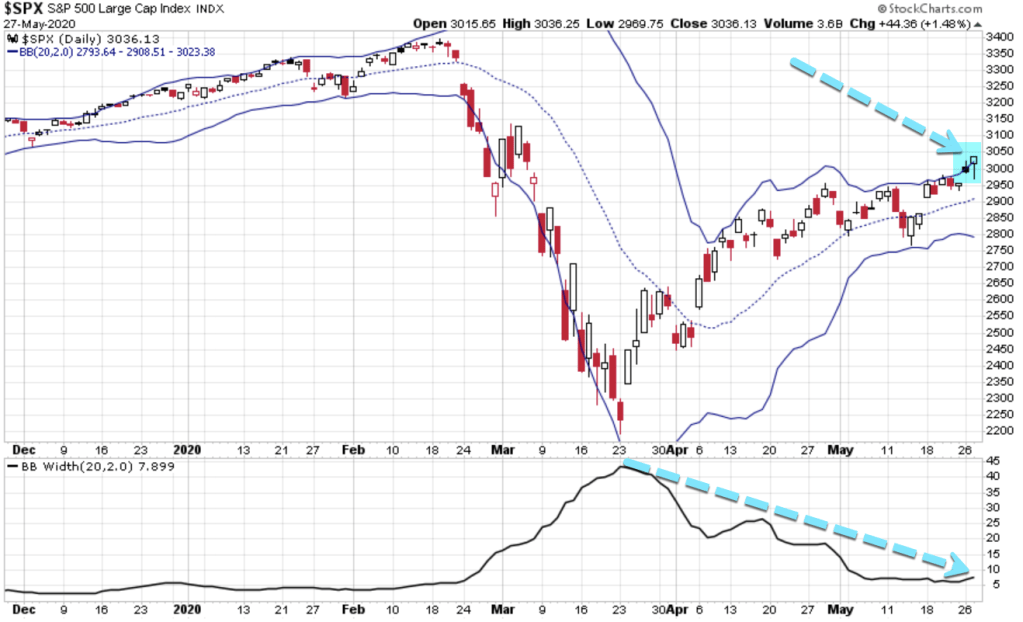
Periods of volatility contractions are eventually followed by volatility expansions.
Mike Shell is the Founder and Chief Investment Officer of Shell Capital Management, LLC, and the portfolio manager of ASYMMETRY® Global Tactical. Mike Shell and Shell Capital Management, LLC is a registered investment advisor focused on asymmetric risk-reward and absolute return strategies and provides investment advice and portfolio management only to clients with a signed and executed investment management agreement. The observations shared on this website are for general information only and should not be construed as advice to buy or sell any security. Securities reflected are not intended to represent any client holdings or any recommendations made by the firm. Any opinions expressed may change as subsequent conditions change. Do not make any investment decisions based on such information as it is subject to change. Investing involves risk, including the potential loss of principal an investor must be willing to bear. Past performance is no guarantee of future results. All information and data are deemed reliable but is not guaranteed and should be independently verified. The presence of this website on the Internet shall in no direct or indirect way raise an implication that Shell Capital Management, LLC is offering to sell or soliciting to sell advisory services to residents of any state in which the firm is not registered as an investment advisor. The views and opinions expressed in ASYMMETRY® Observations are those of the authors and do not necessarily reflect a position of Shell Capital Management, LLC. The use of this website is subject to its terms and conditions.

You must be logged in to post a comment.