ASYMMETRY® Observations are Mike Shell’s observations of investor behavior causing directional price trends, global macro, tactical ETF trading, momentum stock trading, hedging, volatility trading, and risk management that creates asymmetric investment returns. An asymmetric return profile is a risk/reward profile with a positive asymmetry between profit and loss. Mike Shell is the founder of Shell Capital Management, LLC and the portfolio manager of ASYMMETRY® Global Tactical
Macroeconomics is a branch of economics dealing with the performance, structure, behavior, and decision-making of an economy as a whole.
Macroeconomics is the part of economics focused on the big picture: analyzing economic phenomena such as interest rates, growth, unemployment, and inflation. Macro is in contrast with microeconomics, the study of the behavior of individual markets, workers, households, and firms. Macroeconomic phenomena are the product of all the microeconomic activity in an economy.
Global is related to, or involving, the whole world, not just one country or state.
Global Macroeconomics, or Global Macro, then, is looking at the whole world for trends and behavior of big picture trends.
US Total Vehicle Sales measures the total number of auto, light truck, and heavy truck sales in the US and helps gauge how consumers are spending their discretionary income. In the chart, we can visually see the trends in car and truck sales going back 43 years.
US Total Vehicle Sales bottomed at prior lows, and is now trending back up.
US Light Truck Sales is part of total sales and at a current level of 9.6 million, it’s up from 6.7 million last month and down from 12.57 million one year ago.
US Light Truck Sales has been in an overall uptrend the past four decades, and it reverted to the long term average, but is recovering. US Light Truck Sales is up 41.68% from last month, and -23.96% from one year ago.
Personal Consumption Expenditures Price Index (PCE) is a measure of the prices that people living in the United States, or those buying on their behalf, pay for goods and services. The PCE price index is known for capturing inflation (or deflation) across a wide range of consumer expenses and reflecting changes in consumer behavior. The PCE price index, released each month in the Personal Income and Outlays report, reflects changes in the prices of goods and services purchased by consumers in the United States. Quarterly and annual data are included in the GDP release.
Personal Consumption Expenditures Price Index (PCE) Year over Year is is at 0.55%, compared to and 1.38% last year (a decline of 60%) and is materially lower than the long term average of 3.25%.
US Personal Spending Month over Month is at 8.17%, compared to -12.62% last month and 0.44% last year. US Personal Spending is now higher than the long term average of 0.52%. The chart shows this data was historically more stable, but we’ve observe some extreme outlier trends this year never seen in the last 60 years.
The US Inflation Rate is the percentage in which a chosen basket of goods and services purchased in the US increases in price over a year. Inflation is one of the metrics used by the US Federal Reserve to gauge the health of the economy. Since 2012, the Federal Reserve has targeted a 2% inflation rate for the US economy and may make changes to monetary policy if inflation is not within that range. A notable time for inflation was the early 1980’s during the recession. Inflation rates went as high as 14.93%, causing the Federal Reserve led by Paul Volcker to take dramatic actions.
US Inflation Rate is at 0.12%, compared to 0.33% last month and 1.79% last year. This is disinflation, which is a decrease in the rate of inflation. Disinflation is a slowdown in the rate of increase of the general price level of goods and services in a nation’s gross domestic product over time. Inflation has mostly trended below the long term average of 3.23% for years, but is extremely low at 0.12%. We could be a risk of deflation, which occurs when the inflation rate falls below 0%.
Inflation reduces the value of a currency over time, but sudden deflation increases it. As inflation is declining, the US Dollar is trending up.
When we think of macroeconomics trends like inflation and the US Dollar, we also think of gold. Here is Gold, priced in US Dollars. The Gold Price in US Dollars measures the cost in US Dollars for a Troy Ounce of gold. Gold can be seen as a “safe haven” investment since it is a tangible investment. Gold is also believed to be a hedge against inflation, which is why it reached as high as $1,895 per troy ounce in 2011 when inflation trended higher.
Gold is in an uptrend.
Inflation and interest rates are the primary return driver of stocks and bonds as well as some commodities and currencies.
The 10 Year Treasury Rate is the yield earned by investing in a US government issued treasury security that has a maturity of 10 years. The 10 year treasury yield is the longer end of the yield curve. Many analysts use the 10 year yield as the “risk free” rate when valuing the markets or an individual security. Historically, the 10 Year treasury rate reached as high as 15.84% in 1981 as the Fed raised benchmark rates in an effort to contain inflation.
10 Year Treasury Rate is the lowest it has been the past 30 years, currently at 0.64%, compared to 2.01% last year, and is significantly lower than the long term average of 4.45%.
We all know that past performance is no guarantee of future results, and the bond market expected return is a fine example. One thing that is essential for investors to understand is the long term bond returnswill not repeat their pastperformanceover the long term.
The directional trend of interest rates like the 10 Year Treasury Rate are a driver of other rates, such as mortgage rates.
The 30 Year Mortgage Rate is the fixed interest rate that US home-buyers would pay for a 30 year mortgage. Historically, the 30-year mortgage rate has trended as high as 18.6% in 1981, and up until now has trended down as low as 3.3% in 2012.
The 30 Year Mortgage Rate is at 3.13%, the lowest in 48 years, compared to 3.82% last year, and less than half of its 7.97% long term average.
The 15 Year Mortgage Rate is trending down low enough to double tap its all time low at 2.59% reached in May 2013, which is significantly lower than the long term average of 5.36%.
That’s all for now.
Don’t miss out! Stay informed and sign up for an email of new ASYMMETRY® Observations, including some that may not be posted here.
Join 520 other subscribers
Mike Shell is the Founder and Chief Investment Officer of Shell Capital Management, LLC, and the portfolio manager of ASYMMETRY® Global Tactical. Mike Shell and Shell Capital Management, LLC is a registered investment advisor focused on asymmetric risk-reward and absolute return strategies and provides investment advice and portfolio management only to clients with a signed and executed investment management agreement. The observations shared on this website are for general information only and should not be construed as advice to buy or sell any security. Securities reflected are not intended to represent any client holdings or any recommendations made by the firm. Any opinions expressed may change as subsequent conditions change. Do not make any investment decisions based on such information as it is subject to change. Investing involves risk, including the potential loss of principal an investor must be willing to bear. Past performance is no guarantee of future results. All information and data are deemed reliable but is not guaranteed and should be independently verified. The presence of this website on the Internet shall in no direct or indirect way raise an implication that Shell Capital Management, LLC is offering to sell or soliciting to sell advisory services to residents of any state in which the firm is not registered as an investment advisor. The views and opinions expressed in ASYMMETRY® Observations are those of the authors and do not necessarily reflect a position of Shell Capital Management, LLC. The use of this website is subject to its terms and conditions.
Unfortunately, we’ll see a pause in reopening as hospitalizations trend up.
Hospitalizations have much further to rise, but they shouldn’t increase as much as cases.
I just got an updated data feed for today. Florida Coronavirus Cases is at a current level of 122,960, up from 114,018 yesterday, and a change of 7.84% from yesterday. Cases increased by 205% this week and 1,050% over the past 30 days.
Florida COVID hospitalizations continue in a 45-degree uptrend.
I continued to reiterate the direction of a trend is important, but so is the rate of change. This new rising rate of change isn’t what we want to see and is a derivative of the reproduction rate.
Daily deaths in Florida, however, continues to oscillate around its mean. I expect this may trend up and follow new cases, but, it will depend on how many of those new cases are younger healthy people who get over it vs. higher-risk people who may not.
Cases relative to tests administered shows us the ratio between the two. As this trend bottomed June 9th and has seen trended up, it tells us the cases relative to tests is increasing. In other words, new cases are showing more momentum than new testing.
THE GOOD NEWS IS: The death rate in FL continues to fall, which is hopefully a reflection of better treatment and/or the virus weakening. I’m guessing some part of it is a function of younger people getting infected and shaking it off.
Life is full of risks and rewards, so we make the best of it by directing and controlling our possibility of loss.
Intelligent people focus on managing the downside, the surprises, the uncertainty, and the risks since the upside of rewards takes care of itself.
At this point, we’ve all been made well aware of how to direct and control our risk to the possibility of loss, so we only have to do it.
These stock indexes are now down -11% or more off their highs, and the Dow Jones is down -15% from its February high.
I reduced our exposure to stocks to zero a week ago.
Be informed, and prepared, not afraid.
Don’t miss out! If you want to follow along sign up for an email of new ASYMMETRY® Observations.
Join 520 other subscribers
Mike Shell is the Founder and Chief Investment Officer of Shell Capital Management, LLC, and the portfolio manager of ASYMMETRY® Global Tactical. Mike Shell and Shell Capital Management, LLC is a registered investment advisor focused on asymmetric risk-reward and absolute return strategies and provides investment advice and portfolio management only to clients with a signed and executed investment management agreement. The observations shared on this website are for general information only and should not be construed as advice to buy or sell any security. Securities reflected are not intended to represent any client holdings or any recommendations made by the firm. Any opinions expressed may change as subsequent conditions change. Do not make any investment decisions based on such information as it is subject to change. Investing involves risk, including the potential loss of principal an investor must be willing to bear. Past performance is no guarantee of future results. All information and data are deemed reliable but is not guaranteed and should be independently verified. The presence of this website on the Internet shall in no direct or indirect way raise an implication that Shell Capital Management, LLC is offering to sell or soliciting to sell advisory services to residents of any state in which the firm is not registered as an investment advisor. The views and opinions expressed in ASYMMETRY® Observations are those of the authors and do not necessarily reflect a position of Shell Capital Management, LLC. The use of this website is subject to its terms and conditions.
Individual investors are now bearish based on the survey and expected volatility.
Since 1987, the American Association of Individual Investors has asked the same simple question each week to see what direction individual investors think the market is headed over the next six months. The results are compiled into the AAII Investor Sentiment Survey, which offers insight into the mood of individual investors.
Since the crowd tends to get it wrong at extremes, when I see sentiment reach a historic high or low, I take note.
Falling bullish investor sentiment and rising bearish sentiment pushed the spread between bullish and bearish investors down to a low level.
Bearishness hasn’t historically trended much higher than this.
Bullish investor sentiment is about as low as it has been in history.
Neutral investor sentiment is about average.
Unlike the AAII Investor Sentiment Survey, the Fear & Greed Index, which tracks seven different investor sentiment indicators, is neutral.
Investor fear and greed oscillates over time as investors swing from the fear of missing out and the fear of losing more money. Fear and greed is neutral at mid field in the cycle and is pointing down again.
Investor sentiment gauges may not be the best market timers, but the Fear & Greed Index can be a useful gauge for investors to signal when you don’t want to be part of the crowd sentiment.
At extremes, most investors feel the wrong feeling at the wrong time, so if we are to create better results than the crowd, we must necessarily be thinking, feeling, and doing the opposite of the herd.
Expected volatility remains elevated, also signaling a higher than average level of fear.
After the biggest volatility expansion, ever, implied volatility (VIX) has settled down to 32, which is elevated. The CBOE Volatility Index (VIX) is a real-time market index that represents the market’s expectation of 30-day forward-looking volatility. The VIX is derived from the price of the S&P 500 index options, and provides a measure of market risk and investors’ sentiments.
So, I’m guessing one of two things is about to happen. Either this bearishness will prove wrong and the stock market will trend up, or it will get a lot worse.
It seems like investors are probably becoming more concerned about the new uptrend in COVID 19 cases.
I don’t believe Coronavirus was the primary driver of the stock market crash in March, but it may be more of an issue now that it continues to spread.
Don’t miss out! If you want to follow along sign up for email alerts.
Join 520 other subscribers
Mike Shell is the Founder and Chief Investment Officer of Shell Capital Management, LLC, and the portfolio manager of ASYMMETRY® Global Tactical. Mike Shell and Shell Capital Management, LLC is a registered investment advisor focused on asymmetric risk-reward and absolute return strategies and provides investment advice and portfolio management only to clients with a signed and executed investment management agreement. The observations shared on this website are for general information only and should not be construed as advice to buy or sell any security. Securities reflected are not intended to represent any client holdings or any recommendations made by the firm. Any opinions expressed may change as subsequent conditions change. Do not make any investment decisions based on such information as it is subject to change. Investing involves risk, including the potential loss of principal an investor must be willing to bear. Past performance is no guarantee of future results. All information and data are deemed reliable but is not guaranteed and should be independently verified. The presence of this website on the Internet shall in no direct or indirect way raise an implication that Shell Capital Management, LLC is offering to sell or soliciting to sell advisory services to residents of any state in which the firm is not registered as an investment advisor. The views and opinions expressed in ASYMMETRY® Observations are those of the authors and do not necessarily reflect a position of Shell Capital Management, LLC. The use of this website is subject to its terms and conditions.
Indeed, the stock market indexes seem to be reflecting something negative today.
I’m guessing it may be the uptrend in new cases per day. For example, Florida has reached a significant new high.
As I’ve been saying for the past two weeks, the new uptrend breakout in cases per day is NOT driven by more testing. Below is a sample of the states with the highest new cases, and as you can see, the bars show the percent increase in new cases and testing.
This is NOT the kind of asymmetry I like to see.
Considering the elevated risk level in the stock market by my measures, it is likely we’ll see more downside for stocks.
So, we have been positioned in long U.S. Treasuries for over a week.
Join 520 other subscribers
Mike Shell is the Founder and Chief Investment Officer of Shell Capital Management, LLC, and the portfolio manager of ASYMMETRY® Global Tactical. Mike Shell and Shell Capital Management, LLC is a registered investment advisor focused on asymmetric risk-reward and absolute return strategies and provides investment advice and portfolio management only to clients with a signed and executed investment management agreement. The observations shared on this website are for general information only and should not be construed as advice to buy or sell any security. Securities reflected are not intended to represent any client holdings or any recommendations made by the firm. Any opinions expressed may change as subsequent conditions change. Do not make any investment decisions based on such information as it is subject to change. Investing involves risk, including the potential loss of principal an investor must be willing to bear. Past performance is no guarantee of future results. All information and data are deemed reliable but is not guaranteed and should be independently verified. The presence of this website on the Internet shall in no direct or indirect way raise an implication that Shell Capital Management, LLC is offering to sell or soliciting to sell advisory services to residents of any state in which the firm is not registered as an investment advisor. The views and opinions expressed in ASYMMETRY® Observations are those of the authors and do not necessarily reflect a position of Shell Capital Management, LLC. The use of this website is subject to its terms and conditions.
Macroeconomics is a branch of economics dealing with the performance, structure, behavior, and decision-making of an economy as a whole. Macroeconomics is the part of economics focused on the big picture: analyzing economic phenomena such as interest rates, growth, unemployment, and inflation. Macro is in contrast with microeconomics, the study of the behavior of individual markets, workers, households, and firms. Macroeconomic phenomena are the product of all the microeconomic activity in an economy.
Global is relating to, or involving, the whole world, not just one country or state.
Global Macroeconomics, or Global Macro, then, is looking at the whole world for trends and behavior of big picture trends.
US Existing Home Sales reflects the total unit sales of US homes that are already built. It is a lagging indicator tracking the US housing market, which is impacted by changes in mortgage rates. Historically, US Existing Home Sales declined to a trough of 3.77 million units sold in November 2008 as foreclosures increased and home values fell during the US Housing Crisis.
US Existing Home Sales is at a current level of 3.91M, down from 4.33M last month and down from 5.33M one year ago. This is a change of -9.70% from last month and -26.64% from one year ago.
The US Retail Gas Price is the average price that retail consumers pay per gallon, for all grades of gasoline. Retail gas prices are important to view in regards to how the energy industry is performing. Additionally, retail gas prices can give a good overview of how much discretionary income consumers might have to spend.
US Retail Gas Price is at a current level of 2.185, up from 2.123 last week and down from 2.821 one year ago. This is a change of 2.92% from last week and -22.55% from one year ago. US Retail Gas Price is trending up from its recent low, which was around the same level of support gas had at prior lows of the past decade.
China Imports YoY is down -16.69%, compared to -14.19% last month and -8.22% last year. This is lower than the long term average of -3.83%.
China Trade Balance is at a high of 62.93B, up from 45.33B last month and up from 41.20B one year ago. This is a change of 38.82% from last month and 52.73% from one year ago.
US Continuing Claims for Unemployment Insurance is at a current level of 20.54M, down from 20.61M last week and up from 1.70M one year ago. This is a change of -0.30% from last week and 1.11K% from one year ago.
US Initial Jobless Claims, provided by the US Department of Labor, provides underlying data on how many new people have filed for unemployment benefits in the previous week. We can gauge market conditions in the US economy with respect to employment; as more new individuals file for unemployment benefits, fewer individuals in the economy have jobs. Historically, initial jobless claims tended to reach peaks towards the end of recessionary periods such as on March 21, 2009 with a value of 661,000 new filings.
US Initial Claims for Unemployment Insurance is at a current level of 1.508M, down from 1.566M last week and up from 222,000 one year ago. This is a change of -3.70% from last week and still up 579.3% from one year ago.
Equity option demand continues to be focused on call buying relative to put options.
The CBOE Equity Put/Call Ratio had reached a very low level, indicating options traders were mostly operating in speculative call options over put options for hedging.
“CBOE Equity Put/Call Ratio is trending toward the low level was saw before the waterfall decline in March. A falling put-call ratio, or a ratio less than 1, means that traders are buying fewer puts than calls. It suggests that bullish sentiment is building in the market.”
Shortly after, we saw a -7% decline in the stock indexes.
However, I’m seeing evidence of hedging now. The CBOE Index Put/Call Ratio shows a relatively high degree of hedging with put options.
Implied volatility as measured by the CBOE Volatility Index (VIX) remains very elevated, even though it declined nearly 10% today. In fact, it has mean reversed, as it does. The VIX is at its one year average.
Global Macro trends are all over the place.
Join 520 other subscribers
Mike Shell is the Founder and Chief Investment Officer of Shell Capital Management, LLC, and the portfolio manager of ASYMMETRY® Global Tactical. Mike Shell and Shell Capital Management, LLC is a registered investment advisor focused on asymmetric risk-reward and absolute return strategies and provides investment advice and portfolio management only to clients with a signed and executed investment management agreement. The observations shared on this website are for general information only and should not be construed as advice to buy or sell any security. Securities reflected are not intended to represent any client holdings or any recommendations made by the firm. Any opinions expressed may change as subsequent conditions change. Do not make any investment decisions based on such information as it is subject to change. Investing involves risk, including the potential loss of principal an investor must be willing to bear. Past performance is no guarantee of future results. All information and data are deemed reliable but is not guaranteed and should be independently verified. The presence of this website on the Internet shall in no direct or indirect way raise an implication that Shell Capital Management, LLC is offering to sell or soliciting to sell advisory services to residents of any state in which the firm is not registered as an investment advisor. The views and opinions expressed in ASYMMETRY® Observations are those of the authors and do not necessarily reflect a position of Shell Capital Management, LLC. The use of this website is subject to its terms and conditions.
As much as I wish it wasn’t so, some important trends are in the wrong direction.
New COVID – 19 cases here in Florida are trending to a material new high.
Contrary to what some seem to blindly say; it isn’t because of more testing.
In Florida, testing slowed down 3% while new cases grew 88% over the last week.
Yesterday, Governor Ron DeSantis acknowledged that the rising number of new Covid-19 cases in Florida cannot be explained away by an increase in testing, and announced plans to step up enforcement of social distancing practices in bars and nightclubs in “DeSantis pivots on Covid-19 surge, says testing doesn’t account for spike.“
“Even with the testing increasing or being flat, the number of people testing positive is accelerating faster than that,” DeSantis told reporters during a briefing at the state Capitol. “You know that’s evidence that there’s transmission within those communities.”
Of course, it isn’t just Florida.
As of today, US Coronavirus Tests Administered is at a current level of 26.57 million, up from 25.98 million yesterday. It’s a change of 2.25% from yesterday.
US Coronavirus Cases is at a current level of 2.255 million, up from 2.223 million yesterday, which is a change of 1.46% from yesterday.
Here are the absolute trends in comparison.
The good news is the spread between US Coronavirus Tests and Cases is in an uptrend, so negative tests overwhelm positive test results.
We can use a ratio chart to see the relative trend in cases and tests. I do the same with global market trends. For example, we can compare the US Energy sector to the S&P 500 to see the relative strength or weakness. When the trend is down as it is here, the sector is lagging.
Here is a simple analog chart comparison.
In contrast, the Technology sector has been relatively stronger than the S&P 500 stock index.
And the relative strength ratio between Technology and the broader stock market index shows the opposite trend than what we saw from Energy.
So, back to the COVID trend, taking this same ratio methodology applied to tests and cases, the relative trend is down, so cases are lagging tests by a material amount. We want to see this trend continue.
So far, states have reported 630 deaths and the trend is down, so we are seeing a national decline. Death reporting lags approximately 28 days from symptom onset, according to CDC models that consider lags in symptoms, time in hospital, and the death reporting process.
So, that’s the good news.
What I believe people will increasingly focus on is the breakout in new cases per day. Many trackers are normalizing the trend with a 7 day moving average, but the data already has a natural lag between contraction, testing, a positive case, so I’m not adding one myself.
Instead, I want to see a new breakout as soon as it develops. If we wait for a 7 day moving average new high, the lag will delay noticing the breakout.
I pointed out over a week ago I’m seeing new breakouts to the upside.
I’m still seeing new breakouts in cases per day.
I pointed out Florida, Arizona, and Texas. Now add Georgia.
And it isn’t just more testing in Georgia.
California is still trending up, and although their testing is rising, it isn’t just an increase in tests.
Oklahoma cases have now broken out into an uptrend. Again, the new high in cases per day doesn’t correspond to a new high in testing.
We’re seeing breakouts in other countries, too, such as Brazil.
Others like Russia have peaked and are drifting down.
So, there’s the trends.
What about the momentum of the trend?
Just as I have proprietary momentum and relative strength algorithms to define the speed of a price trend in global markets, they also have a measure of the speed of the COVID – 19 trend.
The values for Rt is a key measure of how fast the virus is growing. It’s the average number of people who become infected by an infectious person. If Rt is above 1.0, the virus will spread quickly. When Rt is below 1.0, the virus will stop spreading. Projecting the reproduction number is essential to understand how explosive an uptrend in new cases may be.
The Rt for Florida is 1.39, so it’s likely to spread relatively fast and we’ll see cases trend up as the new cases are spreading it to others. Florida has been in the top five of all states since I’ve been monitoring it.
Hawaii has the highest reproduction number in the United States.
Tennessee hasn’t been spreading it as fast.
The Rt for New York was as high as 2 early on, so a person who contracted the virus spread it to about two more, but it has slowed.
The states with the lowest Rt levels are in the north right now and the highest are in the south, or the warmest climates.
So much for the theory that heat will smoother the Coronavirus. It doesn’t seem to be the case.
Here are all of the states ranked from lowest to highest R.
Here are the Southern states. Most are in the red zone.
Next is the Northeast, who has maintained the most aggressive shelter in place and such.
Does this mean it’s working? Well, yes, if you aren’t around people, the spread will slow. However, only time will tell if these more city like areas come back sharply once they are back to full production.
By the way, here are the states that never sheltered.
So, we should prepare for the media to increasingly make this a big story again. As I see it, the odds of catching it is relatively low if less than 1% of the population has it. The trouble is, without testing everyone, we don’t know the positive rate. Right now the positive rate in Florida is increasing at 12%.
We should also prepare for the likelihood the stock market will eventually respond to these rising trends in new cases and the possibility of fear driving the stock market down again.
Although, it isn’t just a reaction to the continuation of COVID, but also the high risk level of the stock market.
The stock market is at an elevated risk level based on both fundamental valuation and quantitative momentum measures.
The S&P 500 Shiller CAPE Ratio, also known as the Cyclically Adjusted Price-Earnings ratio, is defined as the ratio the the S&P 500’s current price divided by the 10-year moving average of inflation-adjusted earnings. The metric was invented by American economist Robert Shiller and has become a popular way to understand long-term stock market valuations. It is used as a valuation metric to forecast future returns, where a higher CAPE ratio could reflect lower returns over the next couple of decades, whereas a lower CAPE ratio could reflect higher returns over the next couple of decades, as the ratio reverts back to the mean.
S&P 500 Shiller CAPE Ratio is at a current level of 27.64, up from 26.03 last month and down from 29.24 one year ago. This is a change of 6.18% from last month and -5.48% from one year ago. It remains well above average and it’s at the third highest level it has ever been. These trends in valuation get resolved eventually, even if the Fed is trying to support stable prices.
The short term relative strength reading the speed and magnitude of the moves isn’t as overbought as it was when I pointed it out two weeks ago, but it’s also far from oversold.
Mike Shell is the Founder and Chief Investment Officer of Shell Capital Management, LLC, and the portfolio manager of ASYMMETRY® Global Tactical. Mike Shell and Shell Capital Management, LLC is a registered investment advisor focused on asymmetric risk-reward and absolute return strategies and provides investment advice and portfolio management only to clients with a signed and executed investment management agreement. The observations shared on this website are for general information only and should not be construed as advice to buy or sell any security. Securities reflected are not intended to represent any client holdings or any recommendations made by the firm. Any opinions expressed may change as subsequent conditions change. Do not make any investment decisions based on such information as it is subject to change. Investing involves risk, including the potential loss of principal an investor must be willing to bear. Past performance is no guarantee of future results. All information and data are deemed reliable but is not guaranteed and should be independently verified. The presence of this website on the Internet shall in no direct or indirect way raise an implication that Shell Capital Management, LLC is offering to sell or soliciting to sell advisory services to residents of any state in which the firm is not registered as an investment advisor. The views and opinions expressed in ASYMMETRY® Observations are those of the authors and do not necessarily reflect a position of Shell Capital Management, LLC. The use of this website is subject to its terms and conditions.
“It doesn’t matter what we think about a trend, it matters what the crowd thinks about it, but more importantly, how they will respond to it.”
– Mike Shell
For a quick update on the Coronavirus COVID – 19 trend, I’ll use my home state of Florida as the example.
The first cases of Coronavirus (COVID-19) were confirmed on March 1st, 2020, which occurred in Manatee and Hillsborough County. During the initial outbreak of Coronavirus in the United States, Florida’s public beaches and theme parks were under scrutiny as being areas of large crowds. Some in the news media criticized Florida for being relatively late in issuing a “Shelter-At-Home” order, finally putting it in place beginning April 3rd, 2020. Cases ramped quickly from 2 on March 4th, to over 5000 by the end of the month. Since then, however, the number of cases in Florida has leveled off, slowing the rate of change.
I focus on the direction of the trend and its rate of change.
The COVID Tracking Project has now tracked 85,826 cumulative Florida Coronavirus cases , up from 82,719 Thursday. This is a change of 3.88%. Here, I show the standard arithmetic scale on the chart.
The concern I see in the above chart is it seems to be forming a rough S-shaped curve. That is, cases trended up though April and May around the same pace, but this month the rate of change is notably stronger in the linear price scale of an arithmetic chart. The arithmetic or linear chart doesn’t illustrate or scale movements in relation to their percent change, but instead, the linear price scale plots price level changes with each unit change according to a constant unit value. So, there is an equal distance between the data points as each unit of a change on the chart is represented by the same movement up the scale, vertical distance, regardless of what the level when the change happened. The arithmetic chart is the standard basic chart, especially over shorter time series, and it shows absolute trends.
To see how the time series unfolds with a focus on percentage of change, we changed the scale to logarithmic. The logarithmic chart is plotted so that two equal percent changes are plotted as the same vertical distance on the scale. Logarithmic scales are better than linear scales for normalizing less severe increases or decreases. Applying a logarithmic scale, the vertical distance between the data on the scale the percent change, so we can better identify changes in rates of change. Here, we see a strong uptrend in March, then the rate of change has since leveled off. The trouble, however, is it is still trending up and at its high.
Florida Coronavirus Tests Administered is at a current level of 1.5 million, which up from 1.486 million the day before, an increase of 1.72%.
COIVD – 19 Deaths have increased 1.4% since Thursday. Deaths are obviously an essential factor to track. Florida Coronavirus Deaths is at a current level of 3,154.00, up from 3,110.00 yesterday.
The steep uptrend in deaths is scary looking using the arithmetic scale showing the absolute trend in cumulative deaths. In the next chart, we observe the same trend as a log scale, which shows the rate of change is in an uptend, but has been slowing. I labeled the highest high (now) and the average over the period for reference.
Florida Coronavirus Hospitalizations is at 12,862, up from 12,673 the prior day, which is a change of 1.49%. To focus on the rate of change, here is the log scale chart.
Keep in mind, my objective here isn’t to rehash the research of others, but instead to share what I see in the trends and rates of change. As such, this isn’t a complete analysis of the virus. It’s my observations, as a quant and trend system developer and operator. The data source is The COVID Tracking Project which can only report the data as provided by the states.
The uptrend in Florida Coronavirus cases per day has indeed continued and with a notable new high.
I don’t like to see an uptrend like this because it’s a virus, and viruses are contagious, so they spread. In the case of Coronavirus, we can get an idea of the speed and rate of spread by the reproductive number (R0), or ‘R-naught’, represents the number of new infections estimated to stem from a single case. The reproductive number (R0) is relatively high, according to a research paper on the CDC: Assuming a serial interval of 6–9 days, we calculated a median R0 value of 5.7 (95% CI 3.8–8.9).
I’m not going into the details here, but, with a reproductive value of 5.7, an increase in new cases is material in my opinion. That is, once it trends up as we are seeing now, it seems more likely to continue.
Are new cases a function of increased testing?
Some say the increase in new cases per day is a result of more testing. That doesn’t seem to be the case. Below is a charge of cases per day with a time series of tests administered per day under it. Visually, we see no correlation. However, there are many caveats to the data. So, anyone who wants to make a cased leaning one way or another can find ways to skew it, but it is what it is. We have a material increase in cases in Florida.
QUANTIATIVE ANALYTICS
Now, we’ll take a deeper dive and apply some analytics to the trends by observing some ratios.
The Florida COVID – 19 Death Rate has been gradually trending down. Florida Coronavirus Death Rate is at 3.67%.
In the past two weeks of May, the death rate was 4.6%, so it is falling.
In our investment management, I’ve been drawing ratio charts for over two decades to determine which market or stocks has greater trend momentum than another. When the numerator (top) is trending stronger than the denominator (bottom value) we say it has stronger relative strength or momentum. In this case, I have used Florida Coronavirus Cases Per Day as the numerator (top value) and Florida Coronavirus Tests Per Day as the denominator (bottom value), which shows a clear uptrend in the cases per day relative to the tests per day. This concerns me because of the rate of spread. As you look at the ratio chart, consider that a value of 0 would mean new cases per day is the same as new tests per day. Instead, new cases is currently trending higher than testing.
Florida cumulative cases relative to tests administered is also showing some change in trend. the past few weeks. Again, not of the date collected is perfect, but it’s still representative of a statistically significant sample of the population.
My objective for trend following is to identify a trend early in its stage to capitalize on it until it changes.
Comparing per day cases to other states doesn’t mean a lot, since the data needs to be normalized. For example, what President Trump said a few weeks ago is a true statement: the number of cases are a function of testing. If we didn’t test and didn’t categorize a case as COVID, there would be no “COVID cases.” Some people, politically motivated, seem to have difficult understanding that simple statement. I’m not politically motivated, so I just say it like it is. With that said, California is winning the match of the most cases per day followed by Texas. Florida is above Arizona.
Again, this doesn’t tell us anything aside from the absolute number. A relative comparison is often necessary and this is an example. For example, we could first calculate per day cases relative to tests or population, then compare them. That’s beyond the scope of my objective today.
Here are the states that reported over 500 new cases. We are seeing some large bubbles in the southwestern United States right now.
The bottom line is, we want to see these levels drifting down, not up. We want to see this trend down.
People who are at high risk should continue to operate according to the risks, but also keep it in perspective that at this point, it isn’t yet so wide spread.
In the big picture, the population in Florida is 22 million and about 86 thousand cases have been labeled COVID 19. 86,0000 out of 22 million is about 4 tenths of a percent, or 0.40%.
That’s 40 cents of $100.
Our changes of contracting COVID 19 in Florida, then, is less than half of 1% at this point.
Everything is relative.
Join 520 other subscribers
Mike Shell is the Founder and Chief Investment Officer of Shell Capital Management, LLC, and the portfolio manager of ASYMMETRY® Global Tactical. Mike Shell and Shell Capital Management, LLC is a registered investment advisor focused on asymmetric risk-reward and absolute return strategies and provides investment advice and portfolio management only to clients with a signed and executed investment management agreement. The observations shared on this website are for general information only and should not be construed as advice to buy or sell any security. Securities reflected are not intended to represent any client holdings or any recommendations made by the firm. Any opinions expressed may change as subsequent conditions change. Do not make any investment decisions based on such information as it is subject to change. Investing involves risk, including the potential loss of principal an investor must be willing to bear. Past performance is no guarantee of future results. All information and data are deemed reliable but is not guaranteed and should be independently verified. The presence of this website on the Internet shall in no direct or indirect way raise an implication that Shell Capital Management, LLC is offering to sell or soliciting to sell advisory services to residents of any state in which the firm is not registered as an investment advisor. The views and opinions expressed in ASYMMETRY® Observations are those of the authors and do not necessarily reflect a position of Shell Capital Management, LLC. The use of this website is subject to its terms and conditions.
Implied volatility, as measured by the CBOE Volatility Index (VIX) has trended up about 50% since the most recent low on June 5th. I’ll call it a moderate volatility expansion. Normally a volatility expansion from 23 to 40 would be considered a material event, but relative to the highest spike we’ve seen in March, it doesn’t seem huge for 2020.
The Bank of America Bull & Bear Indicator is at 0.90 vs. 0.40 last week. It is used as contrarian indicator to identify market extremes in investor sentiment. Currently, their measure of investor sentiment is very bearish, which is bullish for the stock market.
Bank of America Private Client Sentiment shows bearishness, and here is a line chart showing its history.
On the topic of investor sentiment, and the Bank of America Bull & Bear Indicator, here is a chart of its history going back to 2002. As marked on the chart, it was backtested pre-2013.
I share the CNN Fear & Greed Index a lot, because it’s easily assessable, so anyone can view it. The Fear & Greed Index is neutral right now.
Within the Fear & Greed Index are seven different investor sentiment indicators. Unlike the Bank of America Private Client Bull & Bear Indicator, which is a survey of their clients, the Fear & Greed Index is derived from quantitative technical indicators.
Stock price breadth, or how well stocks are participating in the uptrend, is the leading driver on the Greed side. They use the McClellan Volume Summation Index, which measures advancing and declining volume on the NYSE. It shows during the last month, approximately 8.08% more of each day’s volume has traded in advancing issues than in declining issues, pushing this indicator towards the upper end of its range for the last two years, which is extremely bullish.
The only other of the seven indicators showing bullish investor sentiment is safe haven demand. That is, the demand for bonds over stocks. They measure it by the difference between the past 20 day stock and bond returns. Stocks have outperformed bonds by 6.99% during the last 20 trading days. This is close to the strongest performance for stocks relative to bonds in the past two years and indicates investors are rotating into stocks from the relative safety of bonds. Of course, this bullish investor sentiment is a sign that greed is driving the market. Notwithstanding these two extremes, overall, the Fear & Greed Index remains neutral.
Value is a Value
The dispersion of stock valuation multiples between the lowest and highest valuations has narrowed. But, despite the recent relative strength in value, it is still wide relative to history. So, value stocks remain a relative value.
Hot Momentum Stocks are Showing Relative Strength
According to Goldman Sachs, the most popular retail trading stocks have materially outperformed the S&P 500, so far.
Cross-Asset Realized Volatility has been Extreme
Another sign of dispersion is the number of 3 standard deviation prices moves. We’ve already seen more extreme trends across asset classes in 22 years.
Despite the impressive V shaped rally from what is so far the low on March 23rd, I continue to notice the mean reversion year to date and over the past year. Here is year to date, and I marked the high, low, and average percentage.
At the low, the S&P 500 was down about -31% YTD. With the help of a very aggressive Federal Reserve proving liquidity, it has recovered most of the decline in one of the fastest in history.
It ain’t over till it’s over, and this ain’t over.
Asymmetry is about the upside vs. the downside in terms of asymmetric risk/reward. No observation of the price trend is complete without also noting the downside drawdown it took to achieve it. The drawdown for the S&P 500 was an astonishing -34% in just 23 days. It’s a reminder of risk.
I believe risk must be measured, directed, and controlled if we are to compound capital positively.
It doesn’t matter how much the return is if the downside risk is so high you tap out before it’s achieved.
Clearly, in 2020, we’ve surely seen some of the finest examples of risk, divergence, and volatility.
Join 520 other subscribers
Mike Shell is the Founder and Chief Investment Officer of Shell Capital Management, LLC, and the portfolio manager of ASYMMETRY® Global Tactical. Mike Shell and Shell Capital Management, LLC is a registered investment advisor focused on asymmetric risk-reward and absolute return strategies and provides investment advice and portfolio management only to clients with a signed and executed investment management agreement. The observations shared on this website are for general information only and should not be construed as advice to buy or sell any security. Securities reflected are not intended to represent any client holdings or any recommendations made by the firm. Any opinions expressed may change as subsequent conditions change. Do not make any investment decisions based on such information as it is subject to change. Investing involves risk, including the potential loss of principal an investor must be willing to bear. Past performance is no guarantee of future results. All information and data are deemed reliable but is not guaranteed and should be independently verified. The presence of this website on the Internet shall in no direct or indirect way raise an implication that Shell Capital Management, LLC is offering to sell or soliciting to sell advisory services to residents of any state in which the firm is not registered as an investment advisor. The views and opinions expressed in ASYMMETRY® Observations are those of the authors and do not necessarily reflect a position of Shell Capital Management, LLC. The use of this website is subject to its terms and conditions.
People tend to overreact and under-react to new information.
We observe it in the global capital markets more frequently than anywhere, and with immediate feedback.
So, those of us who are adept at identifying and monitoring directional trends in global markets have an advantage in researching trends of all kinds if our quantitative trend methods are robust, and our qualitative judgment and decision-making process is repeatable.
Intellectual skills that are associated with acquiring reliable information about nature are parts of the scientific process. Scientists of all kinds need skills like: communicating, observing, classifying, measuring, predicting, inferring, and researching.
Science isn’t just science, there’s also some art to it. I believe the first skills are more art, such as communicating, observing, classifying.
Many say investing and investment management is both art and a science. Some believe investment management is more art than science, others believe it’s more science than art. Quants try to make it more scientific than artistic.
I do a combination. I am Man + Machine.
The way I look at trends and how time series interact with each other is a robust process that may be applied to anything.
I don’t read articles in Bloomberg or The Wall Street Journal to hear the opinions of others to decide what I believe for myself. When I was a young rookie I did read a lot at first, as we all do, then learned the hard way to focus my efforts on my own original research and thinking.
I do best when I do my own work, as an independent thinker.
So, over the decades as a professional researcher, I first inspect the data to observe any trends and then make sense of it afterward. Sometimes my intention is for predictive analytics, other times it’s just prescriptive. predictive and prescriptive analytics. Predictive analytics provides us with the raw information for making informed decisions, while prescriptive analytics provides us with data-backed, evidence-based decision points that we can weigh against one another.
The scientific method is an empirical method of acquiring knowledge through careful observation, and applying rigorous skepticism about what is observed, realizing how cognitive assumptions and bias can distort how one interprets the observation.
Descriptive Analytics, applying data aggregation and data mining to provide observations andinsight into the past to answer:
“What has happened?”
Predictive Analytics, applying statistical models and probabilistic forecasting methods to understand the future and answer:
“What could happen?”
Prescriptive Analytics, applying simulation and testing algorithms to advise on possible outcomes and answer:
“What should we do?”
The Scientific Method and experimenting is a systematic approach to problem-solving and decision-making.
An algorithm may look something like this:
Problem —> Hypothesis —-> Prediction —-> Test Predictions —> Evaluation
We all have biases. All industries have biases. Sometimes these biases gave blindspots. Our biases that can narrow our vision and influence behavior and beliefs. It’s why in asset management, we often consult with researchers outside the industry to help avoid blind spots from industry bias. For example, the personal financial planning profession has a tendency to blindly say “balance your risks and rewards” and “balance your portfolios”, which is about the silliest things I’ve ever heard.
If you balance your risk and reward, you get symmetry on your statement.
If we want asymmetry, we have to skew the risk and reward positively.
It’s essential to identify blind spots, own them without being defensive, and adjust our behavior to avoid it.
MY OBSERVATIONS OF COVID 19
I have an advantage, because I observe COVID 19 trends and rates of change as it is, without any bias as to beliefs about the disease and such. That is, I’m just purely looking at the data we collect and feed into our systems for observation.
It’s like this:
I focus on; what has changed?
I look for extremes in levels, like new high or low breakouts.
I also monitor the rates of change. Fast breakouts are more likely to form an ongoing trend than slow.
FLORIDA COVID 19 UPDATE
As COVID 19 and the mass quarantine strategy for suppressing the spread has become a political debate lately, so some of you may perceive what you are about to read that way.
Don’t.
I have no political bias about this whatsoever. My personal preference is to get past this virus as quickly as possible with as little human suffering as possible. Ignoring the data and facts doesn’t get us there. Exaggerating the data and facts doesn’t either. So, I suggest you try to see the trends for what they are, as I am.
My home state of Florida is now, unfortunately, trending in the wrong direction. I pointed it out with some fellow money manager friends last week of a potential breakout in the trend and it has since trended higher for a meaningful and material breakout. No one wants businesses to open and get back to normal more than me, but what is, is. The cases per day is in a strong uptrend. The prior high was 1575 on April 3rd and 1601 on May 16th. Yesterday was 2581. I hope to see this trend down.
NEW UPTREND IN FLORIDA CASES NOT DRIVEN BY NEW TESTING
The first hypothesis we think of is, well, maybe the uptrend in driven by an increase in testing. Naturally, increasing the absolute testing also should increase the number of positive tests. That isn’t the case. The high in testing was May 20th in Florida. The testing per day remains materially below that level according to the most recent data.
Keep in mind, the lower line is tests administered per day, so there is a lag between testing and the classification of a positive case. In fact, there are natural lags in all of this data. For example, I don’t expect to see the results of the protests until a week or two afterward to account for the lag in showing symptoms, going to get tested, and getting the test results. If there is any increase in the protesting areas, we’ll hear about it next week or later.
FLORIDA COVID 19 HOSPITALIZATIONS AT AN ALL TIME HIGH
Not much to add here. It is what it is.
I can try to make it seem better with a logarithmic based chart, which draws the chart in a way that two equal percent changes are plotted as the same vertical distance on the scale. It visually normalizes the rate of change. The good news is the rate of change overall is slowing. The bad news is this could look like an S-curve later, which would be typical of a spread.
By the way, here is the log chart of the new cases per day. We normally use a logarithmic chart scale for long term charts to normalize the data especially if I’m comparing it to something else where relative strength (rate of change) is measured. But here, we still see a breakout in rate of change. So, it’s a material breakout in my opinion, but I hope it breaks down.
Unfortunately, three of the new uptrends are in states were we have clients; Florida, California, and Texas. Next up is Texas.
TEXAS COVID 19 UPTREND
New cases in Texas is trending up to all time highs. I think Houston, Texas is now at risk of another stay-at-home order.
CALIFORNIA COVID 19 TREND
California new cases per day has trended up to the all time high again. It doesn’t seem to be in direct result of more testing per day, either.
ARIZONA COVID 19 CASES AT NEW HIGH
Arizona is at a high in new daily cases reported, but also in tests per day. The trouble in Arizona is the material new uptrend in hospitalizations.
The momentum in hospitalizations in Arizona is a real problem, and I’m using a logarithmic scale below, but it doesn’t help.
So, we are seeing new hospitalization highs in Texas, Arizona, and North Carolina. We’re showing Louisiana here as well for context, since it had an early COVID-19 outbreak.
We saw 3 states report more than 2,000 cases yesterday: California, Florida, and Texas. A picture speaks a thousand words.
COVID HAS HIT THE NORTH MUCH HARDER THAN THE SOUTH
But the South is now seeing a surge in cases…
And it doesn’t seem to be an increase in testing.
Can hospitalizations keep falling if cases are rising?
Because hospitalizations are rising rapidly in some Southern states.
I expect we’ll be hearing a lot about these new high breakouts in Arizona, Florida, Texas, and California. All of which, by the way, are the hottest and most humid states in the U.S., so much for the heat and humidity killing the virus.
What we have here is, a a notable uptrend across the South. I hope to see it fade, but based on what I’m seeing, it’s more likely to continue. Only time will tell.
If you are at risk, I recommend remaining cautious, wearing the dang mask, and treating this virus with respect.
Join 520 other subscribers
Speaking of the scientific method used for decision-making.
If you want to get as technical as possible, here’s some homework for the wannabe scientists and armchair mathematicians who really want to get into the maths of the matter. The virus has sparked a lot of important debates around the globe among though leaders. As researchers, we argue and debate our beliefs in hopes to gain new knowledge. One of the most heated public debates has been Taleb and Ioannidis.
The International Journal of Forecasting (IJF) is organizing a special section devoted to “Epidemics and forecasting with focus on COVID-19”. Based on their blog posts, John P. Ioannidis and Nassim N. Taleb will be given the opportunity to think of each other’s arguments about the COVID data and how to use it. Consequently, they will both be invited to write a full paper to better detail their views and why they think the opposite side’s views may not be adequate under the current circumstances. These opinion papers will then appear in the IJF, after scientific review by their peers. IJF should reserve the right to publish a closure based on this debate. This debate will not only allow us to better understand the points of view of the two great scientists but be also left as a guide for how to deal with future pandemics.
Nassim N. Taleb believes that all efforts and resources should be directed to halt its spread and reduce the number of infected and deaths without any concern about forecasting its future course as the uncertainty of doing so cannot be measured and the risks involved are highly asymmetric. See “On single point forecasts for fat tailed variable by Nassim Nicholas Taleb.”
John P. Ioannidis, on the other hand, claims that more reliable information is needed to make multiple billion-dollar decisions and that forecasting has failed us by being too pessimistic about the future growth of the pandemic and by exaggerating its negative effects. See “Forecasting for COVID-19 has failed”
Both of their observations are well worth a read.
In addition to the equity markets entering a higher risk level of a drawdown and volatility expansion, we now have a renewed risk of the scary COVID narrative driving more fear.
Mike Shell is the Founder and Chief Investment Officer of Shell Capital Management, LLC, and the portfolio manager of ASYMMETRY® Global Tactical. Mike Shell and Shell Capital Management, LLC is a registered investment advisor focused on asymmetric risk-reward and absolute return strategies and provides investment advice and portfolio management only to clients with a signed and executed investment management agreement. The observations shared on this website are for general information only and should not be construed as advice to buy or sell any security. Securities reflected are not intended to represent any client holdings or any recommendations made by the firm. Any opinions expressed may change as subsequent conditions change. Do not make any investment decisions based on such information as it is subject to change. Investing involves risk, including the potential loss of principal an investor must be willing to bear. Past performance is no guarantee of future results. All information and data are deemed reliable but is not guaranteed and should be independently verified. The presence of this website on the Internet shall in no direct or indirect way raise an implication that Shell Capital Management, LLC is offering to sell or soliciting to sell advisory services to residents of any state in which the firm is not registered as an investment advisor. The views and opinions expressed in ASYMMETRY® Observations are those of the authors and do not necessarily reflect a position of Shell Capital Management, LLC. The use of this website is subject to its terms and conditions.
“I still had much to learn, but I knew what to do. No more floundering, no more half-right methods. Tape reading was an important part of the game; so was beginning at the right time; so was sticking to your position. But my greatest discovery was that a man must study general conditions, to size them so as to be able to anticipate probabilities.” – Jesse Livermore, Reminiscences of a Stock Operator, by Edwin Lefèvre, first published in 1923.
The US stock market is now at risk of another decline
First, the relative strength of the S&P 500 has reached a level I consider overbought for the first time since the crash.
is a momentum oscillator that measures the speed and magnitude of directional price trends. The RSI oscillates between zero and 100, so it is range bound.I The RSI is defined as overbought when it reaches 70 or higher and oversold below 30.
Another useful measure of market trend conditions is breath. The percent of S&P 500 stocks above their 50 day moving average shows us how many stocks are participating in the uptrend. Since June 1st, 97% of the stock are trending above their 50 day moving average, so they are in short term uptrends.
Strong breadth of participation is a good thing, until it reaches an extreme. A breath thrust as we saw begin the start in April was a good sign as the stock market was trending up, more and more stocks were entering uptrends. However, once all of the stocks are already in uptrends, we eventually have to wonder what is going to keep driving them higher.
Much of investment management is an understanding of what other market participants are likely to do next. When I see the percent of SPX stocks above their 50 day moving average at the highest level in twenty years, it simply tells us most of the stocks are in short term uptrends, but, the next direction for buying enthusiasm is going to be down.
On a longer term time frame, which is the 200 day moving average, only about 60% of the S&P 500 stocks are in longer term uptrends, so there is plenty of room for continuation.
Next up is the good ole NYSE Bullish Percent.
The NYSE Bullish Percent was the first breadth indicator. The NYSE Bullish Percent was developed by Abe Cohen, the founder of Investors Intelligence in 1955. Abe Cohen was an early pioneer of point & figure charting , which he believed provided the ideal building blocks for a market barometer. By recording stock prices, P&F charts effectively map out the relationship between demand (buyers) and supply (sellers). The advantage of P&F charts is the supply/demand asymmetries are clear cut and easy to identify:
If demand outstrips supply, a P&F buy signal is generated
If supply outstrips demand a P&F sell signal is generated.
The Bullish Percent, then, is a breadth indicator that shows the percentage of stocks on Point & Figure Buy Signals. As with other oscillators, the Bullish Percent Index is range bound and fluctuates between 0% and 100%. In its most basic form, the Bullish Percent Index favors the bulls when above 50% and the bears when below 50%. Bullish Percent is considered overbought and a higher risk zone when above 70% and oversold and a lower risk level when below 30%.
At the current reading of 83, it’s clearly in the “high risk” zone.
So, I wouldn’t be surprised to see this uptrend at least stall here, temporarily.
If we’re going to see a second leg down, this is where I believe it will start.
The Federal Reserve is fully committed to keeping this trend going, so we’ll see…
Risk management is essential for all investments because all investments have a risk of loss.
As a tactical decision to reduce our exposure to loss in response to the elevated risk levels I’m seeing, I sold to take profits on our remaining stock positions on Tuesday and invested in US Treasuries.
“But my greatest discovery was that a man must study general conditions, to size them so as to be able to anticipate probabilities. ”
– Jesse Livermore, Reminiscences of a Stock Operator, by Edwin Lefèvre, first published in 1923.
Mike Shell is the Founder and Chief Investment Officer of Shell Capital Management, LLC, and the portfolio manager of ASYMMETRY® Global Tactical. Mike Shell and Shell Capital Management, LLC is a registered investment advisor focused on asymmetric risk-reward and absolute return strategies and provides investment advice and portfolio management only to clients with a signed and executed investment management agreement. The observations shared on this website are for general information only and should not be construed as advice to buy or sell any security. Securities reflected are not intended to represent any client holdings or any recommendations made by the firm. Any opinions expressed may change as subsequent conditions change. Do not make any investment decisions based on such information as it is subject to change. Investing involves risk, including the potential loss of principal an investor must be willing to bear. Past performance is no guarantee of future results. All information and data are deemed reliable but is not guaranteed and should be independently verified. The presence of this website on the Internet shall in no direct or indirect way raise an implication that Shell Capital Management, LLC is offering to sell or soliciting to sell advisory services to residents of any state in which the firm is not registered as an investment advisor. The views and opinions expressed in ASYMMETRY® Observations are those of the authors and do not necessarily reflect a position of Shell Capital Management, LLC. The use of this website is subject to its terms and conditions.
I’m sure there will be no shortage of criticism of the models attempting to predict things like hospital resource us such as the COVID-19 Projections from Institute for Health Metrics and Evaluation (IHME) that were widely used. The model had many assumptions, as any model would, and sometimes models get it wrong. Keep in mind, this model assumed social distancing, too, so it wasn’t a model misbehaving from our success in flattening the curve.
Below is an image I saved on April 11th, already showing Florida hospital resource use was improving.
Here it is today. Their educated guesses overestimated resource use, though it wasn’t a big surprised to me, since I paid attention to the wide range of possibilities they illustrated.
How inaccurate were they?
On March 27, 2020 the projected infections was 259, 204, but the confirmed infections was 16,576.
The brown line at the bottom is the confirmed infections, the higher line is their projections.
COVID – 19 isn’t over.
It’s still spreading, but not nearly as they predicted.
Mike Shell is the Founder and Chief Investment Officer of Shell Capital Management, LLC, and the portfolio manager of ASYMMETRY® Global Tactical. Mike Shell and Shell Capital Management, LLC is a registered investment advisor focused on asymmetric risk-reward and absolute return strategies and provides investment advice and portfolio management only to clients with a signed and executed investment management agreement. The observations shared on this website are for general information only and should not be construed as advice to buy or sell any security. Securities reflected are not intended to represent any client holdings or any recommendations made by the firm. Any opinions expressed may change as subsequent conditions change. Do not make any investment decisions based on such information as it is subject to change. Investing involves risk, including the potential loss of principal an investor must be willing to bear. Past performance is no guarantee of future results. All information and data are deemed reliable but is not guaranteed and should be independently verified. The presence of this website on the Internet shall in no direct or indirect way raise an implication that Shell Capital Management, LLC is offering to sell or soliciting to sell advisory services to residents of any state in which the firm is not registered as an investment advisor. The views and opinions expressed in ASYMMETRY® Observations are those of the authors and do not necessarily reflect a position of Shell Capital Management, LLC. The use of this website is subject to its terms and conditions.
Today’s jobs report is a mighty fine example of the market responding to positive rates and change and surprise.
The US Unemployment Rate measures the percentage of total employees in the United States that are a part of the labor force, but are without a job.
It is one of the most widely followed indicators of the health of the US labor market and the US economy as a whole. Historically, the US Unemployment Rate reached as high as 10.80% in 1982 and 9.9% in November of 2009. Both of these times were notable recessionary periods.
That is, until COVID – 19 came along.
We saw a 14.7% unemployment rate in April in the United States of America. A stunning increase from such a low level in February of 3.5%. The unemployment rate had been declining, for example, it was 5.3% five years ago.
After today’s jobs report, the US Unemployment Rate is at 13.3%, compared to 14.7% last month and 3.6% last year. It’s still nearly three times higher than the long term average of 5.75%, but a lot better than Wall Street had expected.
Wall Street expected a loss of 7.7 million jobs and a 19.8% unemployment rate today.
Bloomberg emailed sent out at 7AM this morning:
So, and Unemployment Rate at 13.3% is a huge positive surprise.
Some independent economist are already disputing the numbers.
The jobs report, as an aside, was again skewed by reporting irregularities. Not just that, the payroll pop seems to reflect businesses re-hiring so as to get the PPP loans switched to grants. So put away that champagne!
“And May’s unemployment number may be higher when it’s announced on June 5.
The stock market is said to be a discounting mechanism. The largest stock market investors who drive price trends don’t look back, they look forward.
It’s an auction market and operates on the proposition that investors and traders gaze into the future and discounts all known information about the present moment and expectations for what’s expected to happen next. So, when unexpected events happen, the market takes into account this new information very rapidly.
It certainly seems to be happening now.
Either the market is factoring in a quick recovery, or something else is driving it up.”
I think it’s safe to say the market has indeed gazed into the future and discounted a sharp recovery.
Yes, it certainly seems overly optimistic, but what is, is.
Notwithstanding a second wave of COVID-19 that hits even harder than the first, Wall Street seems to be pricing in the worst is behind for the U.S. economy.
What’s next?
It’s been a radical year. What else should we have expected out of 2020.
We’ve got to have some fun with it.
Did we skip the murder hornets? it feels like we skipped the murder hornets. 🧐 🐝
The US stock market will probably trend up today and reach an overbought level for the first time since January.
Remember: The market discounts the future, meaning it prices in future expectations. This discounting mechanism goes both ways.
The market is people. It’s large investors and small, but the largest investors drive the trends. It’s institutional investors managing money for others that are more advanced about gazing into the future.
Above all else, when it comes to forecasting or now casting a future trend, getting a grasp of what the majority of the market is thinking and doing is essential.
My guess is, the market has factored in the extremely aggressive response from the Federal Reserve and US Treasury to provide liquidity after it evaporated in March.
I know it’s very hard to go with the flow. Who would have believed this -37% decline would have recovered as much as it has so quickly?
No one.
But, it ain’t over till it’s over.
We have a new problem now.
The relative strength of stock indexes just tapped the overbought level, so the risk of a fall is now higher than it has been since this uptrend started.
Semper Gumby.
Mike Shell is the Founder and Chief Investment Officer of Shell Capital Management, LLC, and the portfolio manager of ASYMMETRY® Global Tactical. Mike Shell and Shell Capital Management, LLC is a registered investment advisor focused on asymmetric risk-reward and absolute return strategies and provides investment advice and portfolio management only to clients with a signed and executed investment management agreement. The observations shared on this website are for general information only and should not be construed as advice to buy or sell any security. Securities reflected are not intended to represent any client holdings or any recommendations made by the firm. Any opinions expressed may change as subsequent conditions change. Do not make any investment decisions based on such information as it is subject to change. Investing involves risk, including the potential loss of principal an investor must be willing to bear. Past performance is no guarantee of future results. All information and data are deemed reliable but is not guaranteed and should be independently verified. The presence of this website on the Internet shall in no direct or indirect way raise an implication that Shell Capital Management, LLC is offering to sell or soliciting to sell advisory services to residents of any state in which the firm is not registered as an investment advisor. The views and opinions expressed in ASYMMETRY® Observations are those of the authors and do not necessarily reflect a position of Shell Capital Management, LLC. The use of this website is subject to its terms and conditions.
As the U.S. unemployment rate in April 2020 was 14.7%, the highest since the Great Depression, the U.S. stock market is trending up.
And May’s unemployment number may be higher when it’s announced on June 5.
The stock market is said to be a discounting mechanism. The largest stock market investors who drive price trends don’t look back, they look forward.
It’s an auction market and operates on the proposition that investors and traders gaze into the future and discounts all known information about the present moment and expectations for what’s expected to happen next. So, when unexpected events happen, the market takes into account this new information very rapidly.
It certainly seems to be happening now.
Either the market is factoring in a quick recovery, or something else is driving it up.
The Efficient Markets Hypothesis (EMH) is based on the theory that the stock market is a very efficient discounting system, so it factors in expectations of the future. The Efficient Markets Hypothesis suggests the stock market generally moves in the same direction as the economy.
Yeah, I know. If there ever was a time that sounds silly it’s now. Well, and every other market crash and bubble. I’ve seen my fair share of those in the past two decades.
One of the most interesting paradoxes in investment management is the market discounts everything is also the first premise of Technical Analysis.
The three premises on which the technical approach is based:
Market action discounts everything.
Prices move in trends.
History repeats itself.
That both the Efficient Markets Hypothesis and Technical Analysis is based on the belief the market discounts everything known and expected about the future is logically self-contradictory, because EMH doesn’t believe prices move in trends. EMH certainly doesn’t believe Technical Analysis, including trend identification systems for trend following and pattern recognition, is useful. Yet, trend systems and pattern recognition are some of the very strategies that I’ve seen to achieve asymmetric risk-reward.
I consider most trend identification systems to be pattern recognition. Pattern recognition is the systematic recognition of patterns in data. For example, the first action in trading breakouts is to identify current price trend patterns along with potential support and resistance levels in order to signal entry and exit points.
So, here we are. The S&P 500 is now trading above its 200 day moving average again after trending below it on February 27th.
It has been shocking to most that the stock index is now only down about -10% from its February high after a -36% waterfall decline over just 23 trading sessions.
It the fastest waterfall we’ve seen of this magnitude, so maybe we shouldn’t be surprised to see it swing back up to recover 2/3rds of the decline.
But no, it’s not a surprise. I tactically traded through the last two most radical bear markets since the Great Depression and they both included many swings up and down along the way.
The swings are the danger.
If you wait too long and enter after prices have already trended up sharply, you may get invested in stocks just in time for the next trend down.
The same goes for the downside. If you wait until your losses are so large they become intolerable and tap out at the lows, you risk missing out on the price trend recovery like we just saw.
At what point do you feel good about geting back in?
After prices have trended back up as they have now? The S&P 500 is above the 200 day moving average, so it’s a sign of an uptrend.
Is this the time to buy?
Or, do you feel better about investing in stocks after the price trend falls more?
What if it doesn’t?
These are tactical trading decisions. Most investors are not good at it, but some of us are better.
The market is people who trade and invest in the market. People are always looking forward, gazing into the future that doesn’t yet exist, so prices are always adjusting according to people’s beliefs about what’s going to happen next. This includes all signals. All signals are necessarily predictions of the future.
As the SPX is now trending above its 200-day average, trend followers who use the SMA will buy here. We may indeed see some buying interest come in because of it. Only time will tell if its enough buying pressure to drive prices up more. I’ve been operating trend systems for decision-making for over two decades and I don’t know of any money manager who actually trades off a 200-day moving average signal, except one. I’m going to save it for another observation, but until then, I’ll simply share this.
The S&P Trend Allocator Index is designed to track the performance of a systematic trend-following strategy allocating between the S&P 500 and cash, based on price trends. If the S&P 500 is observed to be in a positive trend, then the index is allocated to the S&P 500, otherwise, it is allocated to cash.
Here is the S&P Trend Allocator Index relative to the S&P 500 stock index which is fully invested, all the time.
Oops.
Prior to the waterfall decline, the S&P 500 was trending 11% higher than its 200 day moving average. So, it was going to have at least a -11% drawdown with perfect execution. That’s a nice thing about it. It’s a predefined exit, so at the February high, you knew if the stock market falls, you’ll lose at least -11% before you exit. When we know our defined risk, we can decide to accept it, or not. If you were trading off the 200 SMA and believed a -11% drawdown was unacceptable, you could have raised your stop above it.
But then, if you sold earlier, how would you know when to get back in?
Ok, I just wanted to drive home the point: tactical trading decisions aren’t easy. No indicator works perfectly.
I don’t use the 200 SMA, but the S&P Trend Allocator index does. However, you may notice it didn’t sell at the price trend break below the 200 SMA. Instead, it sold later, and down much more. The S&P Trend Allocator Index sold later because it waits until five days after a crossover to sell. I marked on the chart the point on the price trend it actually sold.
“At the close of each business day, a trend signal is calculated based on the closing value of the S&P 500 Total Return Index (the “Allocation Indicator Index”) compared to its prior 200-day Simple Moving Average (SMA). The SMA is defined as the average of the last 200 closing values of the S&P 500 Total Return index. The trend signal is positive if thelast five consecutive closing values of the S&P 500 Total Return index are equal to or greater than the SMA. The trend is negative if the last five consecutive closing index values are below the SMA. The trend signal does not change from its current status until there have been five consecutive days of index values indicating a signal change.”
I’m not going to get any deeper on this right now, but I will in a later observation, but the drawdown in the S&P Trend Allocator Index was about -27%.
Keep in mind; an index does not include any transaction cost or fees and may not be invested indirectly. If we were applying this trend following method with real money, there would have been transition costs, fund fees, advisory fees, and slippage to account for which would have negatively impacted the return profile. With that said…
Should we care that the S&P 500 is above its 200-day simple moving average?
Since the index was operated in real-time, above is the total return relative to its S&P 500 stock index which is fully invested in stocks all the time.
Here is the drawdowns for a complete picture of its risk-reward profile.
As you see, the S&P Trend Allocator applying the 200-day moving average to the S&P 500 had a drawdown of -27% vs. the -34% drawdown of the S&P 500.
So, the risk management method of the S&P Trend Allocator provided a drawdown control edge of about 7% relative to the fully invested stock index that is exposed to the risk and reward of the stocks all the time.
However, the total return is materially less at this point. Although the S&P Trend Allocator 200 day SMA exit signal exits with a lag and then reenters with a lag, it has participated in most of the stock market drawdowns and then misses out on the early part of its gains off the lows when the rate of change is highest.
It will take a larger downtrend for the 200 day SMA to show its value. The magnitude of the March decline was tremendous, but it happened so fast the lag was exposed as a risk to the strategy.
Now, just imagine how the risk/reward profile will be impacted if it enters the stock market right now, and then the market trends down again. This is one of the risks to be aware of with any trend-following or tactical trading system or method.
No investment strategy is ever perfect, but we gain an edge when we are aware of their weaknesses. I have spent more time trying to break my systems and methods to discover weaknesses than I did creating them.
Join 520 other subscribers
Mike Shell is the Founder and Chief Investment Officer of Shell Capital Management, LLC, and the portfolio manager of ASYMMETRY® Global Tactical. Mike Shell and Shell Capital Management, LLC is a registered investment advisor focused on asymmetric risk-reward and absolute return strategies and provides investment advice and portfolio management only to clients with a signed and executed investment management agreement. The observations shared on this website are for general information only and should not be construed as advice to buy or sell any security. Securities reflected are not intended to represent any client holdings or any recommendations made by the firm. Any opinions expressed may change as subsequent conditions change. Do not make any investment decisions based on such information as it is subject to change. Investing involves risk, including the potential loss of principal an investor must be willing to bear. Past performance is no guarantee of future results. All information and data are deemed reliable but is not guaranteed and should be independently verified. The presence of this website on the Internet shall in no direct or indirect way raise an implication that Shell Capital Management, LLC is offering to sell or soliciting to sell advisory services to residents of any state in which the firm is not registered as an investment advisor. The views and opinions expressed in ASYMMETRY® Observations are those of the authors and do not necessarily reflect a position of Shell Capital Management, LLC. The use of this website is subject to its terms and conditions.
The CBOE Volatility Index (VIX) estimates expected volatility by aggregating the weighted prices of S&P 500 Index (SPX) puts and calls over a wide range of strike prices. Specifically, the prices used to calculate VIX Index values are midpoints of real-time SPX option bid/ask price quotations.
CBOE Volatility Index (VIX) has averaged 33 this year with a low of 12 and high of 83.69, the highest implied volatility has ever been.
The VIX futures curve is in contango about 80% of the time and normally goes into backwardation in stressed markets.
VIX is a gauge of expected future volatility and VVIX is the vol of VIX. Both suggest a lower future vol. We’ll see.
The VVIX is drifting down relative to VIX the past five days.
Forecasts of volatility for stocks are valuable for investors as a measure of traders’ uncertainty about a stock or index price. With VIX we can quickly gauge the future expectation for volatility priced by options. If it’s a “fear gauge”, it’s indicating less fear.
The CBOE Index Put/Call Ratio is back to its long term average. I believe index options are mostly traded by fund managers for hedging.
The CBOE Index Put/Call Ratio is just under its one year average. It was about 0.70 before the March waterfall decline.
CBOE Equity Put/Call Ratio is trending toward the low level was saw before the waterfall decline in March. A falling put-call ratio, or a ratio less than 1, means that traders are buying fewer puts than calls. It suggests that bullish sentiment is building in the market.
CBOE Equity Put/Call Ratio drifting down to 0.50 may be an early warning sign the market is becoming complacent.
Since I believe index options are mostly used by money managers for hedging, I consider its level around average to be normal. But I believe equity options are traded more by speculators, so it may be the earlier gauge of a shift in sentiment.
I was talking volatility trading with someone recently when it occurred to me I was learning Lotus 1-2-3 for advanced accounting in the 90s when I first started exploring volatility and VIX indexes. So, I’ve been observing the volatility profile a long time.
I wouldn’t be surprised to see another volatility expansion before we see implied volatility back down dow 20 or lower.
Another useful way I like to illustrate the volatility contractions and expansions to clients is a volatility channel. In the chart I used two standard deviations from the 20 day moving average around the S&P 500 price trend to show an upside breakout known as Bollinger Bands. The chart below is is the width of the bands, which is a good illustration of the volatility expansion and contraction the past two months.
Periods of volatility contractions are eventually followed by volatility expansions.
Join 520 other subscribers
Mike Shell is the Founder and Chief Investment Officer of Shell Capital Management, LLC, and the portfolio manager of ASYMMETRY® Global Tactical. Mike Shell and Shell Capital Management, LLC is a registered investment advisor focused on asymmetric risk-reward and absolute return strategies and provides investment advice and portfolio management only to clients with a signed and executed investment management agreement. The observations shared on this website are for general information only and should not be construed as advice to buy or sell any security. Securities reflected are not intended to represent any client holdings or any recommendations made by the firm. Any opinions expressed may change as subsequent conditions change. Do not make any investment decisions based on such information as it is subject to change. Investing involves risk, including the potential loss of principal an investor must be willing to bear. Past performance is no guarantee of future results. All information and data are deemed reliable but is not guaranteed and should be independently verified. The presence of this website on the Internet shall in no direct or indirect way raise an implication that Shell Capital Management, LLC is offering to sell or soliciting to sell advisory services to residents of any state in which the firm is not registered as an investment advisor. The views and opinions expressed in ASYMMETRY® Observations are those of the authors and do not necessarily reflect a position of Shell Capital Management, LLC. The use of this website is subject to its terms and conditions.
It’s essential to make observations about the big picture to see what is going on, since the longer trends eventually have an impact on shorter trends.
Before March, the US economy was in the longest economic expansion on record. It was aged, to say the least. I pointed out several times the past year unemployment was at an all time historic low at 3% or so.
Now it’s 14.7%.
The stock market was in the longest bull market, ever. An uptrend in stocks is usually around 4-5 years before being interrupted by a -20% bear market decline.
This time it was 11 years.
Before March, I had been pointing out the S&P 500 was the second highest valuation going back over 140 years, according to Shiller.
The S&P 500 Shiller CAPE Ratio, also known as the Cyclically Adjusted Price-Earnings ratio, is defined as the ratio the the S&P 500’s current price divided by the 10-year moving average of inflation-adjusted earnings. The metric was invented by American economist Robert Shiller and has become a popular way to understand long-term stock market valuations. It is used as a valuation metric to forecast future returns, where a higher CAPE ratio could reflect lower returns over the next couple of decades, whereas a lower CAPE ratio could reflect higher returns over the next couple of decades, as the ratio reverts back to the mean.
Even after the S&P 500 stock index declined -34%, the S&P 500 Shiller CAPE Ratio is at a current level of 25.88, down from its 33.31 high in January 2018, but far from an undervalued level. In fact, it has so far just reverted to its 10 year average.
Long term bull markets have historically started at low levels, like 10. Bull markets historically end at high valuation levels, such as around 20. It’s far from a science and not a good market timing indicator. But, it helps us to understand the big picture risks/rewards. From a high starting point, we shouldn’t expect to see high capital gains from passive indexing.
Here is S&P 500 Shiller CAPE Ratio going back before 1900 to put it into context.
Even though the price to earnings ratio has fallen as the price fell, it isn’t anywhere near what we consider undervalued.
So, it is what it is.
If this is the early stage of a bigger bear market, it has plenty of room to fall before become “undervalued” and this may explain why
On Twitter today was some concern about the famous value investor Warren Buffett isn’t buying stocks. Instead, he’s selling stocks.
“Is it meaningful that Buffett has $137 billion in cash and $40 billion yearly in cash flows to deploy in Berkshire $BRK.B and he’s worried it might not be enough?”
I read the letters and don’t recall him ever selling as prices fall.
Buffett is famous for buying stocks when others are panicking. But, he isn’t, et. The simple answer is the stock market in general remains at 25 times earnings by the Shiller measure, and it reached the lower teens in March 2009 and single digits before that before another secular bull market occurred.
Prices have to reach a low enough level to attract buying demand. As of now, we’re seeing it happened in March, considering the gains since the March 23rd low.
But, it looks like prices may have to fall a lot more before big value investors like Buffett get more invested.
An investment manager like me has much more flexibility. I’m far more quick and nimble, so I can make tactical decisions and then change my mind with liquidity.
If no buyers are willing and able to enthusiastically buy the stocks and bonds we’re selling, especially because we have to much of it, then;
oops.
Semper Gumby.
Always Flexible.
Mike Shell is the Founder and Chief Investment Officer of Shell Capital Management, LLC, and the portfolio manager of ASYMMETRY® Global Tactical. Mike Shell and Shell Capital Management, LLC is a registered investment advisor focused on asymmetric risk-reward and absolute return strategies and provides investment advice and portfolio management only to clients with a signed and executed investment management agreement. The observations shared on this website are for general information only and should not be construed as advice to buy or sell any security. Securities reflected are not intended to represent any client holdings or any recommendations made by the firm. Any opinions expressed may change as subsequent conditions change. Do not make any investment decisions based on such information as it is subject to change. Investing involves risk, including the potential loss of principal an investor must be willing to bear. Past performance is no guarantee of future results. All information and data are deemed reliable but is not guaranteed and should be independently verified. The presence of this website on the Internet shall in no direct or indirect way raise an implication that Shell Capital Management, LLC is offering to sell or soliciting to sell advisory services to residents of any state in which the firm is not registered as an investment advisor. The views and opinions expressed in ASYMMETRY® Observations are those of the authors and do not necessarily reflect a position of Shell Capital Management, LLC. The use of this website is subject to its terms and conditions.
And just like that, we have another volatility expansion.
Yesterday, in Global Macro: Volatility expands and divergence between sectors I suggested “It is likely we’ll see a volatility expansion from here.” Indeed, with the VIX and VVIX (volatility of volatility) both up 10% today, we are entering a volatility expansion.
Implied volatility had settled down gradually since it peaked in March, but it now looks like we may see prices spread out into a wider range.
As of this moment, the S&P 500 is down -2.34% and it is reversing down from the average of its price trend year to date, so I’ll call it “mean reversion.”
In fact, it’s mean reversion from the 1 year price trend, too.
It’s a negative sign that small and mid size stocks are trending down even more, down nearly -4%. They’ve been laggards in this rally from the March low. In the early stage of a new bullish trend, smaller companies should trend up faster. Smaller companies are more nimble than large companies, so we expect to see them recover quicker from declines. When they don’t, we consider it a bearish divergence.
I can’t say I’m surprised. This is likely the early stage of a deeper bear market as I’ve operated through 2000-03 and 2007-09.
But, nothing is ever a sure thing. It’s probabilistic and probably necessarily implies uncertainty.
Managing money though a big bear market isn’t as simple as an ON/OFF switch, whereby we get out near the peak and then reenter near the low. I’ve traded through a lot of nasty market conditions, the nastiest aside from the Great Depression, and that isn’t how it has worked for me. I didn’t just get out and then back in a year or two later. There are opportunities in between for skilled tactical traders who are able to direct and control risk and manage drawdowns.
There’s a good chance this becomes a prolonged bear market similar to what we’ve seen twice over the past two decades I’ve been a professional money manager.
I wrote yesterday;
“It’s probably a good time for individual investors who don’t have tight risk management systems to shift to defense to preserve capital, but it’s not a guarantee, and yes, we’ll see.”
I’ll just leave it at that, today.
Join 520 other subscribers
Mike Shell is the Founder and Chief Investment Officer of Shell Capital Management, LLC, and the portfolio manager of ASYMMETRY® Global Tactical. Mike Shell and Shell Capital Management, LLC is a registered investment advisor focused on asymmetric risk-reward and absolute return strategies and provides investment advice and portfolio management only to clients with a signed and executed investment management agreement. The observations shared on this website are for general information only and should not be construed as advice to buy or sell any security. Securities reflected are not intended to represent any client holdings or any recommendations made by the firm. Any opinions expressed may change as subsequent conditions change. Do not make any investment decisions based on such information as it is subject to change. Investing involves risk, including the potential loss of principal an investor must be willing to bear. Past performance is no guarantee of future results. All information and data are deemed reliable but is not guaranteed and should be independently verified. The presence of this website on the Internet shall in no direct or indirect way raise an implication that Shell Capital Management, LLC is offering to sell or soliciting to sell advisory services to residents of any state in which the firm is not registered as an investment advisor. The views and opinions expressed in ASYMMETRY® Observations are those of the authors and do not necessarily reflect a position of Shell Capital Management, LLC. The use of this website is subject to its terms and conditions.
Implied volatility is mean revering in some ways. Volatility expands and contracts, so it oscillates between a higher level an a lower range.
I was monitoring various measures of volatility, such as the CBOE Implied Volatility Index as my systems were indicating a potential short term trend change.
Sure enough, at the end of the trading day, VIX expanded 20%.
Over the year to date time frame, VIX has reverted to its mean.
It is likely we’ll see a volatility expansion from here.
The VIX is implied volatility, which is its the expected vol over the next 30 days for the S&P 500 stocks. More specifically, a VIX of 33 implies a 2% range over the next 30 days. That’s less than half what it was in March with the VIX at 80, it implied a 5% range in prices. Still, investors have gotten used to a VIX around 12 or lower in recent years, except for the occasional volatility expansions. Over the past decade, the bull market presented an average VIX of 17.45, which is materially lower than the long term average of 19.36. At a 17 vol, the implied vol is around 1% a month.
The VIX isn’t always right. Implied vol is calculated based on the options prices of the S&P 500 stocks. It’s a forward looking expectation, as opposed to a rear view looking historical actual volatility, such as standard deviation.
The VIX of VIX (VVIX) is a measure of the volatility of the VIX. The CBOE’s VIX measures the short-term volatility of the S&P 500, and the VVIX measures the volatility of the price of the VIX. So, we call it the VIX of VIX, or the vol of vol.
VVIX gained 10% today, too, signaling a vol expansion.
All of this is coming at at time when my systems are showing a declining rate of change over the past month. The initial thrust off the March 23rd low had momentum, but since then the rate of change has been slowing. It’s running out of steam, or velocity.
Don’t fight the Fed
My systems monitor thousands of macroeconomic data and programmed to let me know what has changed. Macroeconomics is an observation of the entire economy, including the growth rate, money and credit, exchange rates, the total amount of goods and services produced, total income earned, the level of employment of productive resources, and the general behavior of prices.
I know, sounds exhausting. It is, unless you have a computerized quantitate systems to do it with perfection.
Looking at global macroeconomics, the Fed balance sheet is a key right now.
The H.4.1 from the Federal Reserve is a weekly report which presents a balance sheet for each Federal Reserve Bank, a consolidated balance sheet for all 12 Reserve Banks, an associated statement that lists the factors affecting reserve balances of depository institutions, and several other tables presenting information on the assets, liabilities, and commitments of the Federal Reserve Banks.
US Total Assets Held by All Federal Reserve Banks is the total value of assets held by all the the Federal Reserve banks. This can include treasuries, mortgage-backed securities, federal agency debt and and so forth. During the Great Recession, having already lowered the target interest rate to 0%, the Federal Reserve further attempted to stimulate the US economy by buying and holding trillions of dollars worth of US treasuries and mortgage-backed securities, a process known as Quantitative Easing or QE.
US Total Assets Held by All Federal Reserve Banks is at a current level of 6.721 TRILLION, up from 6.656 TRILLION last week and up from 3.890 TRILLION one year ago. This is a change of 72.80% a year ago.
The chart shows the last 15 years. I marked the last recession in grey.
It’s really high.
The Fed seems much more concerned this time as they have rolled out a much larger helicopter to drop over the cash.
I’m seeing a lot of divergence between sectors as a smaller number of stocks The chart is year to date. Only Technology is positive, by 1.86%. Otherwise, it’s a relative notable range of divergence.
The sector divergence is more obvious over the past month. Barely half of the sectors are positive, the rest and down.
This is just a simple illustration of what appears to be some weakness. The rate of change is slowing and I’m guessing it’s been driven by the massive Fed action.
Now, America is opening for business, but some research I’ve been doing shows it may be a bigger problem that I thought.
I’ll share that shortly.
I’ve also got an important piece I’m going to share about my experience trading the last two big bear markets.
It seems inevitable we’ll get to flow through another one and this one may be bigger and badder, we’ll see.
I think skill and experience is going to be an edge and make all the difference as it did in the past, we’ll see.
But, nothing is ever a sure thing. It’s probabilistic, but probably necessarily implies uncertainty.
It’s probably a good time for individual investors who don’t have tight risk management systems to shift to defense to preserve capital, but it’s not a guarantee, and yes, we’ll see.
Join 520 other subscribers
Mike Shell is the Founder and Chief Investment Officer of Shell Capital Management, LLC, and the portfolio manager of ASYMMETRY® Global Tactical. Mike Shell and Shell Capital Management, LLC is a registered investment advisor focused on asymmetric risk-reward and absolute return strategies and provides investment advice and portfolio management only to clients with a signed and executed investment management agreement. The observations shared on this website are for general information only and should not be construed as advice to buy or sell any security. Securities reflected are not intended to represent any client holdings or any recommendations made by the firm. Any opinions expressed may change as subsequent conditions change. Do not make any investment decisions based on such information as it is subject to change. Investing involves risk, including the potential loss of principal an investor must be willing to bear. Past performance is no guarantee of future results. All information and data are deemed reliable but is not guaranteed and should be independently verified. The presence of this website on the Internet shall in no direct or indirect way raise an implication that Shell Capital Management, LLC is offering to sell or soliciting to sell advisory services to residents of any state in which the firm is not registered as an investment advisor. The views and opinions expressed in ASYMMETRY® Observations are those of the authors and do not necessarily reflect a position of Shell Capital Management, LLC. The use of this website is subject to its terms and conditions.
The US Investor Sentiment survey shows individual investors are the most negative about the direction of the stock market they’ve been the past five years.
In fact, the last time investors were this bearish was over seven years ago, in January 2013.
I remember 2013 started off with great pessimism, but end up a stunner.
There was a lot going on in the news in 2012 going in to 2013, so investor sentiment reflected it. Then, there was the stock indexes finally reaching their late 2007 highs after a crushing -56% bear market. It took over five years to recover, but it finally did by the end of 2013.
This time may be different.
The individual investors survey for the sentiment gauge may be right.
But more often than not, when their sentiment reaches an extreme, the market proves them wrong.
Anything is possible. Every new trend is unique. The Fed and US Treasury have made it clear they’ll do anything necessary, so those of us moving around big money probably do so knowing the Fed Put is there.
The Fear & Greed Index is diverging from the sentiment poll. The Fear & Greed Index looks at seven different indicators to gauge investor sentiment. Only one of them is positive right now and the level is at mid field.
US Bullish investor sentiment is at an extreme level, too.
The Bull Bear Spread is about as low as it has ever been.
The market climbs a wall of worry, and that’s exactly what it’s been doing.
So far.
Join 520 other subscribers
Mike Shell is the Founder and Chief Investment Officer of Shell Capital Management, LLC, and the portfolio manager of ASYMMETRY® Global Tactical. Mike Shell and Shell Capital Management, LLC is a registered investment advisor focused on asymmetric risk-reward and absolute return strategies and provides investment advice and portfolio management only to clients with a signed and executed investment management agreement. The observations shared on this website are for general information only and should not be construed as advice to buy or sell any security. Securities reflected are not intended to represent any client holdings or any recommendations made by the firm. Any opinions expressed may change as subsequent conditions change. Do not make any investment decisions based on such information as it is subject to change. Investing involves risk, including the potential loss of principal an investor must be willing to bear. Past performance is no guarantee of future results. All information and data are deemed reliable but is not guaranteed and should be independently verified. The presence of this website on the Internet shall in no direct or indirect way raise an implication that Shell Capital Management, LLC is offering to sell or soliciting to sell advisory services to residents of any state in which the firm is not registered as an investment advisor. The views and opinions expressed in ASYMMETRY® Observations are those of the authors and do not necessarily reflect a position of Shell Capital Management, LLC. The use of this website is subject to its terms and conditions.
The 2 Year U.S. Treasury has never been this low before.
2 Year Treasury Rate is at 0.13%, compared to 0.17% the previous market day and 2.30% last year. This is lower than the long term average of 3.32%.
2 Year Treasury Rate is the yield received for investing in a US government issued treasury security that has a maturity of 2 years. The 2 year treasury yield is included on the shorter end of the yield curve and is important when looking at the overall US economy. Historically, the 2 year treasury yield trended as low as 0.16% in the low rate environment after the Great Recession post 2008. Here is the chart.
This is uncharted territory.
Here is the trend in the interest rate since 1990.
“A 10-2 treasury spread that approaches zero indicates a “flattening” yield curve. A flattening yield curve is when the shorter-term interest rate (2 years) is the same as longer-term interest rate (10 year).”
With the 2 year reaching an all time low, it’s a good time to revisit the yield curve.
10-2 Year Treasury Yield Spread is at 0.50%, compared to 0.55% the previous market day and 0.19% last year. This is lower than the long term average of 0.93%. But, it isn’t zero. Instead, the yield spread is trending up some. I labeled recessions in grey. The current recession hasn’t been called one yet by the historian economist, but it will be.
The 10-2 Treasury Yield Spread is the difference between the 10 year treasury rate and the 2 year treasury rate. A 10-2 treasury spread that approaches zero signifies a “flattening” yield curve. A negative 10-2 yield spread has historically been viewed as a precursor to a recessionary period. A negative 10-2 spread has predicted every recession from 1955 to 2018, but has occurred 6-24 months before the recession occurring, and is thus seen as a far-leading indicator. The 10-2 spread reached a high of 2.91% in 2011, and went as low as -2.41% in 1980.
Interest rates in the U.S. are trending toward zero.
Effective Federal Funds Rate is at 0.05%, compared to 2.40% last year. This is lower than the long term average of 4.75%. The Effective Federal Funds Rate is as low as its ever been.
The Effective Federal Funds Rate is the rate set by the FOMC (Federal Open Market Committee) for banks to borrow funds from each other. The Federal Funds Rate is important because it can act as the benchmark to set other rates. Historically, the Federal Funds Rate reached as high as 22.36% in 1981 during the recession. Additionally, after the financial crisis in 2008-2009, the Federal Funds rate nearly reached zero when quantitative easing was put into effect.
Here is the Effective Federal Funds Rate going back to 1976.
Interest rates can’t be lowered in depressions.
They are already at or near zero.
Operating through the years ahead is going to require rowing, not sailing. It’s going to require rotating, rather than allocating. It’s going to require actively directing and controlling risk, rather than a passive buy and hope approach. We are entering a cycle that is long overdue, but it’s here, now, and I’m looking forward to operating through it tactically.
This is going to be big boy stuff here.*
You better git your mind right.
*Sorry ladies, saying big girl stuff wouldn’t be right.
Join 520 other subscribers
Mike Shell is the Founder and Chief Investment Officer of Shell Capital Management, LLC, and the portfolio manager of ASYMMETRY® Global Tactical. Mike Shell and Shell Capital Management, LLC is a registered investment advisor focused on asymmetric risk-reward and absolute return strategies and provides investment advice and portfolio management only to clients with a signed and executed investment management agreement. The observations shared on this website are for general information only and should not be construed as advice to buy or sell any security. Securities reflected are not intended to represent any client holdings or any recommendations made by the firm. Any opinions expressed may change as subsequent conditions change. Do not make any investment decisions based on such information as it is subject to change. Investing involves risk, including the potential loss of principal an investor must be willing to bear. Past performance is no guarantee of future results. All information and data are deemed reliable but is not guaranteed and should be independently verified. The presence of this website on the Internet shall in no direct or indirect way raise an implication that Shell Capital Management, LLC is offering to sell or soliciting to sell advisory services to residents of any state in which the firm is not registered as an investment advisor. The views and opinions expressed in ASYMMETRY® Observations are those of the authors and do not necessarily reflect a position of Shell Capital Management, LLC. The use of this website is subject to its terms and conditions.
“The flu spread from Hong Kong to the United States, arriving December 1968 and peaking a year later. It ultimately killed 100,000 people in the U.S., mostly over the age of 65, and one million worldwide.”
“It was first noted in the United States in September 1968. The estimated number of deaths was 1 million worldwide and about 100,000 in the United States. Most excess deaths were in people 65 years and older. The H3N2 virus continues to circulate worldwide as a seasonal influenza A virus.”
Woman running through the mud at the Woodstock Music Festival, New York, US, 17th August 1969. (Photo by Owen Franken/Corbis via Getty Images))
So, there you go.
It’s not so different this time, except in ’69 they still carried on with concerts like Woodstock and such.
According to Tucker;
“Nothing was closed by force. Schools mostly stayed open. Businesses did too. You could go to the movies. You could go to bars and restaurants.”
I’ve not had a problem with the Stay at Home orders, and it hasn’t changed my life much, other than we miss hanging out with friends and going out to dinner.
But, he also says;
“Stock markets didn’t crash. Congress passed no legislation. The Federal Reserve did nothing. Not a single governor acted to enforce social distancing, curve flattening (even though hundreds of thousands of people were hospitalized), or banning of crowds. No mothers were arrested for taking their kids to other homes. No surfers were arrested. No daycares were shut even though there were more infant deaths with this virus than the one we are experiencing now. There were no suicides, no unemployment, no drug overdoses.”
So, yeah, maybe the modern day connectivity has amplified the outcome and caused some initial under-reaction and then overreaction?
Mike Shell is the Founder and Chief Investment Officer of Shell Capital Management, LLC, and the portfolio manager of ASYMMETRY® Global Tactical. Mike Shell and Shell Capital Management, LLC is a registered investment advisor focused on asymmetric risk-reward and absolute return strategies and provides investment advice and portfolio management only to clients with a signed and executed investment management agreement. The observations shared on this website are for general information only and should not be construed as advice to buy or sell any security. Securities reflected are not intended to represent any client holdings or any recommendations made by the firm. Any opinions expressed may change as subsequent conditions change. Do not make any investment decisions based on such information as it is subject to change. Investing involves risk, including the potential loss of principal an investor must be willing to bear. Past performance is no guarantee of future results. All information and data are deemed reliable but is not guaranteed and should be independently verified. The presence of this website on the Internet shall in no direct or indirect way raise an implication that Shell Capital Management, LLC is offering to sell or soliciting to sell advisory services to residents of any state in which the firm is not registered as an investment advisor. The views and opinions expressed in ASYMMETRY® Observations are those of the authors and do not necessarily reflect a position of Shell Capital Management, LLC. The use of this website is subject to its terms and conditions.
We tend to find information that confirms our existing beliefs.
We’re seeing it more than ever, if we pay attention and recognize it.
If you feel we should stay on lock down and maintain the quarantine, you find news and opinions that support yours.
If you feel it’s all just a hoax and the quarantine has been a disaster, you find news and opinions that support yours.
If you feel the lock down has been necessary, but now the curve has flattened, so it’s time to open the United States for business, you find news and opinions that support yours.
Yes, I said “we”, because I do it, too, but the difference may be; I know it do, so I’m aware of it.
Awareness allows us to recognize it, then we get to decide if we want to do it, or not.
In other words, we decide if we want it, or not.
Confirmation bias is the tendency to search for, interpret, favor, and recall information in a way that confirms or strengthens one’s prior personal beliefs or hypotheses. It is a type of cognitive bias.
One says about cognitive bias:
A cognitive bias is a systematic error in thinking that affects the decisions and judgments that people make. Some of these biases are related to memory. The way you remember an event may be biased for a number of reasons and that in turn can lead to biased thinking and decision-making.
Another defines it as:
A cognitive bias is a systematic pattern of deviation from norm or rationality in judgment. Individuals create their own “subjective reality” from their perception of the input. An individual’s construction of reality, not the objective input, may dictate their behavior in the world.
I like the “subjective reality” part.
We aren’t objective, unless we want to be.
Wikipedia says;
Objectivity is a philosophical concept of being true independently from individual subjectivity caused by perception, emotions, or imagination. A proposition is considered to have objective truth when its truth conditions are met without bias caused by a sentient subject.
Simply put, objectivity is when our judgment isn’t influenced by personal feelings or opinions in considering and representing facts.
Yeah, tell me how often you are objective about things, leaving out your feelings and opinions, or considering the facts as you see them.
So, to be objective is not being influenced by personal feelings, interpretations, or prejudice; based on facts; and unbiased.
An objective opinion is an intention of dealing with things without taking into considering our own beliefs, thoughts, opinions, and feelings.
Who does that?
I think we’re going to feel our feelings, experience them, one way or another.
I also think it’s hard to ignore our own judgement and perceptions.
And then there’s feelings. If the topic drives our emotions, it makes us scared, mad, or happy, then it’s hard to get past it, unless we really want to.
We sometimes get lazy, and we just don’t want to pay attention anymore, so we just take those mental shortcuts. The easy way it is so, easy.
When it comes to the lockdown, Physicians who are concerned about their hospitals being overwhelmed may prefer it this way, so they’ll find information that supports their own individual motivations.
Other Physicians may earn their living doing surgeries that aren’t labeled a necessity, so their motivation is to get back to work. They may be more biased toward finding information that supports opening for business.
What is wrong with having your own opinion or personal motivations?
Nothing.
It’s useful to pay attention and know we have it.
It’s an example of how we find ways to get what we want.
We decide what we get.
Our cognitive biases influence how we think and act, so it’s useful to be aware of what it is we want, because we’re going to find information that supports what we want.
Sometimes we just don’t have time to think for ourselves, so we just find information from trusted people and go with it. My observations here is an example, especially when it comes to market trends and such.
We have to be selective in how we pay attention to what’s going on the world around us because we simply don’t have time to observe it all. I realized this two decades ago, so I developed systems for monitoring what has changed, systematically. I don’t have to sit around and look for it manually, I get alerts. When something has changed enough to send me a signal, then I look to see if I believe it matters.
Should you listen to others?
Only if they’re better at it than you are, and have more focus. Concentration is key, to me. My track record speaks for itself, especially during bear markets and volatility expansions. I’ve now operated through three major bear markets and a hundred volatility expansion. This isn’t new for me.
More importantly, I didn’t just “hunker down” and buy and hold through market crashes like 2000-03 or 2007-09. I tactically traded through them, successfully, and managed my drawdowns within a tolerable level. Past performance is never a guarantee of future results, but I’d rather drive my own boat through this storm than ride with anyone else. I’ve learned many lessons that should add to my skill and experience, so I’m likely to get what I want, but likely isn’t a sure thing.
What we believe about the virus and the lockdown depends on our personal beliefs, and we probably find things that support what we already believe. Nothing I write is guaranteed change your mind. You’ll instead compare it to the observations and opinions of others, but most importantly, you own.
That is, unless you intentionally look at the data with determination to be objective.
I know, it’s hard. Who does that?
A simple equation: Intentions = results.
In Market Wizards: Interviews with Top Traders, Ed Seykota, one of the famous traders interviewed, said:
“Win or lose, everyone gets what they want from the market.”
It means our intentions equals our results. Our intentions create our results.
For example, you have an opinion about the stock market right now. You have a feeling about it. You have beliefs. You may draw from the beliefs and opinions of others. You’re certainly focused on finding what confirms what you already believe, if you recognize it.
If you believe the stock market can’t possibly trend higher, you look for confirming information and opinions. If the market trends down and you avoided the loss, you got what you wanted. If the market trends up and you missed out, you got what you wanted. You wanted to avoid the downtrend you believe should happen. It doesn’t matter if it does, or not.
If you believe the stock market will go to the moon again because the Fed is intent on it, you’ll expose your portfolio to your belief. If the market trends up and you participate in its profits, you got what you wanted. If the market instead trends up and you participate in its losses, you got what you wanted. You believed it should trend up and you wanted exposure to what you believe should happen. It doesn’t matter if it does, or not.
What you believe is true, for you.
It’s how we get what we want.
We decide what we get. So, if we want to be empowered, create our own outcomes, we must necessarily take responsibility for them. When we take responsibility for our outcomes, we get the results we want.
Knowing what I know, having operate through times like this before, you’re going to need it. That is, unless you choose to be a victim. But I just made you aware that’s a choice, too.
I want to use my skills and experience to make the best of what is going to happen next.
Join 520 other subscribers
Mike Shell is the Founder and Chief Investment Officer of Shell Capital Management, LLC, and the portfolio manager of ASYMMETRY® Global Tactical. Mike Shell and Shell Capital Management, LLC is a registered investment advisor focused on asymmetric risk-reward and absolute return strategies and provides investment advice and portfolio management only to clients with a signed and executed investment management agreement. The observations shared on this website are for general information only and should not be construed as advice to buy or sell any security. Securities reflected are not intended to represent any client holdings or any recommendations made by the firm. Any opinions expressed may change as subsequent conditions change. Do not make any investment decisions based on such information as it is subject to change. Investing involves risk, including the potential loss of principal an investor must be willing to bear. Past performance is no guarantee of future results. All information and data are deemed reliable but is not guaranteed and should be independently verified. The presence of this website on the Internet shall in no direct or indirect way raise an implication that Shell Capital Management, LLC is offering to sell or soliciting to sell advisory services to residents of any state in which the firm is not registered as an investment advisor. The views and opinions expressed in ASYMMETRY® Observations are those of the authors and do not necessarily reflect a position of Shell Capital Management, LLC. The use of this website is subject to its terms and conditions.
As options traders, we are sensitive to the velocity of a price trend.
If the market doesn’t trend with enough momentum, an options contract may have less value.
Volatility is also a measure of how quickly and wide prices spread out.
For example, the bell curve shows three possible distributions around the current price of an option.
Source: Natenberg, Sheldon. Option Volatility and Pricing: Advanced Trading Strategies and Techniques, 2nd Edition . McGraw-Hill Education.
If we are researching the value of the call option, it will depend on the amount of the distribution to the right of the exercise price. As it shifts from low-volatility, to moderate-volatility, to high-volatility, more of the price distribution is on the right side, and the option price trends up to an increasingly greater value. I highlighted in green the area where the higher volatility level results in a higher call option price.
Markets move fast in a volatility expansion, and VIX the continues to imply greater than average speed.
So, we should expect to see a continued higher range of prices, and faster moves up and down.
The three widely followed stock indexes closed slightly down for the week after peaking on Wednesday.
We’ll soon see if this is the beginning of an inflection point as many expect to see a lower low, or at least a retest of the March 2020 low.
If this is a prolonged bear market to go along with recession, as it may well be, I expect we’ll experience many swings up and down along the way. As I successfully traded tactically through the 2008 to 2009 period, many investment managers I know who didn’t do so well had trouble with the swings and whipsaws.
To actively manage risk, and capitalize on trends in bear markets requires flexibility and nimbleness. It also requires shortening the time frames. As the implied volatility remains very elevated at 37, investors should prepare to see these swings until volatility contracts again.
We know many investors are afraid of more losses in their portfolios if they hold stocks or funds they otherwise want to keep, rather than sell. We are making my ASYMMETRY®Portfolio Hedging program available as an advisory service for accredited investors with an investment portfolio of $1 million or more. To see if your portfolio qualifies, contact us here.
Join 520 other subscribers
Mike Shell is the Founder and Chief Investment Officer of Shell Capital Management, LLC, and the portfolio manager of ASYMMETRY® Global Tactical. Mike Shell and Shell Capital Management, LLC is a registered investment advisor focused on asymmetric risk-reward and absolute return strategies and provides investment advice and portfolio management only to clients with a signed and executed investment management agreement. The observations shared on this website are for general information only and should not be construed as advice to buy or sell any security. Securities reflected are not intended to represent any client holdings or any recommendations made by the firm. Any opinions expressed may change as subsequent conditions change. Do not make any investment decisions based on such information as it is subject to change. Investing involves risk, including the potential loss of principal an investor must be willing to bear. Past performance is no guarantee of future results. All information and data are deemed reliable but is not guaranteed and should be independently verified. The presence of this website on the Internet shall in no direct or indirect way raise an implication that Shell Capital Management, LLC is offering to sell or soliciting to sell advisory services to residents of any state in which the firm is not registered as an investment advisor. The views and opinions expressed in ASYMMETRY® Observations are those of the authors and do not necessarily reflect a position of Shell Capital Management, LLC. The use of this website is subject to its terms and conditions.
What you see in the chart is The S&P 500 stock index, which is an unmanaged index of 500 or so stocks, weighted by their capitalization (size of company) and it’s long-only, fully invested, and therefore fully exposed to the risk/reward of the stocks. The S&P 500 is often considered a proxy for “the stock market”, like the Dow Jones. The risk of the S&P 500 is unlimited, although all 500 stocks would have to fall to zero to lose all your money. It hasn’t done that before, but it has declined -56% just a decade ago. See the red arrow.
Before that period 2008-09, the S&P 500 declined -50% from 2000 to 2003. If something has declined this much before, it should be assumed it can and will again.
So, it’s risky.
And that’s the true risk. The worst historical drawdown is the real measure of risk. If some advisor is telling you risk is two or three standard deviations, run, don’t walk, out that door.
Since being fully invested in the stock market all the time is so risky, real investors with real money tend to want real risk management.
That is, not just “diversification”, which is often touted as “risk management.” Buying 500 stocks isn’t true diversification. Niether is buying 1,000 or 3,000 stocks.
To be sure, the Vanguard Total Stock Market ETF holds 3,542 stocks. The next chart is the Vanguard Total Stock Market fund vs. the S&P 500 ETF. We don’t own either of them, so this doesn’t represent anything we’re doing at my investment company. It’s just an example, that yeah, the stock market is risky, not matter who you are, or how many you hold. Even with over 3,000 more stocks than the S&P 500, it falls the same.
But, to their credit, Vanguard does a good job saying their funds are risky. When I visited their website to see the number of holdings, it says:
Plain talk about risk
An investment in the fund could lose money over short or even long periods. You should expect the fund’s share price and total return to fluctuate within a wide range, like the fluctuations of the overall stock market. The fund’s performance could be hurt by:
Stock market risk: The chance that stock prices overall will decline. Stock markets tend to move in cycles, with periods of rising stock prices and periods of falling stock prices. The fund’s target index may, at times, become focused in stocks of a particular sector, category, or group of companies.
Index sampling risk: The chance that the securities selected for the fund, in the aggregate, will not provide investment performance matching that of the index. Index sampling risk for the fund should be low.
Risks associated with moderate to aggressive funds
Vanguard funds classified as moderate to aggressive are broadly diversified but are subject to wide fluctuations in share price because they hold virtually all of their assets in common stocks. In general, such funds are appropriate for investors who have a long-term investment horizon (ten years or longer), who are seeking growth in capital as a primary objective, and who are prepared to endure the sharp and sometimes prolonged declines in share prices that occur from time to time in the stock market. This price volatility is the trade-off for the potentially high returns that common stocks can provide. The level of current income produced by funds in this category ranges from moderate to very low.
Ok, so we’ve established that the stock market is risky and even a fund invested in thousands of stocks can decline over -50% and take years to recover.
So, we just answered: Why risk management?
It doesn’t matter how much the return is if downside drawdowns are so high you tap out before the gains are acheived.
It also doesn’t’ matter how big the gains are if you give it all up before selling and realizing a profit.
I digress.
I specialize in active dynamic management strategies. I’ve been developing and operating investment risk management systems for the past two decades. Since my focus is on managing the downside, within our risk tolerance, I’m left to let the horses run. If we can direct and control our drawdowns, within reason, it’s never a sure thing, then we are left to focus on the upside of profits.
To illustrate two different methods of risk management, I’m going to use the most simple examples possible. I’m also going to use indexes managed by others, instead of my own. It’s all about keeping it simple to make a point.
So, here we go. I explained the orange line is the S&P 500, fully invested in stocks, all the time, no risk management beyond the diversification of investing in 500 stocks across 10 sectors like financial, healthcare, and tech.
The blue line in the chart is the S&P Trend Allocator Index. The S&P 500® Trend Allocator index is designed to track the performance of a systematic trend-following strategyallocating between the S&P 500 and cash, based on price trends. If the S&P 500 is observed to be in a positive trend, then the index is allocated to the S&P 500, otherwise, it is allocated to cash. It’s a very simple form of trend following applied to stocks. When the S&P 500 is above its 200 day simple moving average, it invests in stocks. When it trends below the 200 day for more than 5 days, it shifts to cash.
The purple trend line, which has achieved the highest return, is the CBOE S&P 500 5% Put Protection Index. The CBOE S&P 500 5% Put Protection Index is designed to track the performance of a hypothetical strategy that holds a long position indexed to the S&P 500® Indexandbuys a monthly 5% out-of-the-money S&P 500 Index (SPX) put option as a hedge. It’s a defined risk strategy, using put options for dynamic hedging.
Trend Following vs. Hedging with Options
Which worked better?
For a closer look, here is the year to date return streams.
Clearly, hedging with 5% out of the money put options has achieved the better asymmetric risk/reward this time. Applying the simple trend following strategy of selling after the stock index declines below its 200 day moving average exited before the low of the S&P 500, but it remains uninvested, missing out on the upside. The trend following streastgy is down -23% year to date, which is worse than the S&P 500. The hedged index is actually positive for 2020. The hedge paid off, according to this index.
Let’s take a closer look at the downside via a drawdown chart, the % off highs. As expected, the S&P 500 stock index had the worst drawdown, so far. It declined -34%.
The strategy of buying 5% out of the money put options had a drawdown of -20%, which is about half of the S&P 500. The systematic trend following strategy was able to cut the drawdown a little short at -27%. The trend following strategy is currently still in its drawdown.
It’s out of the stock market, so it has also missed out on the recent uptrend. Although, it the stock market enters another waterfall decline, that may turn out better. But, to catch up with the fully invested stock index, that’s what would have to occur. The stock market would have to fall a lot, then the strategy reenter at a better point. However, trend following never enters the lows, and never sells the highs, either. Instead, it enters and exits on a lag and the 200 day moving average is a significant lag. For example, I new this trend following strategy would have at least a -11% drawdown, because when the stock market was at its high in February, the 200 day moving average sell signal was -11% lower.
However, this simple system also requires the index to remain below the 200 day average for 5 days, which is intended to reduce whipsaws. That’s why it didn’t initially sell on the first leg down. Instead, it sold after the second leg down. Since the S&P 500 is still below its 200 day moving average, this trend following system hasn’t invested in the stock market yet. In fact, it would have to stay above the 200 day for 5 days. It’s a symmetric trading system. It applies the same signal for the entry and the exit. I know that price trends drift up and crash down, so my version of this is an asymmetric trading system. I apply a different exit than the entry to account for the unique behavior of price trends since they drift up, but crash down.
How has systematic trend following worked on stocks over a longer period?
It’s had some challenges. Volatile periods, when a market swings up and down over shorter time frames, are hostile conditions for trend following methods. This index has only gained 7% the past 5 years after this recent drawdown. While it does cut the losses short, which is what trend following is known for, it has struggled due to market conditions.
I marked up the next chart, where I include its trend relative to the S&P 500 index. I labeled when it sold, which was three times. The first two times, selling with the trend following sell signal of a 200 day SMA avoided a little of the downside. This time it hasn’t helped so much. Overall, the trend following applied to stocks had lower relative strength than the fully invested stock index with no risk management. But, it avoided some downside. Over this short time frame, the downside loss mitigation probably isn’t deemed enough to account for the difference in the outcomes.
With risk management systems, we never expect them to achieve the same or better return than a fully invested stock index that is always exposed to the risk/reward of stocks. The stock index also doesn’t include expenses and it may not be invested in directly. Investors demand risk management because they don’t want the -50% declines they would endure being invested in the stock market with no exit and no hedge.
Speaking of hedge.
Neither of these risk management indexes I’m using for this example have been around long. The CBOE CBOE S&P 500 5% Put Protection Index started in 2015.
The CBOE S&P 500 5% Put Protection Index is designed to track the performance of a hypothetical risk-management strategy that consists of a long position indexed to the S&P 500 Index (SPX Index) and a rolling long position in monthly 5% Out-of-the-Money (OTM) SPX Put options. This is a relatively simple example, though executing it well isn’t so simple. The protective put strategy has achieved better asymmetry, this time. I say this time, because it doesn’t always work as well as it did this time. But, here it is.
As you can see, it lagged the stock index in the uptrend, until now. Lagging in the uptrend is expected. Buying a put option gives us the right to sell our stock below a certain price. It’s similar to buying home or car insurance. When we buy a protective put option, we literally pay a “premium” for a time period to expiration, like insurance. Some call it portfolio insurance. If we pay an insurance premium for years, it reduces our personal profit and loss statement. The protection is an expense. We’re willing to pay it to avoid large drawdowns. A skilled options trader can potentially execute it better, if an edge can be gained with timing the relative value of the options.
Asymmetric hedging beat the simple following strategy this time. I call it asymmetric hedging, because when we buy a put option, we have limited downside risk (the premium paid) but we have a maximum gain of the Strike price – premium paid. To learn more about a Long Put option, here is a video from the OIC.
The protective put strategy has achieved better risk/reward. I say this time, because it doesn’t always work as well as it did this time. Also, I said the Long Put protection strategy is an “asymmetric hedge” because it has a larger potential profit than the cost for the exposure. There are much better examples of what I call an asymmetric hedge, for example, going long volatility can have a substantial asymmetric payoff. Just look at the VIX. It spiked up more than ever in history, so even a small option position to be long volatility would have a tremendous payoff. Imagine if we spent just 1% of a portfolio but the payoff was 10% at the portfolio level. Yeah, that’s asymmetry.
Back to the comparison of trend following to hedging with options, here is the return streams over the past five years. I consider both of these risk management methods to be basic asymmetric risk/reward payoffs. The trend following system didn’t do so well this time, at least so far, but it still has limited downside risk and unlimited upside gain potential. If the stock market keeps going up and never trends down below its 200 day average, it would keep gaining.
But, if we believed that was what it will do, we wouldn’t care about risk management. Some people actually do put their money in stocks and stock funds and don’t consider limiting their downside. To each their own. Before this bear market is over, they may be crying about their large losses, as they did last time. But I’m guessing this time, if they do it again, they may learn the lesson. The stock market is risky, all investing involves risks as do all strategies. No strategy is perfect. We have to be willing to accept the imperfections and settle with a C sometimes, if we want to A over the long run. This isn’t college. Money compounds.
This leads me to one more thought to share. I was watching this video from Ray Dalio, the founder of the largest hedge fund in the world. Dalio was speaking of this chart in his presentation. He calls it “The Holy Grail.”
In an ideal world, we could invest in 15-20 different assets that are uncorrelated and because one trends up with others are trending down, similar to the hedging strategy, we would achieve an edge from pure diversification. He says The Holy Grail is combining these unique returns streams, which has gains and losses at different times, but overall, the portfolio trends up to the upper right corner.
That’s in an idealized world.
You may know better. Shit happens in the real world. A joke going around is:
Started the year off January 1st: THIS IS MY YEAR!
By April, wiping my …. with coffee filters.
Now that’s funny right there! I don’t care who you are!
Yeah, I said it. It’s a sign of the times. We need to lighten up and laugh as much as we can, especially about the simple things in life, like running out of tp.
In bear markets, correlations go to one. That is, most everything falls. Why? Even if you have gains in some uncorrelated markets, if you have big losses in others, as a fund manger, you take the profits to help deal with the losses. It eventually pushes down the leaders, too. That’s just one of many examples. Here’s an old chart I’ve used for years to illustrate how diversification along can fail.
There is no free lunch, but Dalio is right, if we could combined 15 or so unique return streams, it could be an edge. The trouble is, what markets can you simply invest in that are truly disconnected from the others?
No many. Maybe long term US Treasuries along with stocks, but going forward, it’s not going to look like the past. US Treasuries will be tradable, but with the interest rate down to 1%, the upside in price is very limited, so is the interest income.
Uncorrelated Return Streams
I did both of this type of strategy, and more, in Asymmetry Global Tactical Fund, LP which was a private managed by another company I founded in 2012, Asymmetry Fund Management, LLC. What I believe is more of “The Holy Grail” isn’t making simple investment allocations into different funds or markets hoping for diversification from non-correlation, but instead, combining asymmetric trading systems that have unique return drivers and asymmetric risk/reward profiles. My different trading systems have different return drivers. Instead of market factors and conditions driving the return stream, the buy, sell, and risk management system extracts from the market a unique return stream. It’s a return stream we can’t get from just investing in some funds with different managers. They are mostly correlated, multiple asymmetric trading systems may be very uncorrelated from each other. For example, one system may trend follow longer term trends. Another may trend follow short term trends. Then, they are applied to difference markets, say stocks, bonds, currency, and commodities. Another complete different system may be volatility trading, aiming to gain from a volatility expansion. Add in some countertrend systems, that buys short term oversold and sell short term overbought, and it’s going to produce a unique return stream from everything else. What if the countertrend system is applied to different markets, then, each extracting a unique return stream.
That’s real diversification.
It can’t be achieved by just investing in different markets, or investing in a bunch of funds. But, someone like Dalio, or me, who has multiple trading systems and strategies, we may benefit from the edge of combining them, o even shifting between them.
But I have an edge, and a very big one, over Dalio. He’s got to move around billions. He can’t trade nimble as I can. My flexibility and nimbleness is an edge. I’m not ever going to manage 50 billion or 100 billion and would never want to. I already have what I want. I have enough. It allows me to focus, and be dynamic. I’m happier with little to no distraction.
Now, this is an overly simplified idealized example I’ve used here with the trend following and put buying hedging strategy, but just thing about how this would look if we combine them along with 15-20 others. The larger the money we manage, the more we need to just allocate capital into something rather than trading.
You can probably how these three trends are correlated in uptrends, then disconnect in downtrends. Some combination of them can smooth the ride. In this overly simple example, it would mean some exposer to long-only fully invested in stocks, all the time, no matter how far they fall. Another is always hedged, so it will lag on the upside, but limit the risk on the downside. Then, the trend following system absolutely exits in downtrends and waits for an uptrend. When the market is crashing, nothing looks better in our account that FDIC insured cash deposits.
But, I rotate, instead of allocate.
I would rather shift between markets to be exposed when I believe the risk/reward is asymmetric and avoid it when it isn’t.
Then, imagine if each of these have its own risk management to predefine risk in advance and a portfolio level drawdown control to limit overall drawdowns to less than the -30% of more than is common with the stock market.
So, there you go, a trend following system relative to a options hedging system, and a hint at how we see it. I’m an unconstrained tactical money manager. I don’t constrain myself to a box. I never liked being put in a box and I don’t fit well in any box. I’ll go were the money is treated best. Flexible, adaptable, nimble, unconstrained, and unbiased.
That’s just how I roll.
Join 520 other subscribers
Mike Shell is the Founder and Chief Investment Officer of Shell Capital Management, LLC, and the portfolio manager of ASYMMETRY® Global Tactical. Mike Shell and Shell Capital Management, LLC is a registered investment advisor focused on asymmetric risk-reward and absolute return strategies and provides investment advice and portfolio management only to clients with a signed and executed investment management agreement. The observations shared on this website are for general information only and should not be construed as advice to buy or sell any security. Securities reflected are not intended to represent any client holdings or any recommendations made by the firm. Any opinions expressed may change as subsequent conditions change. Do not make any investment decisions based on such information as it is subject to change. Investing involves risk, including the potential loss of principal an investor must be willing to bear. Past performance is no guarantee of future results. All information and data are deemed reliable but is not guaranteed and should be independently verified. The presence of this website on the Internet shall in no direct or indirect way raise an implication that Shell Capital Management, LLC is offering to sell or soliciting to sell advisory services to residents of any state in which the firm is not registered as an investment advisor. The views and opinions expressed in ASYMMETRY® Observations are those of the authors and do not necessarily reflect a position of Shell Capital Management, LLC. The use of this website is subject to its terms and conditions.
US Initial Jobless Claims, provided by the US Department of Labor, provides data on how many new people have filed for unemployment benefits in the previous week.
We can use initial jobless claims to gauge the economy with respect to employment. As more new people file for unemployment benefits, fewer individuals in the economy have jobs.
Historically, initial jobless claims tended to reach peaks towards the end of recessionary periods such as on March 21, 2009 with a value of 661,000 new filings.
The initial jobless claims at the end of the “global financial crisis” is nothing compared to what we are seeing today.
US Initial Jobless Claims is at a current level of 3.839 million, down from 4.442 million last week and up from 230,000.0 one year ago. Over 30 million Americans have no filed for unemployment.
Continued jobless claims is about 18 million.
It’s in uncharted territory. We’ve never seen job losses to this magnitude.
Join 520 other subscribers
Mike Shell is the Founder and Chief Investment Officer of Shell Capital Management, LLC, and the portfolio manager of ASYMMETRY® Global Tactical. Mike Shell and Shell Capital Management, LLC is a registered investment advisor focused on asymmetric risk-reward and absolute return strategies and provides investment advice and portfolio management only to clients with a signed and executed investment management agreement. The observations shared on this website are for general information only and should not be construed as advice to buy or sell any security. Securities reflected are not intended to represent any client holdings or any recommendations made by the firm. Any opinions expressed may change as subsequent conditions change. Do not make any investment decisions based on such information as it is subject to change. Investing involves risk, including the potential loss of principal an investor must be willing to bear. Past performance is no guarantee of future results. All information and data are deemed reliable but is not guaranteed and should be independently verified. The presence of this website on the Internet shall in no direct or indirect way raise an implication that Shell Capital Management, LLC is offering to sell or soliciting to sell advisory services to residents of any state in which the firm is not registered as an investment advisor. The views and opinions expressed in ASYMMETRY® Observations are those of the authors and do not necessarily reflect a position of Shell Capital Management, LLC. The use of this website is subject to its terms and conditions.
On February 6th, I shared and observation in “19 is the new 20, but is this a new low volatility regime?” the lower level of implied (expected) volatility at the time may be driven by two factors that may have been resulting in less concern for volatility. I wrote:
The current bull market that started in March 2009 is the longest bull market in history. It exceeded the bull market of the 1990s that lasted 113 months in terms of time, though still not as much gain as the 90s.
The U.S. is in its longest economic expansion in history, breaking the record of 120 months of economic growth from March 1991 to March 2001, according to the National Bureau of Economic Research. However, this record-setting run observed GDP growth far slower than previous expansions.
The aged bull market and economic expansion can naturally lead to some level of complacency and expectation for less downside and tighter price trends. When investors are uncertain, their indecision shows up in a wide range of prices. When investors are smugger and confident, they are less indecisive and it’s usually after a smooth uptrend they expect to continue.
Well, so much for that.
Here we are, the bull market was interrupted by a -37% in the Dow Jones. So, any higher highs from here will be labeled a new bull market.
This chart was featured in the Wall Street Journal by one of the few outside research I read; The Daily Shot.
Oh yes, did that chart reverse trend as expected.
Now there’s this. The CBOE Volatility Index (VIX) spiked to 82, the highest level of implied vol on record.
But since then, it is gradually trending down.
The options market is pricing in less expected volatility for the S&P 500 stocks over the next 30 days.
It’s a volatility contraction.
Will it continue?
It will as long as expected vol keeps declining. I know; captain obvious.
VIX is trending down, but it’s still at 31, and still a wider than average range of prices spreading out.
If we see a reversal down in stocks, then we’ll see volatility spike again. But for now, it’s a volatility contraction, so I’ll take it.
The Fear & Greed Index is only dialed half way up.
Only two of the Fear & Greed Index indicators are showing greed. Safe haven demand is the biggest, which is the difference between the 20-day stock and bond returns. Stocks have outperformed bonds by 16.29% the last 20 trading days. This is close to the strongest performance for stocks relative to bonds in the past two years and suggests investors are rotating into stocks from the relative safety of bonds.
The other is the Put/Call Ratio. During the last five trading days, volume in put options has lagged volume in call options by 44.87% as investors make bullish bets in their portfolios. However, this among the lowest levels of put buying seen during the last two years, indicating greed on the part of investors.
By my measures, the stock market is just now entering the overbought range, technically, on a short term basis.
For example, the percent of S&P 500 stocks above their 50 day moving average is now up to 74% after todays close. It’s the higher risk zone.
As a testiment to the internal damage done, I present the percent of S&P 500 stocks above their 200 day moving average, which is only at 30%. It tells us most stocks are still in a longer term downtrend after reaching a low of only 3% of stocks above their trend line on March 20th.
And yes, it was very near the March 23rd low only three days later.
Most stocks are participating in the uptrend, as measured by 70% of them above their average of the past 50 days.
Volatiltiy is contracting.
Investor sentiment is gradually shifting. Nothing drives sentiment like the price trend. The price trend is the leading indicator, investors enthusiasm follows it.
All while we just saw the largest drop in economic growth since 2008.
Mike Shell is the Founder and Chief Investment Officer of Shell Capital Management, LLC, and the portfolio manager of ASYMMETRY® Global Tactical. Mike Shell and Shell Capital Management, LLC is a registered investment advisor focused on asymmetric risk-reward and absolute return strategies and provides investment advice and portfolio management only to clients with a signed and executed investment management agreement. The observations shared on this website are for general information only and should not be construed as advice to buy or sell any security. Securities reflected are not intended to represent any client holdings or any recommendations made by the firm. Any opinions expressed may change as subsequent conditions change. Do not make any investment decisions based on such information as it is subject to change. Investing involves risk, including the potential loss of principal an investor must be willing to bear. Past performance is no guarantee of future results. All information and data are deemed reliable but is not guaranteed and should be independently verified. The presence of this website on the Internet shall in no direct or indirect way raise an implication that Shell Capital Management, LLC is offering to sell or soliciting to sell advisory services to residents of any state in which the firm is not registered as an investment advisor. The views and opinions expressed in ASYMMETRY® Observations are those of the authors and do not necessarily reflect a position of Shell Capital Management, LLC. The use of this website is subject to its terms and conditions.
Last week, the US investor sentiment, an indicator that is a part of the AAII Sentiment Survey, indicated the percentage of investors surveyed that had a bearish outlook for the stock market. An investor that is bearish believes the stock market will head lower in the next six months.
US Investor Sentiment, % Bearish was at 50.00% for the week ending April 23rd, compared to 42.75% the prior week.
Considering the number of global macroeconomic indicators in uncharted territory, it’s expected to see many investors bearish. But, the stock market is climbing the wall of worry.
When an uptrend in the stock market includes a lot of uncertainty about its sustainability, we say the market is climbing a wall of worry.
That’s exactly what we’re seeing now.
I’m guessing investors who sold their stocks at lower prices are feeling the fear of missing out about now.
I’ve always said that everyone has an exit point, it can be predefined like mine is, or it can be your uncle point. If you reach the point you tap-out to avoid more loss, it’s probably at much lower prices. I prefer to exit before losses get too large, but also exit based on logical price levels that suggest a change of trend. Or, portfolio level exits designed for drawdown control to limit loss.
If you tapped out at lower prices last month because you felt afraid, I don’t know when you would feel better about buying again?
Suppose the chart below represents what you invest in. At what point do you get bullish again and invest?
If you say at the lower level, you may be fooling yourself.
You don’t know it doesn’t go down another -20% from there. But, I know if you tapped out before it was down so much, it is highly unlikely you’ll feel more positive at lower prices. Instead, you’ll extrapolate the recent past into the future.
Just like you are, now.
Except now, prices are trending up, and if you tapped out at the low, you’re feeling the fear of missing out.
So, do you feel better now that prices have risen?
Using the same price series, let’s pretend you sold at the first low.
Then, a few weeks later, the price is trending up and you get excited and buy.
Oops. What you didn’t know, and never will know, is the trend reversed down to an even lower low. What do you do then?
Maybe you sell at the same price level you did before. The market is falling and you just want out, again.
Once if falls a lot more, do you ever get to feeling like buying again? You’ve already created two losses of around -20%, each trip. You first lost -20%, then bought the high, then lost about -20% again in the same price range. Now, here you are, the market is down over -60% and you’re supposed to feel good?
I doubt it.
The headlines are blood red.
It seems everyone is taking on heavy losses and the waterfall has been so deep and long it doesn’t seem it will ever end.
Then, there it goes.
You want to buy every time it moves up 10% and you feel like you’re really missing out on the opportunity of a lifetime when it trends up 20%, without you.
But you’re stuck. So afraid of “another leg down” as everyone is worried about.
Every decline seems to be the beginning of a new leg down, but it isn’t, until it is, but even then, it’s “only” -30%.
I used the trend as an example, but it’s a real trend. I successfully made tactical trading decisions through it, so I know the mindset and behavioral challenges. It wasn’t an ON/OFF switch, either. I entered and exited many times, trading the swings along the way, never sure if it would trend higher, or reverse back down, but applying systems that account for the unknowable outcome.
The market climbs a wall of worry. Fortunately, we’re participating in this uptrend.
It doesn’t do what we expect it to sometimes.
Some investors seem to oscillate between the fear of missing out and the fear of losing money.
Some of them tend to be more afraid, so they are oriented toward the fear of losing money.
Others are optimists, so while they may panic out, they quickly get optimistic after prices trend back up.
Regardless of the behavioral tendency, if you tap out at the lows, I don’t know when you’ll ever get back in. I have no answer for it.
If you buy now, you may exposure yourself to the possibility of loss just as it reverses back down again.
If you wait for the next leg down, what if it never comes?
To me, the solution is to avoid investment programs that may result in your tapping out to start with. That is, know your true risk tolerance. Know at what % loss you are prone to tap out, and invest with a manager who has drawdown controls to help manage the risk.
If you are sitting there in cash, waiting to reinvest, there will never be a perfect time to do it.
Invest with someone who can hedge and manage risk, then let it rip.
The next AAII investor sentiment survey is out tomorrow. It will show fewer bearish investors, now that price has trended up.
Nothing changes investor sentiment the a price trend.
Join 520 other subscribers
Mike Shell is the Founder and Chief Investment Officer of Shell Capital Management, LLC, and the portfolio manager of ASYMMETRY® Global Tactical. Mike Shell and Shell Capital Management, LLC is a registered investment advisor focused on asymmetric risk-reward and absolute return strategies and provides investment advice and portfolio management only to clients with a signed and executed investment management agreement. The observations shared on this website are for general information only and should not be construed as advice to buy or sell any security. Securities reflected are not intended to represent any client holdings or any recommendations made by the firm. Any opinions expressed may change as subsequent conditions change. Do not make any investment decisions based on such information as it is subject to change. Investing involves risk, including the potential loss of principal an investor must be willing to bear. Past performance is no guarantee of future results. All information and data are deemed reliable but is not guaranteed and should be independently verified. The presence of this website on the Internet shall in no direct or indirect way raise an implication that Shell Capital Management, LLC is offering to sell or soliciting to sell advisory services to residents of any state in which the firm is not registered as an investment advisor. The views and opinions expressed in ASYMMETRY® Observations are those of the authors and do not necessarily reflect a position of Shell Capital Management, LLC. The use of this website is subject to its terms and conditions.
As the US and and global economies are entering a recession, this is when I start actively monitoring global macro-economic trends.
My investment and tactical trading decisions are informed by directional price trends, momentum, volatility, and investor sentiment. So, this quantitative data is my primary focus as a global macro/tactical investment manager.
That is, until economic trends shift outside their range and reach extremes.
Then I start observing these global macro trends to observe what has changed. We monitor thousands and data streams and time series, daily, with quantitative alerts that signal when these trends change, or when their rate of change shifts. For example, we monitor 4,136 global Gross Domestic Product (GDP) indicators alone.
US GDP Growth released today indicates the longest U.S. economic expansion in history is over.
The Bureau of Economic Analysis releases quarterly figures for US Gross Domestic Product. In addition to the Real GDP, the report also includes data for income, sales, inventories, and corporate profits. It is one of the most important parts of the National Income and Product Accounts.
US Real GDP Growth is measured as the year over year change in the Gross Domestic Product in the US as adjusted for inflation. Gross Domestic Product is the total value of goods produced and services provided in a the US. Real GDP Growth is a vital indicator to analyze the health of the economy. Two quarters of consecutive negative real GDP growth officially signifies a recession. Additionally, GDP is used by the Fed (FOMC) as a gauge to make their interest rate decisions. In the post World War II boom years, US Real GDP grew as high as 12.8% in a year, but in the late 20th century 0-5% growth was more the norm.
US Real GDP Growth is now at -4.80%, compared to 2.10% last quarter and 3.10% last year, which is materially below the long term average of 3.18%. This GDP is sharpest drop since 2008 as governments and consumers responded to the new coronavirus.
I expect the second quarter will be worse.
I’ve been pointing out a few years now that this is the longest economic expansion in U.S. history as well as the longest bull market for stocks that was very aged.
But, after a -37% decline in the popular market proxy, the Dow Jones Industrial Average, the stock market is climbing a wall of worry.
Despite the negative GDP, the Dow Jones is up 2.7% today.
And the Dow Jones is now just -13.28% year to date, after starting 2020 up 3.55% and then crashing down -35% just a few weeks ago.
I have tactically operated through bear markets, so investors should be prepared for many significant swings along the way, but for now, it seems on March 24th stock prices reached a low enough point to attract buying enthusiasm that exceeds the desire to sell.
Of course, the buying enthusiasm may be mostly the Federal Reserve, but notwithstanding who is driving up prices, the trend is up for now.
The stock market is forward-looking, so what is, is.
Giddy up.
Mike Shell is the Founder and Chief Investment Officer of Shell Capital Management, LLC, and the portfolio manager of ASYMMETRY® Global Tactical. Mike Shell and Shell Capital Management, LLC is a registered investment advisor focused on asymmetric risk-reward and absolute return strategies and provides investment advice and portfolio management only to clients with a signed and executed investment management agreement. The observations shared on this website are for general information only and should not be construed as advice to buy or sell any security. Securities reflected are not intended to represent any client holdings or any recommendations made by the firm. Any opinions expressed may change as subsequent conditions change. Do not make any investment decisions based on such information as it is subject to change. Investing involves risk, including the potential loss of principal an investor must be willing to bear. Past performance is no guarantee of future results. All information and data are deemed reliable but is not guaranteed and should be independently verified. The presence of this website on the Internet shall in no direct or indirect way raise an implication that Shell Capital Management, LLC is offering to sell or soliciting to sell advisory services to residents of any state in which the firm is not registered as an investment advisor. The views and opinions expressed in ASYMMETRY® Observations are those of the authors and do not necessarily reflect a position of Shell Capital Management, LLC. The use of this website is subject to its terms and conditions.
I primarily focus on directional price trends, momentum, volatility, and investor sentiment. That is, until economic trends trend to extremes. Then I start observing these global macro trends.
We monitor thousands and data streams and time series with quantitative alerts that signal when these trends change. We are seeing many economic trends in uncharted territory.
US Retail Gas
The US Retail Gas Price is the average price that retail consumers pay per gallon, for all grades and formulations. Retail gas prices are important to view in regards to how the energy industry is performing. Additionally, retail gas prices can give a good overview of how much discretionary income consumers might have to spend. The current price is $1.87 which is below the average of $2.21 and near the prior lows in 2016 and 2009. In the late 1990s gas was around $1 and traded as high as $4 in 2007-08.
Texas Manufacturing Outlook Survey
The Dallas Fed conducts the Texas Manufacturing Outlook Survey monthly to obtain a timely assessment of the state’s factory activity. Companies are asked whether output, employment, orders, prices and other indicators increased, decreased or remained unchanged over the previous month. Responses are aggregated into balance indexes where positive values generally indicate growth while negative values generally indicate contraction. It’s at a new low, so the Texas Manufacturing Outlook Survey is in uncharted territory.
Richmond Fed Survey of Manufacturing Activity
The Survey of Manufacturing Activity is sent electronically to manufacturing firms that are selected for participation according to their type of business, location, and firm size. About 200 contacts receive questionnaires and approximately 90 to 95 of those surveyed respond in a typical month. Respondents report on various aspects of their business, such as shipments, new orders, order backlogs, inventories, and expectations for business activity during the next six months. It fell to a new low, so another has reached uncharted territory.
US Index of Consumer Sentiment
US Index of Consumer Sentiment is at a current level of 71.80, a decrease of 17.30 or 19.42% from last month. This is a decrease of 25.40 or 26.13% from last year and is lower than the long term average of 86.69. The US Index of Consumer Sentiment (ICS), as provided by University of Michigan, tracks consumer sentiment in the US, based on surveys on random samples of US households. The index aids in measuring consumer sentiments in personal finances, business conditions, among other topics. Historically, the index displays pessimism in consumers’ confidence during recessionary periods, and increased consumer confidence in expansionary periods. Consumer sentiment is materially below its long term average.
Since the index shows pessimism in consumers’ confidence during recessionary periods, in the next chart I highlight historical recessions in gray to illustrate.
Hey Crude… WTI Crude Oil Spot Price trended negative. WTI Crude Oil Spot Price is at a current level of -36.98, down from 18.31 the previous market day and down from 64.02 one year ago. Clearly, WTI Crude has reached uncharted territory.
WTI Crude Oil Spot Price is the price for immediate delivery of West Texas Intermediate grade oil, also known as Texas light sweet. It, along with Brent Spot Price, is one of the major benchmarks used in pricing oil. WTI in particular is useful for pricing any oil produce in the Americas. One of the most notable times for the WTI Crude Oil Spot Price was in 2008 when prices for WTI Crude reached as high as $145.31/barrel because of large cuts in production. However, because of the financial crisis and an abrupt loss of demand for oil globally, the price of WTI Crude fell as much at 70% off highs in January of 2009.
US Inflation Rate
The US Inflation Rate is the percentage in which a chosen basket of goods and services purchased in the US increases in price over a year. Inflation is one of the metrics used by the US Federal Reserve to gauge the health of the economy. Since 2012, the Federal Reserve has targeted a 2% inflation rate for the US economy and may make changes to monetary policy if inflation is not within that range. A notable time for inflation was the early 1980’s during the recession. Inflation rates went as high as 14.93%, causing the Federal Reserve led by Paul Volcker to take dramatic actions.
With commodities like gasoline and crude falling, it should be no surprise to see inflation trend down. US Inflation Rate is at 1.54%, compared to 2.33% last month and 1.86% last year. This is lower than the long term average of 3.23%.
10 Year Treasury Rate
10 Year Treasury Rate is at 0.67%, compared to 2.51% last year. The 10 Year Treasury Rate is the yield received for investing in a US government issued treasury security that has a maturity of 10 year. The 10 year treasury yield is included on the longer end of the yield curve. Many analysts will use the 10 year yield as the “risk free” rate when valuing the markets or an individual security. Historically, the 10 Year treasury rate reached 15.84% in 1981 as the Fed raised benchmark rates in an effort to contain inflation. The 10 Year Treasury Rate is in uncharted territory.
US Initial Jobless Claims has trended up with such magnitude I almost hate to show it.
US Initial Jobless Claims is at a current level of 4.427 million last week, a decrease of 810,000 or 15.47% from last week. US Initial Jobless Claims, provided by the US Department of Labor, provides underlying data on how many new people have filed for unemployment benefits in the previous week. Given this, one can gauge market conditions in the US economy with respect to employment; as more new individuals file for unemployment benefits, fewer individuals in the economy have jobs. Historically, initial jobless claims tended to reach peaks towards the end of recessionary periods such as on March 21, 2009 with a value of 661,000 new filings.
US Continuing Jobless Claims
US Continuing Jobless Claims is at a current level of 15.98M, up from 11.91M last week and up from 1.654 million one year ago. This is a change of 34.12% from last week and 865.9% from one year ago. I marked historical recessions in gray to show continuing jobless claims trend up in recession.
US Federal Reserve is in uncharted territory
The US Federal Reserve is taking massive action in attempt to fend off a crisis. We had seen unprecedented quantitative easing the past decade, but it was wimpy compared to what we are seeing now.
US Total Assets Held by All Federal Reserve Banks is the total value of assets held by all the the Federal Reserve banks. This can include treasuries, mortgage-backed securities, federal agency debt and and so forth. During the Great Recession, having already lowered the target interest rate to 0%, the Federal Reserve further attempted to stimulate the US economy by buying and holding trillions of dollars worth of US treasuries and mortgage-backed securities, a process known as Quantitative Easing or QE. This time, they are doing anything necessary.
US Total Assets Held by All Federal Reserve Banks is at a current level of 6.573 TRILLION, up from 6.368 TRILLION last week and up from 3.932 TRILLION one year ago. This is a change of 3.22% from last week and 67.18% from one year ago.
Federal Reserve Easing: Traditional Security Holdings is at a current level of 1.118T, up from 1.074T last week and up from 724.75B one year ago. This is a change of 4.07% from last week and 54.25% from one year ago.
So, you want to know if things are going back to normal anytime soon?
Maybe not.
But, the Dow Jones Industrial average declined -37% in a month and has retraced about half of the loss this past month.
The market climbs a wall of worry and during extreme times like this, markets do what you least expect.
We’ve been invested in stocks again the past few weeks, but only time will tell if we see the stock market trend back down, or reaches a new high.
Big bear markets swing up and down along the way to lower lows, so that’s what I expect is likely here. I operated successfully through both of the last two bear markets and trade the swings. It’s not as simple as an ON/OFF switch of existing at the peak, as we did in February, and then reentering at “the” low. Instead, for me, it’s a lots of entries and exits as it all unfolds.
We’ll probably see a reversal back down at some point, but we may not. If there’s anything I’ve learned the hard way, it’s don’t fight the Fed. But, Fed interference isn’t a sure thing, either. It doesn’t matter, for me, my process doesn’t require me to figure out what’s going to happen next. Instead, I know how I’ll take risks and when the risk/reward is more likely asymmetric. If the risks don’t pan out, I’ll cut my loss short and try again.
I’ve done it over and over and over again, which discipline.
I’ve been here before, many times. This is when I do things very different from the crowd and it has historically made all the difference. There is never any guarantee of the future, but I’m as ready as I’ve ever been. With the past experiences, I’m more prepared than ever.
I’m looking forward to it.
Let’s roll.
Join 520 other subscribers
Mike Shell is the Founder and Chief Investment Officer of Shell Capital Management, LLC, and the portfolio manager of ASYMMETRY® Global Tactical. Mike Shell and Shell Capital Management, LLC is a registered investment advisor focused on asymmetric risk-reward and absolute return strategies and provides investment advice and portfolio management only to clients with a signed and executed investment management agreement. The observations shared on this website are for general information only and should not be construed as advice to buy or sell any security. Securities reflected are not intended to represent any client holdings or any recommendations made by the firm. Any opinions expressed may change as subsequent conditions change. Do not make any investment decisions based on such information as it is subject to change. Investing involves risk, including the potential loss of principal an investor must be willing to bear. Past performance is no guarantee of future results. All information and data are deemed reliable but is not guaranteed and should be independently verified. The presence of this website on the Internet shall in no direct or indirect way raise an implication that Shell Capital Management, LLC is offering to sell or soliciting to sell advisory services to residents of any state in which the firm is not registered as an investment advisor. The views and opinions expressed in ASYMMETRY® Observations are those of the authors and do not necessarily reflect a position of Shell Capital Management, LLC. The use of this website is subject to its terms and conditions.
I woke up this Saturday morning to see #FloridaMorons trending on Twitter, so yes, being a Tampa Bay resident, I had to look.
I really like Twitter. Over the years, Twitter has become the modern day message board. A decade ago, professional money managers communicated our thoughts and ideas with each other via email or on private (password-protected) message boards. Today many of us similarly share our observations on Twitter. So, I have Twitter running on one of my screens most of the time.
I typically glance over at the “Trends for you”, after all, I do like trends, ya now. But, I’ve noticed the “trending” is typically “Politics”, even thought it’s a subject I follow the least. My observation is the trending political tweets have tended to be more left leaning, so it’s asymmetric, but not the asymmetry I am interested in. I’m more a libertarian, focusing on taking responsibility for my own and preferring to be left alone to do so. No, let me be more asymmetric on the matter: I’ll fight over it, to the death. You should expect nothing less from anyone joining the US military out of high school, even less of someone joining at 17 before graduation, needing the parents permission, and expect no less whatsoever from someone joining the US Marines. I knew what I was getting myself in to as a young man from a long line of Veterans, so I’m pretty serious about standing firm on what I believe in. If I was then, you can bet it’s only increased since then. But, although I’m a global macro tactical trader, I don’t worry too much about politics at the national level. I vote, and encourage others to, but the politicians don’t control my life and I don’t want them to. Actually, I won’t let them. It’s simple. They can keep increasing my tax bills and changing the rules of the game, but I keep focusing on the things I can change and move past them. I encourage others to do the same. Politics and politicians don’t define me and never will. Over my dead body, as my forefathers put it, and I continue to believe it. So, don’t waste your time trying to debate me about politics. Focus instead on what you can control and take responsibly for yourself. I’ll keep doing the same.
Here is an example today of “Trends for you” on Twitter. I notice most of them are political, so maybe I need to change my settings in the little gear you see at the top right, or remove the “Trends for you” from the page if it’s an option. But, if I didn’t hear from the other side, I wouldn’t have this missive to write about. In reality, I like seeing what the other side believes. It helps me to decide what I believe. If they make sense, I may change my mind. I’m always flexible and adapt my beliefs as circumstances change, but my core beliefs tend to stay the same, which is why they are “core.”
#FloridaMorons is trending, so let’s take a look at the trends from available data.
The trend is your friend until the end when it bends.
Florida Coronavirus Cases is at a current level of 24,119.00, up from 22,897 yesterday. This is a change of 5.34% from yesterday. The total number of cases initially trended up with great momentum, but since April the rate of growth slowed. To understand directional trends, we focus on the rate of change. I used a logarithmic chart as explained in “Quantitative Technical Analysis of the Coronavirus COVID – 19 Trend Shows the Rate of Growth is Slowing” to normalize the rate of change.
As the number of cases slow, politicians probably need to prepare to put Florida and the Unite States back to work and back to business. By now, most people are probably in panic mode and can’t believe I’d say such a thing. However, once a trend is underway and beings to show it may have reached an inflection point, it’s time to prepare for the next direction of the trend. Keep in mind, I pointed out the risks of Coronavirus and COVID – 19 early on as I believed it was an asymmetric risk and shared my observations on January 21, 2020: What could go wrong I shared this observation:
“What could go wrong?
There are always many things that can cause a market to fall. We’ve got a U.S. Presidential election this year, an impeachment, now a new virus.
So, there are always many things that could go wrong and be regarded as a catalyst for falling prices, but I focus on the direction of the price trend, momentum, volatility, and sentiment as my guide.
The direction of the price trend is always the final arbiter.”
Again, that was January 21st, when the CDC was about to announce the first death in the United States from the Wuhan Coronavirus, long before it seemed to be a major issue in the US.
“I’m not downplaying Cornonviris COVID-19 as the risks are real and it’s an asymmetric uncertainty. If we get it wrong, the risk of loss is substantial, and we just don’t know how it will unfold. What I do know is what I can control. Be prepared with situational awareness. What if it does become a pandemic? Prepare for the possibility as best you can, then let it all unfold.
I glance over headlines to see what the herd is thinking and doing, but I prefer analyzing the data myself, directly. So, I’ll continue monitoring the interactive web-based dashboard to track COVID-19 in real-time with the exceptional resource Coronavirus COVID-19 Global Cases by Johns Hopkins CSSE.
I’ve been monitoring it ever since and we eventually got the data feeds into our charting systems to draw our own charts.
Continuing to look at the trends in the data, the first cases of Coronavirus (COVID-19) were confirmed on March 1st, 2020, which occurred in Manatee and Hillsborough County. During the initial outbreak of Coronavirus in the United States, Florida’s public beaches and theme parks were under scrutiny as being areas of large crowds. The state was relatively late in issuing a “Shelter-At-Home” order, finally putting it in place beginning April 3rd, 2020. Cases ramped quickly from 2 on March 4th, to over 5000 by the end of the month.
When I analyze trends qualitatively, I first observe the absolute direction of the trend as I did above to determine is it up, down, or sideways. It’s also essential to define the rate of change to see if an uptrend is slowing, or speeding up. Momentum is pervasive is most data, no matter what it is, so increasing momentum means the strength of the trend is pervasive, so it’s probably going to continue by spreading. It’s true for stock price trends and also true for a pandemic. It’s all about people and our behavior, you see. So, I compare Florida to the US in terms of relative strength by drawing a percent change chart comparing the two data sets. Here, we see the month of March when both the US and Florida cases were trending up sharply. This time, I used the arithmetic chart instead of the logarithmic chart because we want to visually see the absolute difference between two percentage changes in growth.
The percent change in the rate of change in cases was actually trending similarly in terms of rate of change. Yeah, I could have left this one out. It’s like the relative strength of momentum, a second-order derivative or slope of the slope. Nevermind, just keep reading. I won’t go down that rabbit hole.
As of this writing, here is the table for Florida from my data source, which is the COVID Tracking Project. The data feed we get was last updated yesterday, Apr 17 2020, 18:00 EDT and will be updated again today at 18:00 EDT.
Let’s take a look at each of them.
Drawing trend lines is an essential basic skill for trend following to observe, visually, the direction of a trend. Here you can see I drew a few lines to note the change in trend a few times. The trend in new cases per day in Florida was slowing and even trending down, until yesterday, it spiked up after a spike down. Note that we can only track tests that a state reports. And not all states report all tests. As my focus here is a quantitative analysis, I’m not going to look for the answer to why the new cases dropped below trend and then spiked back up, but we could find the answer qualitatively by looking for the story. I know you proably perfer the story, it’s human nature, but I’m going to keep with obsevations of the quantitative trends.
Next up is the number of tests administered per day here in Florida. Again, we see a spike up in the trend.
And just like that, I start to notice something in the quantitative analysis that could be interpreted qualitatively to be some cause and effect relationship. Just like global macro trends in capital markets. As the number of new tests administered trended up, so did the number of cases per day.
I could go search to find a provocative sounding narrative to put here in an attempt to qualitatively explain why, but your guess is as good as mine for now. Quantitative analysis is looking at data and as long as we have a large enough sample size, the rates of change will normalize and be similar over time.
Well, actually, the above chart was a trick. I showed the trend in absolute terms, rather than a logarithmic scale which focuses on rates of change. When we normalize the data and compare these two, they remain in a sideways drifting trend, even with the jump. The momentum, or rate of change, isn’t enough to call it a break out.
Next up is deaths. The number of deaths viewed as a logarithmic chart is trending up, but the upward momentum seen before is slowing. The high lowers seem to define the trend here, with the higher highs showing some decline.
Florida deaths per day are trending up as expected. Naturally, the deaths and deaths per day will be on a lag after cases and hospitalizations. I drew a simple line around the center of the trend here just to show the uptrend and it isn’t slowing or stabilizing yet.
Florida coronavirus hospitalizations is showing a slowing rate of change, though in an uptrend.
Charting the test administered with the tests per day shows the per day tests slowing is gradually slowing down the test administered trend. I’m showing this to point out how some data will be leading, others will be lagging. The number of tests per day will change the bigger trend over time.
Finally, we get to the Florida Coronavirus death rate. Florida Coronavirus Death Rate is at 2.90%. The death rate is the most important trend.
Data is rarely perfect. But, garbage in, garbage out. I’ve had to explain the imperfections of data several times. Below is show the US death rates from two sources compared to Florida. I’m putting them on the same chart to point out a quick observation that the Johns Hopkins death rate is different from the COVID Tracking Project data we’ve used to track states.
I know you want perfection, and I know we won’t ever have it, so I modify your behavior with examples imperfections like this. Does it give you a whirl? Do you lose your train of thought? Does it make you believe not of this is useful if it’s imperfect? If so, you’re never happy with the outcomes of anything and unlikely have any edge in portfolio management. I embrace imperfections and the unknowable, which is what drives my active risk management and such.
Others are still trying to get it right, I just cut my loss short when I get it wrong.
Here in the sunshine states, we’ve now had 699 COVID – 19 deaths in Florida out of 24,119 cases reported.
Applying the formula:
Florida Coronavirus Deaths x 100.00 / Florida Coronavirus Cases = The Coronavirus Death Rate.
The Denominator
I keep hearing about “the denominator” and how it isn’t accurate. They say it as though we need an exact total number of cases. It simply isn’t true. Clearly, more and more accurate data is better than fewer data and less accurate data. However, we have now entered the realm of simple quantitative analysis.
Quantitative analysis (QA) is a technique that seeks to understand behavior by using mathematical and statistical modeling, measurement, and research. Quantitative analysts or “quants” aim to express a given reality in terms of a numerical value.
Qualitative research is a scientific method of observation to gather non-numerical data while focusing on meaning-making. When we do qualitative research, we are focused on trying to explain “why” what is, is.
The number of cases is still a sample size of the population, so the rate ofchange should be similar with a large enough sample.
People who wanted to minimize the virus have asked for the percentage of the population. It is true that as a percent of the population, the number of cases is so small the chart of the ratio isn’t so useful. There are about 331 million people in the US and US Coronavirus Cases are 699,706 according to Johns Hopkins Center for Systems Science and Engineering, so it’s less than 1%. In fact, it’s less than 1% of 1%.
Models Misbehaving
I’m sure there will be no shortage of criticism of the models attempting to predict things like hospital resource us such as the COVID-19 Projections from Institute for Health Metrics and Evaluation (IHME) that were widely used. The model had many assumptions, as any model would, and sometimes models get it wrong. Keep in mind, this model assumed social distancing, too, so it wasn’t a model misbehaving from our success in flattening the curve.
Below is an image I saved on April 11th, already showing Florida hospital resource use was improving.
Here it is today. Their educated guesses overestimated resource use, though it wasn’t a big surprised to me, since I paid attention to the wide range of possibilities they illustrated.
Here is their forecast of deaths in Florida along with actual deaths.
Should the governor of Florida allow people to go to Florida beaches? That’s for him to decide. It’s way outside my boat. I focus on my own boat. That’s his boat. If I don’t want to catch the virus at the beach, I simply won’t go to the beach. The Governor of Florida, however, has a bigger picture to consider than me. He’s got to factor in the potential stain on hospital and the healthcare industry, which have been lower than expected in many cases.
This has been a wonderful time to teach and learn maths, especially statistics and a little algebra (y = mx + b) and I hope everyone is taking advantage of it. My first interest in maths was sparked by probability and statistics. When I was a kid, I thought it was fascinating we could predict the likelihood of behavior or an outcome by having just a sample of a population.
What about the stock market?
It’s trending up, for now, and we’re participating in the uptrend, for now, but this too may change trend and when it does, so will I.
Don’t miss out:
Join 520 other subscribers
Mike Shell is the Founder and Chief Investment Officer of Shell Capital Management, LLC, and the portfolio manager of ASYMMETRY® Global Tactical. Mike Shell and Shell Capital Management, LLC is a registered investment advisor focused on asymmetric risk-reward and absolute return strategies and provides investment advice and portfolio management only to clients with a signed and executed investment management agreement. The observations shared on this website are for general information only and should not be construed as advice to buy or sell any security. Securities reflected are not intended to represent any client holdings or any recommendations made by the firm. Any opinions expressed may change as subsequent conditions change. Do not make any investment decisions based on such information as it is subject to change. Investing involves risk, including the potential loss of principal an investor must be willing to bear. Past performance is no guarantee of future results. All information and data are deemed reliable but is not guaranteed and should be independently verified. The presence of this website on the Internet shall in no direct or indirect way raise an implication that Shell Capital Management, LLC is offering to sell or soliciting to sell advisory services to residents of any state in which the firm is not registered as an investment advisor. The views and opinions expressed in ASYMMETRY® Observations are those of the authors and do not necessarily reflect a position of Shell Capital Management, LLC. The use of this website is subject to its terms and conditions.
Irving Fisher was probably considered, by some, to be one of the smarter people of his time. Fisher was an American economist, statistician, inventor, and Progressive social campaigner.
But, even with all his schooling at the turn of the century, he was just as silly as everyone else. In 1929, just before the -86% crash, he said:
“Stock prices have reached what looks like a permanently high plateau.”
– Professor Irving Fisher, October 15, 1929
At the time, US equity valuations had never been higher.
The moral of the story is; if you don’t have your mind right, you’re probably wrong.
Join 520 other subscribers
Mike Shell is the Founder and Chief Investment Officer of Shell Capital Management, LLC, and the portfolio manager of ASYMMETRY® Global Tactical. Mike Shell and Shell Capital Management, LLC is a registered investment advisor focused on asymmetric risk-reward and absolute return strategies and provides investment advice and portfolio management only to clients with a signed and executed investment management agreement. The observations shared on this website are for general information only and should not be construed as advice to buy or sell any security. Securities reflected are not intended to represent any client holdings or any recommendations made by the firm. Any opinions expressed may change as subsequent conditions change. Do not make any investment decisions based on such information as it is subject to change. Investing involves risk, including the potential loss of principal an investor must be willing to bear. Past performance is no guarantee of future results. All information and data are deemed reliable but is not guaranteed and should be independently verified. The presence of this website on the Internet shall in no direct or indirect way raise an implication that Shell Capital Management, LLC is offering to sell or soliciting to sell advisory services to residents of any state in which the firm is not registered as an investment advisor. The views and opinions expressed in ASYMMETRY® Observations are those of the authors and do not necessarily reflect a position of Shell Capital Management, LLC. The use of this website is subject to its terms and conditions.
Who would have believed a few months ago the United States of America and most of the world would be shut down over a global pandemic?
Who would have believed if you said Americans would be ordered to stay at home, not have family and friends visit, and to do this “social distancing” thing?
Anything is possible, as every new moment is unique, it’s never existed before.
Sure enough, ABC News Tampa Bay:
Florida golfers caught ignoring social distancing rules at golf course
Golf considered ‘essential’ in stay-at-home order
I’m starting to hear some talk about our freedoms as American’s, and I can see how many business owners being forced to shut down their businesses view it.
But, right now we’ve got to hunker down and get through this.
The good news is, it’s working.
Joining TODAY live, Dr. Anthony Fauci says that even though the number of deaths validate that this is a bad week in the coronavirus battle, there are “some glimmers of hope” such as stabilizing numbers of hospitalizations in New York. He says that social distancing and behavior changes are “starting to have a real effect” and that the virus death toll may look “more like 60,000 than the 100,000 to 200,000” initially predicted. He dismisses “conspiracy theories” that coronavirus death tolls are inflated and says he’s “cautiously optimistic” that the country may be able to begin reopening by summer.
Today there were 30659 new cases and 1757 new deaths in the United States
New York remains the epicenter of the US:
799 new deaths. Highest number of new deaths to date.
18,279 hospitalized, with a 200 net increase in the last day (lowest number in the last period). New ICU admissions: lowest number since March 19.
18 days since the stay at home order in New York
39 days since the first case in New York
80 days since the first case in the US
Here are the hot spots ranked by New Cases in the US from Worldometers:
Next, we rank them by Total Cases per 1 million of population: the trend is correlated to the total cases in these states with New York and the northeast leading the way and Louisiana is the only southern state ranked in the top ten. Georgia is next and even Florida is down there.
When we rank the Tests per 1 million population, however, we also see New York, Louisiana, and other states with a high Total Cases has given more tests per capita of their populations. My home state, Florida, is down there. Florida has tested about 0.8% of the population while New York is 2%. That’s a material difference, so I expect we may see Florida present a higher number of cases if we tested a similar sample size of the population.
Let’s move from ranking tables to observing the trends in charts.
If we look at the trend as a linear chart, New York Coronavirus cases is blowing away the other states with the most cases.
To quantify the trends, however, we instead draw a logarithmic chart to compare then based on rate of change. Now we see the trends normalized by their rate of change, which gives us a better visual of direction and velocity.
I added some more states next, to see the trends are generally trending similarly and their rates of change are correlated. My home state of Tennessee is actually slowing down more.
Looking at the US, the rate of growth continues to slow. It broke the uptrend (red arrow) about two weeks ago as social distancing ramped up more.
I’ve been concerned with New York as the epicenter since we have investment management clients there as well as many people and companies we do business with. I guess it’s a good thing trading at the New York Stock Exchange is mostly electronic, rather than traders in the pit shouting our orders. If it weren’t for electronic trading, the stock market would probably be closed.
Hang in there New Yorkers – you’re flattening the curve!
At this rate of change, we’ll see New York curve into a downtrend in the coming weeks.
The northeastern states of NY, New Jersey, Massachusetts, and Connecticut are flattening the curve. Connecticut, however, not quite as much.
The rate of growth in Florida total cases is rounding off, too.
So, we are observing the flatting of the curve as a result of social distancing.
Let’s hope it declines sharply in the next week or so before the citizens get too restless.
I’m not thrilled with the US death rate. US Coronavirus Death Rate is at 3.43%.
US Coronavirus Death Rate is at 3.43%, but so far it’s still materially less than other major countries and the world death rate, which is about 6%, according to the Johns Hopkins Department of Civil and Systems Engineering Coronavirus Tracker data.
Around the world, Italy is another country that is struggling, but their percentage change in recovering was their best change today.
Now that we have more data, I’m also monitoring Coronavirus Recoveries. Our complete data from other countries comes in around 10 PM at night, so I’ll have to wait for the next observations to share more detail on Coronavirus Recoveries. Here is what we have based on yesterday, expect we already have Italy. Recoveries is the trend we want to see rising with high momentum, and I’m happy to share the World, US, and Italy are in recovery uptrends and the US recoveries have high velocity.
I hope everyone has a wonderful long Easter weekend, Good Friday, and Passover. As a Christian, it’s Easter for me. Christianity’s most important day has similar main points as Passover. Both holidays face head-on the daunting power of death—and both announce God’s greater power of life.
Passover is a celebration of spring, of birth and rebirth, of a journey from slavery to freedom, and of taking responsibility for yourself, the community, and the world.
This year, it’s best to focus on the similarities between Easter and Passover. It’s not just that the Last Supper was a Passover Seder. Both holidays are about the dead rising to new life.
Mike Shell is the Founder and Chief Investment Officer of Shell Capital Management, LLC, and the portfolio manager of ASYMMETRY® Global Tactical. Mike Shell and Shell Capital Management, LLC is a registered investment advisor focused on asymmetric risk-reward and absolute return strategies and provides investment advice and portfolio management only to clients with a signed and executed investment management agreement. The observations shared on this website are for general information only and should not be construed as advice to buy or sell any security. Securities reflected are not intended to represent any client holdings or any recommendations made by the firm. Any opinions expressed may change as subsequent conditions change. Do not make any investment decisions based on such information as it is subject to change. Investing involves risk, including the potential loss of principal an investor must be willing to bear. Past performance is no guarantee of future results. All information and data are deemed reliable but is not guaranteed and should be independently verified. The presence of this website on the Internet shall in no direct or indirect way raise an implication that Shell Capital Management, LLC is offering to sell or soliciting to sell advisory services to residents of any state in which the firm is not registered as an investment advisor. The views and opinions expressed in ASYMMETRY® Observations are those of the authors and do not necessarily reflect a position of Shell Capital Management, LLC. The use of this website is subject to its terms and conditions.
I respect history. The past is no guarantee of future results, but it’s all we have to draw statistical inference from, so we need to understand its risks and rewards. We use past data to determine future possibilities. If we don’t know where we’ve been, we unlikely know where we’re going. It’s essential to have a deep understanding of time, the past, the present, and the future that doesn’t exist. I have great respect for the past, but I’m always here, now, at this moment. As a professional decision-maker, I can only do something now or not now. I can’t do anything in the past. I can’t do anything in the future. It’s now, or not. This alone has removed a lot of behavioral issues for decision making. I review historical trends and my decisions, but I don’t get stuck there at a time I can’t actually do anything. It is what it is, so I accept it and learn from it. If we want to learn from the past, we necessarily must know what it was. That’s why I observe charts of price trends, investor sentiment, global macroeconomic trends, volaltity, and momentum.
A global macro strategy is a hedge fund style investment and trading strategy typically focused on the overall economic and political views of various countries or their macroeconomic principles. Positions in a global macro portfolio may include long and short positions in various equity, fixed income, currency, commodities, and other alternatives like volatility. Although most global macro hedge fund strategies may be focused on views of macroeconomic trends, my focus is on directional price trends.
The price trend is the final arbiter, if you keep disagreeing with the trend, you’ll lose.
The longer you disagree with the trend, the more you lose.
Other indicators like sentiment, rate of change (momentum/relative strength), and volatility are confirming indicators for the price trend. For me, they signal when a trend may be reaching an extreme, becoming more likely to reverse. I like to be positioned in the direction of the price trend, but I’m situational aware of when the trends may be reaching an extreme and likely to result in a countertrend.
So, let’s see what in the world is going on. I concentrate on what has changed. If a trend or level hasn’t changed, it doesn’t warrant the attention, so my systems signal when something has changed. I then examine the rate of change, which is why I speak of momentum, velocity, and relative strength. The trend tells us the direction of change, but the rate of change indicates how fast it’s changing.
Investor Sentiment: are investors bullish, feeling positive about the future direction of stock price trends? or bearish, feeling stock prices will fall?
US Investor Sentiment, % Bullish is an indicator that is a part of the AAII Sentiment Survey. It indicates the percentage of investors surveyed that had a bullish outlook on the market. An investor that is bullish believes the stock market will trend higher. The AAII Sentiment Survey is a weekly survey of its members which asks if they are “Bullish,” “Bearish,” or “Neutral” on the stock market over the next six months. The percent of bullish investors is slightly below average, so the bullish individual investors haven’t really changed much.
US Investor Sentiment, % Bearish is at 49.73%, compared to 52.07% last week and 27.20% last year. Pessimistic investor sentiment materially higher than the long term average of 30.4%, so this is a change. Individual investors are generally more bearish than they were. When their bearishness reaches a historical extreme, they’ll likely be wrong. As you see in the chart, investors are abnormally negative on the future of stock price trends right now.
The stock market will reverse its current trend when prices are pushed down to a low enough point to attract new buying demand.
Stock prices will also reach their bottom when investors who want to sell have sold, so there is no overhead resistance.
Nothing tells us more about market dynamics better than the price trend itself, but investor sentiment measures like AAII Investor Sentiment Survey indicates if do-it-yourself individual investors are capitulating. When their bearishness is at a historical high it may confirm with the price trend those who want to sell have probably already sold. So, their desire to sell has less impact on an uptrend.
If most of the investors with a desire to sell have already sold they won’t be selling as prices trend up, so the market will have less resistance as it trends up. For example, the S&P 500 stock index had gained nearly 5% in the first two months this year. It peaked on February 19th. then all hell broke loose. The S&P 500 dropped -34% in just three weeks, so the S&P 500 was down -31% for the year at that point.
Some of the selling pressure was driven by systematic trading, such as trend following and momentum. As rules-based systematic trading pushed prices lower and lower, other investors were panic selling to avoid more losses. The trouble is, individual investors tend to sell into the bloodbath when prices reach their lowest points. Emotional reactions are driven by falling prices. People sell because prices are falling and they are losing money. Systmatic rules-based systems also sell to avoid more loss, but do so based on predefined exits to manage risk and drawdown controls.
What I observed in the early stage of this waterfall decline is what seemed to be an overreaction from an initial under-reaction.
At the peak on February 19th, here is what the stock index looked like as it trended to an all-time high. This is three months of history. What I noticed, then, was the relative strength indicator didn’t follow it up. This was a very negative divergence.
At the same time, I was seeing other bearish signs of a major market top. To be sure, here are the observations I shared in January and February.
But, fortunately, I acted on it. Seeing a very bullish cover of one of my favorite investment publications was the final straw, along with all the other things I observed that seemed to signal a major top in stock prices.
I don’t always sell my stocks because the market risk seems elevated, but when I do it’s because the weight of the evidence is overwhelming.
But, it didn’t work out perfectly and it never does, so I don’t have an expectation of perfection. If I did, I could have never created the asymmetric risk/reward return profile I have, especially the downside risk management and drawdown control. It’s an imperfect science with a dash of art.
I’m okay with that.
Asymmetric investment returns are created from a positive mathematical expectation, not being right more often than wrong, but instead losing less when I’m wrong and earning more when I’m right. The rest of you are simply focused on the wrong thing. You want to be right, and it ain’t happin’. I’m not right all the time, either. But when I’m wrong, I cut it short. I don’t let the wrong become really wrong. I take the loss. I love taking losses. I do it all the time. It’s how and why I have smaller losses, rather than large ones. It’s the only Holy Grail that exists. The Holy Grail is asymmetry: larger average gains than losses. This positive mathematical expectation doesn’t require me to know the future and be right all the time. Instead, I focus on what I can actually control, and that’s mainly the size of my losses. If I limit the size of my losses, I’m left to focus on the upside of profits. That’s my edge, and it isn’t just a mathematical edge, it’s a psychological edge, a behavioral edge. It’s not easy to execute for most people because you want to be right, so you’ll hold those losses hoping they’ll recover. If they do and the price trends back up, then you may sell, if you remember you wish you had before at those higher prices, before you saw a -30% loss.
That’s resistance.
If you wait to sell when the price trends back up some, you’re selling creates resistance if there are enough of you driving the volume of selling pressure. If you instead feel more bullish now that prices trended up some, you may hold on, hoping it continues up. In that case, you’re not the overhead resistance at higher prices causing the halt that prevents the price from trending higher. If enough volume is like you, prices will keep trending up because the rising prices aren’t met with a stronger desire to sell than the enthusiasm to buy.
Here is the full -34% downtrend. It was the fastest downtrend of this magnitude in history.
What in the world was going on? The first leg down, which we only know in hindsight it was the “first”, was a sharp downtrend of -13%. The stock market falls so far, so fast, it becomes deeply oversold with the relative strength index at only 19. The relative strength of 30 is low. Below 30 is oversold and below 20 is extremely oversold. Under normal circumstances, this results in a short term bounce at a minimum, and when I say normal, I’m talking about looking at over a century of history.
To make the point clear, using a simple measure of relative strength as an indicator in the lower section of the chart below, the last times it reached such an oversold level were the lows in late 2018.
But, if you notice, the second time the SPX got so oversold in 2018, the price trend was significantly lower. So, the risk of a countertrend signal like this is even after the price trend reverses back up, it may later reverse back down to an even lower low. It did then, and it did it again this time.
To illustrate what happened from there, I’ve marked up the next chart pretty well. Keep in mind, I don’t necessarily trade the S&P 500 index. I’m simply using it as a proxy for the overall market. I focus more on more granular ETFs like sectors and individual equities. To see the trends play out, walking through time, the first part is the red vertical arrow to point out the first level of extreme oversold conditions as the stock market dropped -13%. My managed portfolio was in short term US Treasuries during this because I hold sold weeks ago.
So, because of my risk management from elevated risk levels, we were in a position of strength, as I call it. I mean we were not participating in the -13% waterfall decline, so as others (who are losing money quickly) are getting more and more bearish, I’m getting bullish. Once stocks got oversold, however, I invested in stocks again. Of course, you can see what happened afterward. The next leg down was even worse and we got caught in it. Like I said, my tactical trading decisions are never perfect timing, nor does it have to be. I just need my average profits to be larger than my average losses to create positive asymmetry. I eventually reduce risk exposure again to zero and then I’m back to looking to buy again, which I have. This is for educational purposes, so I’m leaving out all the other things going on, too, such as buying US Treasuries, etc. The point is, this is what in the world was going on.
Looking at the chart again, a few more points to make. Notice the two red horizontal lines I drew are showing a price range that could be resistance. I say that because of 1. it’s the first area of a prior high, so those who wish they’d sold there may sell now. 2. the relative strength is now at its halfway point and specifically, its average level, so we may see some mean reversion. We’ll see.
On the bullish side, however, just as individual investors are really bearish, I’m seeing some divergence again in the price momentum. The green arrow shows it. As the stock market reached a low, down -34% off its high, the momentum didn’t make a new low. It didn’t even reach the prior low or even close to it. Instead, it’s making a higher low and higher high.
If I claim the February divergence was bearish because the relative strength didn’t confirm the all-time new high, then I’ll also claim the opposite is true: this is a bullish divergence.
What’s going to happen next with the US stock market?
We’re about to find out!
Only time will tell, but from what I’m seeing, the crowd is expecting a retest of the lows or even lower lows, and that seems reasonable. A global recessional is imminent at this point. But, the stock market has already fallen -34% from its high, so anything is possible. This could be it, for all we know. If most people believe it will get worse, the capital markets have a funny way of proving the crowd wrong. At least temporarily, as it’s doing right now. But, the big picture isn’t real positive.
We now have unprecedented jobless claims and unemployment. American’s are going to be hurting without jobs. That chart is so ugly I don’t want to show it.
We also have unprecedented intervention from the federal government and the Federal Reserve. So have central banks around the world responded.
I believe the last five years of this bull market and economic expansion were driven by the Federal Reserve Zero Interest Rates Policy and other forms of quantitative easing. What was then unprecedented Fed action drove the longest bull market and economic expansion in US history. It also drove the stock index to its second-highest price to earnings valuation in 140 years. I’ve pointed out many times before the Shiller PE Ratio for the S&P 500 was over 30 and the only time it was “more expensive” was the late 1990s. That didn’t end well. It was higher than 1929 just before the Great Depression.
The S&P 500 Shiller CAPE Ratio, also known as the Cyclically Adjusted Price-Earnings Ratio, is defined as the ratio of the S&P 500’s current price divided by the 10-year moving average of inflation-adjusted earnings. The metric was invented by American economist Robert Shiller and has become a popular way to understand long-term stock market valuations. It is used as a valuation metric to forecast future returns, where a higher CAPE ratio could reflect lower returns over the next couple of decades, whereas a lower CAPE ratio could reflect higher returns over the next couple of decades, as the ratio reverts back to the mean.
The S&P 500 Shiller CAPE Ratio was at a high level of 33, which was higher than the long term average of about 17. Today is has declined to 25.42, while still well above an “overvalued” level, it could be justified by the low inflation we are seeing. Right now, we are looking at deflation as prices of stuff are falling.
I don’t have to correctly predict with the direction the stock market will trend next. I instead increase and decrease exposure to the possibility of risk/reward aiming for asymmetric risk-reward. I tactically trade the cycles and swings as I’ve done many times before. We achieve an asymmetric risk-reward when the downside potential is less than the upside. We achieve asymmetric investment returns when our average profits exceed our average losses. I call it ASYMMETRY® and everything I do centers around it.
Do you really want to know the harsh reality of what the stock market is going to do next?
Mike Shell is the Founder and Chief Investment Officer of Shell Capital Management, LLC, and the portfolio manager of ASYMMETRY® Global Tactical. Mike Shell and Shell Capital Management, LLC is a registered investment advisor focused on asymmetric risk-reward and absolute return strategies and provides investment advice and portfolio management only to clients with a signed and executed investment management agreement. The observations shared on this website are for general information only and should not be construed as advice to buy or sell any security. Securities reflected are not intended to represent any client holdings or any recommendations made by the firm. Any opinions expressed may change as subsequent conditions change. Do not make any investment decisions based on such information as it is subject to change. Investing involves risk, including the potential loss of principal an investor must be willing to bear. Past performance is no guarantee of future results. All information and data are deemed reliable but is not guaranteed and should be independently verified. The presence of this website on the Internet shall in no direct or indirect way raise an implication that Shell Capital Management, LLC is offering to sell or soliciting to sell advisory services to residents of any state in which the firm is not registered as an investment advisor. The views and opinions expressed in ASYMMETRY® Observations are those of the authors and do not necessarily reflect a position of Shell Capital Management, LLC. The use of this website is subject to its terms and conditions.
Surgeon General Jerome Adams said Sunday that this week could be the nation’s “hardest and saddest” thus far. “This is going to be our Pearl Harbor moment, our 9/11 moment, only it’s not going to be localized,” Adams said.
As a US Marine Corps Veteran myself, of course, calling this a WAR is in no way minimizing a real combat zone our great nations warriors have endured for generations. But this IS a WAR in my option, it’s just a very different kind of WAR against an invisible enemy. It’s a kind of asymmetric warfare, as opposed to the traditional combat threats. We are under attack right here in our own communities and it’s our turn to do the fighting, but the way we attack it isn’t the same as how it attacks us. The good news is, fighting and winning this WAR is relatively simple.
In US we have 12,844 deaths from coronavirus and 396,223 confirmed cases. The entire east coast is now red on the map from Coronavirus COVID-19 Cases Tracker by the Center for Systems Science and Engineering (CSSE) at Johns Hopkins University (JHU).
In Quantitative Technical Analysis of the Coronavirus COVID – 19 Trend I said I expect to see the speed of new Coronavirus COVID – 19 cases to increase exponentially, I’m going to start sharing my observations on it from the lens of a “quant” and a technical chartist. I was planning to have already shared some observations, but I found some issues in the state level data that have now been resolved. Of course, all of the data we are reviewing is deemed to be reliable but none of it is guaranteed. I believe it’s clear the US and the world were not well prepared for a pandemic of this magnitude, which is disappointing considering leaders like George W. Bush and Bill Gates warned of it years ago.
I’m concerned many American’s will become overwhelmed at the sheer speed of the growth of coronavirus in the next week. Although I’m seeing some evidence the rate of change has slowed as a result of “social distancing” and such, it’s still spreading very fast as expected. The key is to realize it is expected, so don’t be too alarmed. I’m going to share some charts for a visual of what is going on with the trend and rate of change. I’ll also share how we are combating it here at the Shell compound. If you haven’t already, I encourage your to read my prior observation Quantitative Technical Analysis of the Coronavirus COVID – 19 Trend since I”m not going to repeat myself here.
I’m taking a top down Global Macro approach to looking at the trends and momentum, just as I review price trends of global capital markets.
As you will see the data source noted in the charts, we are pulling in world and US data from Johns Hopkins Center for Systems Science and Engineering and for state level data from The COVID Tracking Project. I’ve also been monitoring other data sources such as the model referenced in a White House press briefing as the “Chris Murray Model,” which is IHME’s COVID-19 projections show demand for hospital services in each state. The demand for these services is expected to exceed capacity soon, so we’ll take a look at it. I’ve been in touch with quantitative analyst, data scientist, etc. all over the country discussing some of this so it’s been nice to see such solidarity as we enter the early stages of this battle. But, this WAR isn’t just going on here in the United States, it’s a pandemic all over the world and humans are all fighting it.
World Coronavirus Cases: 1.381 million for Apr 07 2020
Coronavirus (COVID-19) is a global pandemic that originated in Wuhan, China in 2019. The virus sparked a global economic slowdown because of various countries including China, Italy, and Iran having more than 1000 deaths within the first few months of the virus emerging. The virus also caused many countries to provide fiscal and monetary stimulus. For example, in the United States, the Federal Reserve conducted two surprise rates cuts to lower the Federal Funds rate to nearly 0%. Additionally, parts of the world implemented a complete lockdown of cities to prevent the spread of the virus. The Coronavirus pandemic eclipsed 10,000 cases on February 1, 2020, and 100,000 cases on March 6, 2020.
World Coronavirus Cases is at a current level of 1.381 million, up from 1.345M yesterday. This is a change of 2.67% from yesterday. I’m drawing the charts with a logarithmic scale to illustrate the trend as percentage moves for spacing, rather than number of cases, so a log scale emphasizes the rate of change in a way that linear scales do not.
Unfortunately, in the US, we are leading the world in the number of cases.
The rate of change and trend in China, where it originated, has supposedly slowed down. Here is China’s reported total cases and deaths.
If China is reporting their data accurately, we can see the cases reported per day and deaths per day have trended down the past few weeks.
When we compare data and directional trends, it’s sometimes useful to view a relative comparison to see who trends compare across countries, in this case. Below is the death rate of the world relative to China. The current death rate at the world level is 5.67% while China’s reported death rate has stabilized at 4% for weeks. We shouldn’t be alarmed by the death rate of other counties and around the world, however, since different countries have varying ages of population and health care. I expect to see some divergence.
The United STATES of America
Let’s look at the states. Keep in mind the data isn’t perfect. Since the Centers for Disease Control and Prevention hasn’t yet begun publicly releasing the number of people who have been tested, The COVID Tracking Project is pulling data from state health departments, which can vary in the way they report tests and infections. This COVID Tracking Project was launched out of The Atlantic to fill a major gap in publicly available COVID-19 testing data. Johns Hopkins University maintains a comprehensive case count, but no governmental or institutional source is publishing complete testing data—including not just identified cases, but how many people have been tested, and where. Without this data, we can’t make informed decisions or accurately communicate risks.
Which states have seen the most cases of coronavirus?
Here are the relative trends of New York, New Jersey, and Michigan on a log scale. Notice the rate of change is slowing.
I drew some trends lines to see the slope changing around April 1st in New York.
I put the New York number of tests administered, hospitalizations, and death rate on one chart.
New York is expected to reach its peak resource use tomorrow. I’m going to keep this observation high level and brief without getting into too much weeds, but the next image is from IHME’s COVID-19 projections. They show demand for hospital services in each state. The demand for these services is expected to exceed capacity. Tomorrow, New York is expected to have a hospital bed shortage of 12,476 beds and a shortage of 5,946 ICU beds. IHME predicts 5,664 ventilators will be needed. Keep in mind, this is their educated guess, so their projections may not prove accurate, but we’ll find out soon.
The numbers for All beds needed and All beds available include ICU beds.
All beds available is the total number of hospital beds available for COVID patients minus the average historical bed use.
ICU beds available is the total number of ICU beds available for COVID patients minus the average historical ICU bed use.
Invasive ventilators needed does not account for the number of ventilators available (ventilator capacity data are not available at this time).
Taking a closer look at the bell shaped curve in the chart, notice there is a colored range around the dotted lines. It’s like the cone of uncertainly we see late summer for hurricanes here in Florida. It shows a range of possible outcomes.
Uncertainty is the range of values that is likely to include the correct projected estimate for a given data category. Larger uncertainty intervals can result from limited data availability, small studies, and conflicting data, while smaller uncertainty intervals can result from extensive data availability, large studies, and data that are consistent across sources. The model presented in this tool has a 95% uncertainty interval and is represented by the shaded area(s) on each chart. The range of outcomes is necessarily wide because of the asymmetric uncertainty. The truth is; we just don’t have a lot of data and information yet, so we make the best of what we do have.
A major concern is the shortage of hospital beds and ventilators, so it’s essential to fight this WAR by simply staying at home and distancing from others for a while. We have clients in New York, so I hope everyone is hunkered down to slow the spread.
Next up is my current home state of Florida. I included all of the data expect the death rate and I see a lot of uptrends.
The death rates are around 2% to 4% at this point. I included the US, New York, and Florida.
Going back to hospital resource use, here is the projections for the US. The country is expected to reach peak resource use a week from now. According to the projections, there will be a significant shortage of beds and ventilators. I don’t want to be alarming, this simply tells us the best way to fight this WAR is to avoid it. We don’t want to be the one needing a ICU bed or ventilator, so we have a choice to avoid it by distancing.
I’m most concerned about Florida. Not because I live in Tampa Bay, but because we have an older population of retirees across the state. I also see evidence of strong infections in Miami-Dade, thanks to spring breakers from New York.
In Florida, we were issued a stay at home order on April 3rd and non-essential services are closed. Florida is expected to reach peak resource use two weeks from today on April 21st, later than most of the country. The good news is, if their projections are accurate, we don’t have as much of a shortage probability here. I supposed Gods waiting room has more beds and such. But we are expected to have a shortage of ventilators.
The possibility band for Florida, however, is tall, which means it could be much higher.
Since we’re looking at Florida, this brings me to another data source I’ve been monitoring. As I discussed in more detail in my last post on COVID – 19, one of the most interesting data I’ve seen is the U.S. health map from Kinsa smart thermometers. The Cumulative Atypical Illness map shows the amount of cumulative unexpected illness, expressed as additional share of the population affected by influenza-like illness, above the expected values.
This is how much influenza-like illness above the normal expected levels they have detected since March 1st. The hot spots are the northeast, Michigan, and south Florida. But, we’re now seeing more red ares all over.
When someone who is using a Kinsa smart thermometer with their phone to track the data, it shows up as atypical when their fever is above what is expected.
The time series chart allows us to compare Kinsa’s observations of the influenza-like illness level in the U.S., in orange and red, against where we’d expect them to be, in blue, and see how that relationship has changed over the past few weeks. The red zone were I drew the arrow below was an early warning of what is likely to be Coronavirus.
The good news is the observed data has trended below expected now and we attribute it to social distancing.
Inder Singh is the founder & CEO of Kinsa. Kinsa’s mission is to create a real-time map of human health to track — and curb — the spread of infectious illnesses Inder wrote an article on Medium last week titled “Your Sacrifices are Saving Lives” showing how their research finds social distancing is working. If you need to see the evidence, I encourage you to read it.
I don’t like what I’m seeing here in Florida. Take a look at how high the atypical illness trend was recently. The slope was high and steep. At its peak on March 18th, the atypical illness detected was about 7 and the expected range was 2.5, it was about 300% higher that expected. This data tends to be a week or two ahead of new cases.
Miami-Dade, Broward, Palm Beach County, Duval, and Orange county look similar.
So, the Coronavirus is just getting ramped up and will spread more in the coming days and weeks. It’s probably going to be alarming to many, especially the deaths.
Some good news is 300,000 have recovered.
WE ARE AT WAR
If you want to win this WAR, it’s a matter of distancing and treating everything like it’s infected. Just like the markets, people initially underreact, then they panic because they underreacted, then they overreact.
It reminds me of Maslow’s Hierarchy of Needs as we are all focused on the bottom two right now, no matter who you are or how much money we have. Health, air, water, employment, and personal security are top of mind.
Are we wining the WAR?
David Ingles at Bloomberg shared this chart and points out one ratio to watch is recoveries to infections. A rising trend is good, a declining trend is bad.
OUR BATTLE PLAN
Here is what we are doing at Camp Shell.
We had already started stocking extra bottled water and food, which we would have done anyway in preparations for hurricane season.
It’s mainly been business as usual for us. The only thing different is we aren’t going out to eat with friends or the grocery store. I haven’t left in a car in two weeks, but we still do our daily walk with the dog and cycle for exercise.
We have gloves, masks, and even suits if necessary.
We’ve stopped bringing the mail and packages in through the front door and instead take them into the garage. We put on gloves to handle them and open them. We open all mail and packages at the trash can in the garage and then wipe it all down with spray and then clean off our rubber gloves. We treat it like it’s infected with a deadly virus. Better safe than sorry. We throw away the mail after anything important is scanned using our iPhone and the Dropbox scanner. Nothing comes in without being wiped down. When we need groceries, we order it online from Publix and they deliver. We handle the groceries the same – nothing enters Camp Shell without being wiped down.
It’s very simple.
If we do this and keep social distancing in the days and weeks ahead, we’ll likely avoid the enemy and win the WAR.
This is a relatively easy WAR to win if you want to win it. As with any combat situation, find the weak link and make is strong.
I hope you are taking this seriously and doing the same.
WE WILL WIN THIS.
It reminds me of US Marine Recon: Swift, Silent, and Deadly.
SEMPER FI
Mike Shell is the Founder and Chief Investment Officer of Shell Capital Management, LLC, and the portfolio manager of ASYMMETRY® Global Tactical. Mike Shell and Shell Capital Management, LLC is a registered investment advisor focused on asymmetric risk-reward and absolute return strategies and provides investment advice and portfolio management only to clients with a signed and executed investment management agreement. The observations shared on this website are for general information only and should not be construed as advice to buy or sell any security. Securities reflected are not intended to represent any client holdings or any recommendations made by the firm. Any opinions expressed may change as subsequent conditions change. Do not make any investment decisions based on such information as it is subject to change. Investing involves risk, including the potential loss of principal an investor must be willing to bear. Past performance is no guarantee of future results. All information and data are deemed reliable but is not guaranteed and should be independently verified. The presence of this website on the Internet shall in no direct or indirect way raise an implication that Shell Capital Management, LLC is offering to sell or soliciting to sell advisory services to residents of any state in which the firm is not registered as an investment advisor. The views and opinions expressed in ASYMMETRY® Observations are those of the authors and do not necessarily reflect a position of Shell Capital Management, LLC. The use of this website is subject to its terms and conditions.
Prior to the volatility expansion that started a month ago, my mantra was:
Periods of low volatility are followed by volatility expansions.
The other side to it is:
Periods of high volatility are followed by volatility contractions.
Yes, indeed, after the CBOE S&P 500 Volatility Index (VIX) shattered it’s former all-time high when implied volatility spiked to 83, it is now settling down retracing about half of what it gained. For now, it’s a volatility contraction.
For a closer look, here is the trend zoomed in to the one year chart.
The stock market as measured by the S&P 500 made a solid advance today by any measure. According to Walter Deemer, today was a 90.3% upside day with 2732 advances and 276 declines. So far, March 23rd was the lowest point and the stock market is trying to recover some of the losses. The day after the low was March 24 was a 93.9% upside day with 2791 up and 244 down, which was even stronger. So, the advance off the low is showing some thrust, but only time will tell if it can continue, or if this is just an oversold bounce.
Getting more technical with the charting, the candlesticks show some bullish patterns. However, the S&P 500 has already reached the mid way point in my momentum measures were I expect if it’s going to stall, this is where it happens.
US Initial Jobless Claims last week was off the charts. Provided by the US Department of Labor, US Initial Jobless Claim provides underlying data on how many new people have filed for unemployment benefits in the previous week. Given this, one can gauge market conditions in the US economy with respect to employment; as more new individuals file for unemployment benefits, fewer individuals in the economy have jobs. Historically, initial jobless claims tended to reach peaks towards the end of recessionary periods such as on March 21, 2009, with a value of 661,000 new filings.
US Initial Jobless Claims is at a current level of 6.648M, an increase of 3.341M or 101.0% from last week. This is an increase of 6.436M or 3,004% from last year and is higher than the long term average of 353698.
If there was anything we learned from the last 11 years is the truth behind the axiom “don’t fight the Fed.” Fed intervention and the passage of a record-breaking $2.3 trillion US fiscal stimulus has supported fragile consolidation across many markets, including Treasuries, agency mortgage-backed securities and money markets.
A global recession is now imminent.
They won’t call it for another year or two, but I will now. We’ll see negative GDP growth across the world, although it may well recover as sharply as it fell. Once restaurants, etc. finally open back up, they will be in high demand. So, if restaurants can hang in there, there will be brighter days ahead. Right now, we just don’t know how long it may take.
As for the Coronavirus and data, we’ve discovered many issues with the data being reported by states. I’ve been monitoring it waiting for some improvements before sharing any more quantitative analysis.
This ain’t my first rodeo riding a bucking bear. I operated successfully through the 2008-09 bear market as well as the 2000-03 bear market. Both of them included ugly recessions with people losing their jobs, etc.
This one will be worse. But, again, there’s also a good chance the recovery is just as stunning as the waterfall decline.
So, stay tuned.
Periods of high volatility are often followed by volatility contractions and that’s what we’re seeing now. However, it is highly likely we won’t be seeing a VIX at 12 anytime soon as I expect elevated implied volatility for a long time, driven by demand for hedging with options. It’s likely to be similar to post 1987 when the risk of a price shock remains price into options.
I’ve got a lot more to share, but timing is everything.
Don’t miss out, we’ll automatically send you an email of new ASYMMETRY® Observations by entering your email below.
Mike Shell is the Founder and Chief Investment Officer of Shell Capital Management, LLC, and the portfolio manager of ASYMMETRY® Global Tactical. Mike Shell and Shell Capital Management, LLC is a registered investment advisor focused on asymmetric risk-reward and absolute return strategies and provides investment advice and portfolio management only to clients with a signed and executed investment management agreement. The observations shared on this website are for general information only and should not be construed as advice to buy or sell any security. Securities reflected are not intended to represent any client holdings or any recommendations made by the firm. Any opinions expressed may change as subsequent conditions change. Do not make any investment decisions based on such information as it is subject to change. Investing involves risk, including the potential loss of principal an investor must be willing to bear. Past performance is no guarantee of future results. All information and data are deemed reliable but is not guaranteed and should be independently verified. The presence of this website on the Internet shall in no direct or indirect way raise an implication that Shell Capital Management, LLC is offering to sell or soliciting to sell advisory services to residents of any state in which the firm is not registered as an investment advisor. The views and opinions expressed in ASYMMETRY® Observations are those of the authors and do not necessarily reflect a position of Shell Capital Management, LLC. The use of this website is subject to its terms and conditions.
My expertise is the quantitative and technical analysis of trends, momentum, countertrends, and volatility as well as tactical risk management and hedging. As the investment manager of ASYMMETRY® Global Tactical and ASYMMETRY® Managed Portfolios, professionally, I apply it to global market price trends for portfolio management. The methods and systems are robust, so the skills can be applied to understand trends of a pandemic, too.
Since I expect to see the speed of new Coronavirus COVID – 19 cases to increase exponentially, I’m going to start sharing my observations on it from the lens of a “quant” and a technical chartist.
I’m concerned many American’s will become overwhelmed at the sheer speed of growth.
It’s going to happen, but we have to put it into perspective. I’m going to help.
It’s essential to look for the logical fallacy of the herd and consider how they may be wrong. A logical fallacy is a flaw in reasoning. Logical fallacies are like tricks or illusions.
The herd gets trends wrong at extremes, then become shocked by the staggering swing the other way. The trend and momentum of this virus isn’t a lot different than capital markets as it contains a fundamental, in this case, physical science element, and a whole lot of human emotion and behavior.
Just like capital markets.
People initially underreact, then they panic because they underreacted, then they overreact.
We’re seeing it now. I know people who initially laughed it off, now those same people have swung to the extreme on the other side. If you underreact, you’re likely to overreact and panic.
This pandemic is spreading at an exponential rate with no significant risk management or drawdown control tools to apply except for social distancing. For example, in investment management, we can hedge our positions or exit early to avoid more losses. Here, the risk management is to avoid contact with other people. Why? because this is an ASYMMETRIC UNCERTAINTY, as there are many parts of it we are unsure about such as whether contagious asymptomatic carriers exist. Asymptomatic carries are those not yet showing symptoms who are infected and don’t know it yet. In “Authorities should use data science tools to be precise in QUARANTINE mandates” I discuss how we can use asymptomatic data from digital thermometers as an early warning sign.
If someone has it and doesn’t show symptoms, they spread it unknowingly. So, we don’t know if taking temperatures at airports and such has any impact at this time.
It seems the most critical issue right now is N95 masks and protective supplies for our Physicians and medical professionals. This is their time and we need to support them. The next issue seems to be a ventilator shortage, and that’s a big one. If hospitals reach their capacity, especially with a limited number of ventilators, the death rate will increase, with nothing else to slow or stop it but social distancing.
The key, right now, is to slow down the spread of Coronavirus affording more time for more testing, spread out the hospital/ventilator use, and find a vaccine. Read: Social distancing. Stay home, hunker down, it’s simple.
With that said, the next trend, then, will be the overall impact on the country and the world from shutting down for so long. All of which are asymmetric uncertainty and unknowable, just like the future of global capital markets I deal with every day.
So, here we are, at the longest economic expansion in American history and the longest bull market in stocks and bonds, and we now have a catalyst for the cycles and trends to swing the other way.
INTRODUCING: A Quantitative Technical Analysis of the Coronavirus COVID – 19 Trend
First, all of the information provided is deemed reliable but is not guaranteed. So, we immediately realize there are limits to the data, since we can’t independently verify if a country, state, or county is reporting accurately.
Now that we have enough data from which to begin to draw inference, or charting trends, we us the data from Johns Hopkins Center for Systems Science and Engineering. The Center for Systems Science and Engineering takes a multidisciplinary approach to modeling, understanding, and optimizing systems of local, national, and global importance.
First shared on January 22, 2020, the Coronavirus Tracker tracks the progression of Coronavirus (also known as 2019-nCoV or COVID 19) across the world. COVID 19 was first detected in Wuhan, China in December 2019. On January 13, 2020 Thailand reported the first international case outside China, while the first cases within China, but outside of Wuhan were reported on January 19, in Guangdong and Beijing. Since then, the virus spread across the world.
As any good chartist, we’ll start at the top and work our way down into more granular observations. This is just my first observation, so later I’ll add more detail and analysis of the trends and momentum over time.
Coronavirus (COVID-19) is a global pandemic that originated in Wuhan, China in 2019. The virus has sparked a global economic slowdown because countries including China, Italy, and Iran having more than 1000 deaths within the first few months of the virus emerging. The virus also caused many countries to provide fiscal and monetary stimulus. For example, in the United States, the Federal Reserve conducted two surprise rates cuts to lower the Federal Funds rate to nearly 0%. Additionally, parts of the world implemented a complete lockdown of cities to prevent the spread of the virus. The Coronavirus pandemic eclipsed 10,000 cases on February 1, 2020, and 100,000 cases on March 6, 2020.
World Coronavirus Cases is at a current level of 691,867, up from 660,706.0 yesterday, which is a change of 4.72% from yesterday. This first chart can be somewhat misleading, so here is lesson one. This is a linear chart, so each level on the y-axis (horizontal axis) is the spacing is equal between the number of cases.
In comparison, below is the logarithmic chart. Logarithmic scales use percentage moves for spacing, rather than number of cases, so a log scale emphasizes the rate of change in a way that linear scales do not.
Notice how different looking the trend is for the same data. The top chart, linear, is an equally spaced grid of the number of cases. The linear chart plots the number of cases exactly as they are in person terms. For example, in the beginning there wasn’t nearly as many cases as now, so it’s at a lower level. So, when there was only 1,000 cases and now there are nearly 700,000 cases, the grid spacing on the chart doesn’t change. So, the earlier cases seem small on the chart because as a fixed number it is much smaller than more recent larger numbers.
The logarithmic chart corrects this issue and instead shows us the trend of the rate of change based on percentage moves. So, when the number of cases changes from 100 to 200, it’s a 100% change and it gets the same spacing as a change from 30,000 to 60,000, which is also a 100% change. A log chart helps us to normalize the data and see the trend in rate of change terms. The log chart is unique in that it shows a very fast uptrend early on that has sense slowed its rate of change.
Which scale is right? They both are. They just show the data in different ways. We primarily us logarithmic scales for price trends, especially longer time frames. We use linear charts with short term trends, when the data doesn’t spread out that much, or when we view an oscillator like breath indicators showing the percent of stocks in uptrends vs. downtrends.
One more example of the difference between the two, but this time with less words, more the picture. This is the World Coronavirus Cases Per Day on a linear chart, which makes me wonder if all the data is in, or it is really dropped that much. It’s possible it did, as the number of cases per day should decline at some point, so we’ll see tomorrow.
Here is the same date in the logarithmic chart. Applying the rate of change, it doesn’t look so strange because the percentage change isn’t as much as it appears in number form.
Next we look at the worst part: World Coronavirus Deaths, Death Rate, and Deaths per day. For now, I’ve put them on one chart for quick observation of the trend. The death rate at the world level is high at 4.77%, which may not be a predictor of the US death rate.
US CORONAVIRUS COVID – 19 CASES
In later observations, I’ll start analyzing the trends including ratios between them, correlations, spreads, and such, to see if we can find any signals in the noise. Next is a overall summary of US Coronavirus Cases, Deaths, Death Rate, and Cases Per Day, and Deaths Per Day. These trends are up, except the death rate, which was initially greater and has since declined. The general older age of some of the early infected on a cruise ship may have driven the higher rate initially.
The US Death Rate is an important number as it normalizes the number of deaths as a rate of change we can use to compare to other areas.
Speaking of comparison to other areas, I have other countries data, too, and also the US States. Since our clients are in the US, I’ll focus mainly here and within our states. We may eventually get more granular into county level data.
US States: Florida, Tennessee, Texas, North Carolina, California, New York
Since most of our clients are in these states, here is the percentage change to normalize the growth to compare.
I’m in Tampa Bay, so here’s a look at Florida. As the number of tests administered is increasing, so is are the number of cases.
As we get more data over time, the number of hospitalizations will be more and more telling. At this point, it’s 526 out of 3,763 cases, or about 14%. This percentage will become much more accurate as the sample size increases.
The death rate for Coronavirus in Florida is declining, but it’s too early and we don’t have a large enough sample size to draw a statistical inference from it just yet. We hope to see the death rate stay this low.
I’m going to monitor this data once a day, just as I monitor global market trends around the world. When I observe something asymmetric or useful, I’ll share it. In addition to viewing the trends and rate of change (momentum), I’ll also do some studies of ratios, correlations, and spreads to see if we can spot any patterns. If you have any questions for charting requests, contact me at the top of the page.
Don’t miss out, sign up to get an email when I post a new observation.
Join 520 other subscribers
Mike Shell is the Founder and Chief Investment Officer of Shell Capital Management, LLC, and the portfolio manager of ASYMMETRY® Global Tactical. Mike Shell and Shell Capital Management, LLC is a registered investment advisor focused on asymmetric risk-reward and absolute return strategies and provides investment advice and portfolio management only to clients with a signed and executed investment management agreement. The observations shared on this website are for general information only and should not be construed as advice to buy or sell any security. Securities reflected are not intended to represent any client holdings or any recommendations made by the firm. Any opinions expressed may change as subsequent conditions change. Do not make any investment decisions based on such information as it is subject to change. Investing involves risk, including the potential loss of principal an investor must be willing to bear. Past performance is no guarantee of future results. All information and data are deemed reliable but is not guaranteed and should be independently verified. The presence of this website on the Internet shall in no direct or indirect way raise an implication that Shell Capital Management, LLC is offering to sell or soliciting to sell advisory services to residents of any state in which the firm is not registered as an investment advisor. The views and opinions expressed in ASYMMETRY® Observations are those of the authors and do not necessarily reflect a position of Shell Capital Management, LLC. The use of this website is subject to its terms and conditions.
As I was writing this follow up to the Kinsa data US Health Weather Map, my conclusion is it seems Authorities should use all the data science they can to be as precise as possible for any government-mandated quarantines. I thought so because I believe, although social distancing is essential to slow the spread of COVID – 19, a government-mandated quarantine is a very big step. A government-mandated quarantine, especially one mandated at the federal level, has its risks. I’m thinking in terms of the impact on the individual mental and physical health of Americans, our communities, and the economy. At the federal level, their duty is to make decisions in the best interest of the overall situation.
Data science is an interdisciplinary field that uses scientific methods, processes, algorithms, and systems to extract knowledge and insights from many structural and unstructured data. Data science is related to data mining and big data.
I’m doing a Twitter poll that asks: Do you believe a broad quarantine worth the cost to the individual mental/physical health, community, and the economy? As of this writing, here are the results so far.
Polls such as Twitter polling is crowdsourcing. Crowdsourcing is a form of data science in that it gives us an idea of the opinions and observations of a large group of people. It also starts a conversation around the topic if it’s thought-provoking.
The U.S. Health Weather Map is a visualization of seasonal illness linked to fever – specifically influenza-like illness. The aggregate, anonymized data visualized on the map is a product of Kinsa’s network of Smart Thermometers and accompanying mobile applications, and Kinsa is providing this map and associated charts as a public service.
Kinsa has updated its atypical Illness map to reflect the cumulative amount of atypical illnesses we’ve observed since March 1. Previously the Health Weather Map reflected only new atypical illness, updated daily. Kinsa says:
As widespread social distancing measures take effect, feverish illness levels are dropping, and we feel this way of looking at the data gives a more accurate and comprehensive view of what’s happening. Change is effective as of March 27.
Here is the chart today. Since we are in Tampa Bay in Florida, I especially notice the red here in south Florida. The Miami-Dade area has especially active atypical data from their thermometers. The map above shows us how much influenza-like illness above the normal expected levels Kinsa has detected since March 1.
The time series chart allows us to compare Kinsa’s observations of the influenza-like illness level in the U.S., in orange and red, against where we’d expect them to be, in blue, and see how that relationship has changed over the past few weeks,
I made a gif video of the map taking a closer look around south Florida including Tampa Bay and Miami-Dade to show the level of detail.
I’m thinking this data is likely to have predictive power and may help authorities to monitor, track, and make decisions about quarantines and such.
Just imagine the ability to electronically monitor certain health measures of thousands or millions of people around the country. That’s essentially what we have here, and it’s a visualization of seasonal illness linked to fever, specifically influenza-like illness, which is a common characteristic of Coronavirus COVID – 19.
The CDC says:
“People may be sick with the virus for 1 to 14 days before developing symptoms. The most common symptoms of coronavirus disease (COVID-19) are fever, tiredness, and dry cough.”
So, it seems identifying and tracking the trend as soon as possible is essential.
Aside from a concern, Americans will start to panic more when they see a very fast accelerating growth of new cases, I’m now concerned about how they may react to a government-mandated lockdown. We are seeing evidence the social distancing is working and needs to continue, but a government-mandated quarantine may have more mental trama to it.
As I was writing this, I saw the President tweeted he is considering a more targeted quarantine:
I am giving consideration to a QUARANTINE of developing “hot spots”, New York, New Jersey, and Connecticut. A decision will be made, one way or another, shortly.
It seems the more precise they can be in deciding areas to lock down the better. I believe it because when we look at the map of confirmed cases, the red areas are distinct. Much of the US doesn’t have any cases at all. So, I can see why the federal authorities hesitate to quarantine the entire country.
But, if they can more precisely define the risk areas using the tools available, the data from the map from Kinsa’s network of Smart Thermometers and accompanying mobile applications may help them to see early warning signs in new areas.
As a libertarian myself, I’m not an enthusiast of the federal government mandating a shutdown, and I prefer to at least let the state, county, and city make their own decisions. I’m also one to try to be a part of the solution rather than part of the problem, so we are self-quarantined to the extent we can and I support a more precise government-mandated quarantine.
The reality is, we don’t know if the cost of a broad quarantine is worth the cost to the individual mental/physical health, community, and the economy, so the best thing is to be as precise as possible about managing the risks.
We are working on a report of the COVID – 19 trends I’ll be sharing shortly. I’m going to start analyzing the trends quantitatively. Don’t miss out, sign up to get the email:
Join 520 other subscribers
Mike Shell is the Founder and Chief Investment Officer of Shell Capital Management, LLC, and the portfolio manager of ASYMMETRY® Global Tactical. Mike Shell and Shell Capital Management, LLC is a registered investment advisor focused on asymmetric risk-reward and absolute return strategies and provides investment advice and portfolio management only to clients with a signed and executed investment management agreement. The observations shared on this website are for general information only and should not be construed as advice to buy or sell any security. Securities reflected are not intended to represent any client holdings or any recommendations made by the firm. Any opinions expressed may change as subsequent conditions change. Do not make any investment decisions based on such information as it is subject to change. Investing involves risk, including the potential loss of principal an investor must be willing to bear. Past performance is no guarantee of future results. All information and data are deemed reliable but is not guaranteed and should be independently verified. The presence of this website on the Internet shall in no direct or indirect way raise an implication that Shell Capital Management, LLC is offering to sell or soliciting to sell advisory services to residents of any state in which the firm is not registered as an investment advisor. The views and opinions expressed in ASYMMETRY® Observations are those of the authors and do not necessarily reflect a position of Shell Capital Management, LLC. The use of this website is subject to its terms and conditions.
We continue to monitor the incredible data coming from the Kinsa Data Team.
Today, they announced:
“We are seeing increasing evidence that social distancing policies enacted at the state level are causing decreases in viral transmission. This analysis is based on our real-time illness signal collected over the last two weeks which is highly correlated with the national influenza-like illness (ILI) reported by the Center for Disease Control (CDC)”
They interpret these declines in presumed flu infections to be a promising indication that social distancing measures will be effective at slowing the spread of COVID-19.
What we are seeing here is likely an overwhelming decrease in seasonal cold and flu transmission rather than any effect specific to COVID-19.
They go on to share comparisons of roughly four weeks of influenza-like illness levels for three states — Florida, Washington and California — that first reported COVID-19 infections.
The first confirmed COVID-19 case in the U.S. was in Washington state on Jan 21. The first COVID-19 related death was in Washington state on Feb. 29. Washington was also the first state to implement widespread social distancing policies. Here is the timeline.
Washington state and California have aggressively instituted social distancing measures and have shown declines in influenza-like illness in the subsequent days and weeks.
In Florida, the limited implementation of social distancing measures is associated with a prolonged and sustained increase in illness levels.
On March 1, Florida reported its first confirmed case of COVID-19. Although the governor declared a state of emergency the same day, there were no mandatory restrictions implemented at the state level until March 17, when all bars and nightclubs were ordered closed. Public universities started canceling in-person classes on March 17 and 18 and public beaches, as well as restaurants and gyms, were ordered closed on March 20.
In comparison, here is the faster response from California.
Since I’m in Florida, here is their chart of atypical Illness Levels for Hillsborough County, FL and surrounding areas as of March 24, 2020.
Compare Tampa Bay above to the atypical Illness Levels for Los Angeles County, CA and surrounding areas below. LA is benefiting from the quick response to social distancing over Tampa Bay.
The bottom line is the evidence shown above for Washington state, California and Florida, strict social distancing measures appear to have an effect on reducing the total influenza-like illness.
LET’S KEEP DOING IT AMERICA!
Don’t miss any ASYMMETRY® Observations, get an email when we publish.
Mike Shell is the Founder and Chief Investment Officer of Shell Capital Management, LLC, and the portfolio manager of ASYMMETRY® Global Tactical. Mike Shell and Shell Capital Management, LLC is a registered investment advisor focused on asymmetric risk-reward and absolute return strategies and provides investment advice and portfolio management only to clients with a signed and executed investment management agreement. The observations shared on this website are for general information only and should not be construed as advice to buy or sell any security. Securities reflected are not intended to represent any client holdings or any recommendations made by the firm. Any opinions expressed may change as subsequent conditions change. Do not make any investment decisions based on such information as it is subject to change. Investing involves risk, including the potential loss of principal an investor must be willing to bear. Past performance is no guarantee of future results. All information and data are deemed reliable but is not guaranteed and should be independently verified. The presence of this website on the Internet shall in no direct or indirect way raise an implication that Shell Capital Management, LLC is offering to sell or soliciting to sell advisory services to residents of any state in which the firm is not registered as an investment advisor. The views and opinions expressed in ASYMMETRY® Observations are those of the authors and do not necessarily reflect a position of Shell Capital Management, LLC. The use of this website is subject to its terms and conditions.
As you know, I do quantitative research of trends, trend changes, and such, which are usually applied to global market trends. I have been studying some quantitative data that appears to front-run COVID – 19 by about a week.
Most of what I’ve seen reported suggests the increase in hospital cases will peak in the next few weeks. Based on what I’m seeing, we may instead observe peak in hospital cases much sooner, as in the next few days.
First, the Observed Illnesses is an index of how severely the population in this area is being affected by influenza-like illness, according to Kinsa Insights.
The next map is The U.S. Health Weather Map, which is a visualization of seasonal illness linked to fever – specifically influenza-like illness, according to Kinsa. What they are calling “atypical illness”, may in some cases be connected to the COVID-19 pandemic. “The aggregate, anonymized data visualized here is a product of Kinsa’s network of Smart Thermometers and the accompanying mobile applications. Kinsa is providing this map and associated charts as a public service.
Kinsa explains on the website:
This chart allows us to compare Kinsa’s observations of the influenza-like illness level in the U.S., in orange and red, against where Kinsa expects them to be, in blue Based on their data, influenza-like illness levels in the U.S. are higher than what we’d expect at this time of year, according to the website.
They go on to explain:
The map shows two key data points:
(1) the illness levels we’re currently observing, and
(2) the degree to which those levels are higher than the typical levelswe expect to see at this point in the flu season.
Please note: We are not stating that this data represents COVID-19 activity. However, we would expect to pick up higher-than-anticipated levels of flu-like symptoms in our data in areas where the pandemic is affecting large numbers of people. Taken together with other data points, we believe this data may be a helpful early indicator of where and how quickly the virus is spreading.
Notice in the map above, California is gray now, it was red before. They note:
Due to widespread social distancing, school closures, stay-at-home orders, etc. influenza-relatedillness levels are dropping in many regions. In some regions (e.g. CA) they’re dropping below the expected range for this time of year — which reduces the level of atypical illness to zero on our map
I believe this is fascinating and seems to suggest it is likely we’ll see a peak in hospital cases much sooner, as in the next several days. If so, it may also mean Coronavirus passes through faster than many expect. In that case, it would be an unexpected improvement for the economy and stock market, if we aren’t shut down as long.
I’m going to be sharing some very interesting observations in the weeks ahead, so I encourage you to follow along by entering your email below for notifications.
Mike Shell is the Founder and Chief Investment Officer of Shell Capital Management, LLC, and the portfolio manager of ASYMMETRY® Global Tactical. Mike Shell and Shell Capital Management, LLC is a registered investment advisor focused on asymmetric risk-reward and absolute return strategies and provides investment advice and portfolio management only to clients with a signed and executed investment management agreement. The observations shared on this website are for general information only and should not be construed as advice to buy or sell any security. Securities reflected are not intended to represent any client holdings or any recommendations made by the firm. Any opinions expressed may change as subsequent conditions change. Do not make any investment decisions based on such information as it is subject to change. Investing involves risk, including the potential loss of principal an investor must be willing to bear. Past performance is no guarantee of future results. All information and data are deemed reliable but is not guaranteed and should be independently verified. The presence of this website on the Internet shall in no direct or indirect way raise an implication that Shell Capital Management, LLC is offering to sell or soliciting to sell advisory services to residents of any state in which the firm is not registered as an investment advisor. The views and opinions expressed in ASYMMETRY® Observations are those of the authors and do not necessarily reflect a position of Shell Capital Management, LLC. The use of this website is subject to its terms and conditions.
Something we have warned about for a while now is the elevated valuation level of stocks in general.
To be sure, I search for “Shiller PE” here on ASYMMETRY® Observations to mention the most recent times.
I promise I’m not just tooting my own horn here. The intent is to make the point that these things were present before this market crash and it’s starting to get cleared up. The same person who wrote about it then is now looking for the trend to change. But, to fully understand, we have to go back and see where we are coming from to know where we are now.
The current bull market that started in March 2009 is thelongest bull market in history. It exceeded the bull market of the 1990s that lasted 113 months in terms of time, though still not as much gain as the 90s.
The U.S. is in its longest economic expansion in history, breaking the record of 120 months of economic growth from March 1991 to March 2001, according to the National Bureau of Economic Research. However, this record-setting run observed GDP growth far slower than previous expansions.
The aged bull market and economic expansion can naturally lead to some level of complacency and expectation for less downside and tighter price trends. When investors are uncertain, their indecision shows up in a wide range of prices. When investors are smugger and confident, they are less indecisive and it’s usually after a smooth uptrend they expect to continue.
Is it another regime of irrational exuberance?
“Irrational exuberance” was the expression used by the former Federal Reserve Board chairman, Alan Greenspan, in a speech given during the dot-com bubble of the 1990s. The expression was interpreted as a warning that the stock market may have been overvalued. It was.
Irrational exuberance suggests investor enthusiasm drives asset prices up to levels that aren’t supported by fundamental financial conditions. The 90s ended with a Shiller PE Ratio over 40, far more than any other time in more than a century.
Is the stock market at a level of irrational exuberance?
Maybe so, as this is the second-highest valuation in the past 150 years according to the Shiller PE.
Before that, on January 17, 2020 in
The aged bull market and economic expansion can naturally lead to some level of complacency and expectation for less downside and tighter price trends. When investors are uncertain, their indecision shows up in a wide range of prices. When investors are smugger and confident, they are less indecisive and it’s usually after a smooth uptrend they expect to continue.
Is it another regime of irrational exuberance?
“Irrational exuberance” was the expression used by the former Federal Reserve Board chairman, Alan Greenspan, in a speech given during the dot-com bubble of the 1990s. The expression was interpreted as a warning that the stock market may have been overvalued. It was.
Irrational exuberance suggests investor enthusiasm drives asset prices up to levels that aren’t supported by fundamental financial conditions. The 90s ended with a Shiller PE Ratio over 40, far more than any other time in more than a century.
Is the stock market at a level of irrational exuberance?
Maybe so, as this is the second-highest valuation in the past 150 years according to the Shiller PE.
The S&P 500 is trading at 31.8 x earnings per share according to the Shiller PE Ratio which is the second-highest valuation level it has been in 150 years. Only in 1999 did the stock index trade at a higher multiple times earnings.
This price-earnings ratio is based on average inflation-adjusted earnings from the previous 10 years, known as the Cyclically Adjusted PE Ratio (CAPE Ratio), Shiller PE Ratio, or PE 10.
Look at the yearly earning of the S&P 500 for each of the past ten years.
Adjust these earnings for inflation, using the CPI (ie: quote each earnings figure in 2020 dollars)
Average these values (ie: add them up and divide by ten), giving us e10.
Then take the current Price of the S&P 500 and divide by e10.
The bottom line is, the stock market valuation has been expensive for a while now. The only time I factor in the price-earnings ratio is in the big picture. Although it isn’t a good timing indicator, it is considered a measure of the margin of safety for many investors and at this elevated level, there is no margin of safety by this measure.
As such, risk seems high in the big picture, which suggests investors should access their exposure to the possibility of loss in stocks and stock funds to be prepared for a trend reversal.
As a matter of fact, I was quoted three times in Barron’s and MarketWatch in November 2019 and January 2020 warning of the elevated risk level in stocks because of their valuation, the length of the bull market that is 11 years old, and what was a very low level of volatility.
I’m a true independent thinker, and have evidence of that as well. I’m sure my friends at Barron’s may not have liked it when I poke a little fun at the cover on January 18th and made it as clear as it could be! Here is what I wrote in Now, THIS is what a stock market top looks like!
To be fair, I also included how Barron’s had been right before on their cover, but I was just using this as a confirming sign along with many other things I was already seeing.
I followed with;
My observations this week seem especially important because risk levels have become more elevated, yet individual investor sentiment is extremely optimistic.
As I’ve had very high exposure to stocks, I have now taken profits in our managed portfolios.
It’s a good time to evaluate portfolio risk levels for exposure to the possibility of loss and determine if you are comfortable with it.
Here is the good news. After more than a -30% decline, the S&P 500 Shiller PE is down to 21, which is now within a more normal range, especially if we can assume low inflation. It’s still highly valued, but not the extremely overvalued 32 I warned about several times this year.
At 32 times earnings, it was the second most expensive time for stocks in American history. Second only to the late 1990’s and above Black Tuesday, just before the Great Depression.
The S&P 500 Shiller CAPE Ratio, also known as the Cyclically Adjusted Price-Earnings ratio, is defined as the ratio the the S&P 500’s current price divided by the 10-year moving average of inflation-adjusted earnings. Shiller PE was invented by Yale economist Robert Shiller and has become a popular way to understand long-term stock market valuations. It is used as a valuation metric to forecast future returns, where a higher CAPE ratio could reflect lower returns over the next couple of decades, whereas a lower CAPE ratio could reflect higher returns over the next couple of decades,as the ratio reverts back to the mean.
The mean is 16.70, so it still has a way to go for mean reversion.
The only good thing about falling stock prices is, if you have a lot of cash, as we’ve had, you get to buy stocks and equity ETFs at lower risk entry points. I’m not often a value investor, but I am when prices actually become fairly valued to undervalued.
Another way to observe valuations of the big picture is the S&P 500 PE Ratio. The S&P 500 PE Ratio is the price to earnings ratio of the constituents of the S&P 500. The S&P 500 includes the 500 largest companies in the United States and can be viewed as a gauge for how the US stock market is performing. The price to earnings ratio is a valuation metric that gives a general idea of how a company’s stock is priced in comparison to their earnings per share. Historically, the S&P 500 PE Ratio peaked above 120 during the financial crisis in 2009 and was at its lowest in 1988. I marketed the high, low, and average in the chart.
The trouble is, this PE metric did skyrocket in the last bear market. It’s because in recessions and bear markets, earnings decline. A picture is worth a thousand words, so here is the S&P earnings over the last twenty years with the recessionals in gray.
It all makes more sense when we see all three of the stock market return drivers in one chart. Earnings fall, price falls, dividend increases as the price decrease, and PE spikes up.
Next I show all four; price trend, PE trend, earnings cycle, and dividend yield.
So, the good news is, the US stock market is becoming less overvalued. The downside is, a recession seems imminent as earnings was already expected to slow. This is at least one less risk in the big picture, but we’ll see how it all unfolds from here.
Bear markets are difficult and with all the negative headlines right now, I know it’s hard for people to see light at the end of the tunnel. I don’t see it, either, but as a tactical investment manager, I increase and decrease exposure to the risk/reward and in a volatility expansion, I expect wider swings.
These are fascinating times and past bear markets have been the highlight of my professional investment management career, so sign up if you want to follow along with email notifications of new observations.
Let us know if we can help.
Mike Shell is the Founder and Chief Investment Officer of Shell Capital Management, LLC, and the portfolio manager of ASYMMETRY® Global Tactical. Mike Shell and Shell Capital Management, LLC is a registered investment advisor focused on asymmetric risk-reward and absolute return strategies and provides investment advice and portfolio management only to clients with a signed and executed investment management agreement. The observations shared on this website are for general information only and should not be construed as advice to buy or sell any security. Securities reflected are not intended to represent any client holdings or any recommendations made by the firm. Any opinions expressed may change as subsequent conditions change. Do not make any investment decisions based on such information as it is subject to change. Investing involves risk, including the potential loss of principal an investor must be willing to bear. Past performance is no guarantee of future results. All information and data are deemed reliable but is not guaranteed and should be independently verified. The presence of this website on the Internet shall in no direct or indirect way raise an implication that Shell Capital Management, LLC is offering to sell or soliciting to sell advisory services to residents of any state in which the firm is not registered as an investment advisor. The views and opinions expressed in ASYMMETRY® Observations are those of the authors and do not necessarily reflect a position of Shell Capital Management, LLC. The use of this website is subject to its terms and conditions.
The great thing about sharing written observations is the ability to go back and read what was going on in the past to learn from it.
On January 11, I wrote:
You probably want to invest in stocks right now, I bet.
If you are already invested in stocks, you probably want to be more aggressive in investing in stocks. Maybe it’s selling bonds to buy more stocks, or investing that extra cash, or something really aggressive like adding leverage or buying more risky stocks.
I believe this because investor sentiment is dialed up and 2020 started out about as enthusiastic as it gets. Well, and we’re getting calls from people wanting to invest.
Then, included the Fear & Greed Index dialed all the way up to 97, Extreme Greed.
I went on to write; (I’m bolding the key points this time)
The Fear & Greed Index is driven by seven different investor sentiment indicators. If you’re an investor, I encourage you to use it as a gauge for your own enthusiasm and panic. When you feel one way or another about the future direction of the stock market, check the indicator to see what emotion is driving the stock market now.
Avoiding costly mistakes is essential in money management, so if we can help you avoid buying too high and then tapping out at the lows, that’s an edge. That’s the behavioral counseling we do; investor behavior modification. It’s one of the main observations I share here. If nothing else, I hope I can help you avoid making costly emotional decisions as many investors do.
I included this chart of the stock index at all time highs.
I then wrote: (I added the bold this time)
Investors sentiment trend to follow price trends, so investors or trend followers.
After prices trend up, investors get more bullish, expecting the gains to continue.
After prices trend down, investors get more bearish, expecting the losses to continue.
So, it isn’t a surprise to see this level of enthusiasm, considering the stock index is at an all-time high.
What has changed?
A lot has changed since then.
First, the S&P 500 stock index which most investors use as a proxy for “the stock market” is down -34% from it’s high reached on February 19th. To put the fall into context, I included the history going all the way back to the 50s. This is now the 4th deepest decline since then.
The speed of the decline was most impressive.
The next chart is the price trend of the S&P and Dow Jones year-to-date. The decline happened very fast, in just a few weeks.
By March 12, the Fear & Greed Index was pegged back to 1 indicating “Extreme Fear.”
“Be fearful when others are greedy and greedy when others are fearful.”
― Warren Buffett
I know. It’s much harder than it sounds!
But at the extremes, which is what I mostly point out here on ASYMMETRY® Observations, is when we want to step away from the crowd and shift from trend following to countertrend tactics.
That’s what I’ve been doing.
I know you think “it’s different this time” because of the Coronavirus COVID – 19 and such. Now, the Federal Reserve has committed to taking unprecedented actions even more than after 2008. The US government is printing even more money than before.
It all seems so uncertain, but it always is.
“Don’t fight the Fed.”
“Don’t fight the Fed” suggests investors can do well by getting in synch with monetary policies of the Federal Reserve Board, rather than against them. The Fed has lowered rates to zero and announced it will be buying traditional securities including bonds and ETFs as “The Fed Goes All In With Unlimited Bond-Buying Plan.” I’ll share my detailed observations of it later.
Yesterday, I had a significant cash position, so was looking for the most likely asymmetric risk/reward positions to take. Tactical trading isn’t easy. It requires tremendous discipline, stoicism, patience, skill, ability to be wrong, and acceptance of the uncertainty.
RISK MANAGER / RISK TAKER
I’m a tactical risk manager and also a risk-taker. I increase and decrease exposure to the possibility of profit or loss based on my estimates of asymmetric risk-reward. After prices have already fallen over -30%, we have to realize the risk level decreases. It doesn’t seem that way, because of the volatility expansion. Prices swing wider up and down at the lowest lows, so there is nothing easy about taking a risk when its the lowest.
If you are like the majority of investors, you are feeling “Extreme Fear” right now as you fear taking on more loss. Below is the Fear & Greed index over time. Notice it oscillates between fear and greed. After prices trend up, it enters the red zone I colored. After prices fall, it enters the green zone.
Clearly, this has been one of the most staggering waterfall declines in American history. As such, investor sentiment has followed the price trends down.
So, you probably want to sell your stocks right now.
I’ve been hearing from other financial advisors who aren’t tactical like me and don’t increase and decrease exposure to asymmetric risk/reward as I do, saying their clients were tapping out on these big down days the past week.
That’s what I hope to avoid with our clients.
If you tap out, I would NEVER know when you could get back in.
Would you feel better of prices fall another -30%?
Or, would you buy back if prices trend back up to all time new highs?
What would it take?
I have no idea.
I want to avoid that situation because I have no idea how to resolve it. So, I prefer to try to apply my drawdown controls to manage the downside the best we can to keep it within our clients tolerance and capacity for risk.
This is why I actively manage risk by increasing exposure to risk and reward over time. It ain’t perfect, but it doesn’t have to be, as evidenced by my 16-year track record. I just need the average gains to be larger than the average loss over time.
It’s what I call ASYMMETRY®.
That’s all for now. I’ve got some good stuff in the queue, so if you haven’t already, I encourage you to sign up for automatic email alerts of new observations.
I also encourage you to go back and read You probably want to invest in stocks from January 11th and think about what has changed since then. This has been one of the most fascinating swings in US history, so let’s learn all we can from it!
Mike Shell is the Founder and Chief Investment Officer of Shell Capital Management, LLC, and the portfolio manager of ASYMMETRY® Global Tactical. Mike Shell and Shell Capital Management, LLC is a registered investment advisor in Florida, Tennessee, and Texas. Shell Capital is focused on asymmetric risk-reward and absolute return strategies and provides investment advice and portfolio management only to clients with a signed and executed investment management agreement. The observations shared on this website are for general information only and should not be construed as advice to buy or sell any security. Securities reflected are not intended to represent any client holdings or any recommendations made by the firm. I observe the charts and graphs to visually see what is going on with price trends and volatility, it is not intended to be used in making any determination as to when to buy or sell any security, or which security to buy or sell. Instead, these are observations of the data as a visual representation of what is going on with the trend and its volatility for situational awareness. I do not necessarily make any buy or sell decisions based on it. Any opinions expressed may change as subsequent conditions change. Do not make any investment decisions based on such information as it is subject to change. Investing involves risk, including the potential loss of principal an investor must be willing to bear. Past performance is no guarantee of future results. All information and data are deemed reliable but is not guaranteed and should be independently verified. The presence of this website on the Internet shall in no direct or indirect way raise an implication that Shell Capital Management, LLC is offering to sell or soliciting to sell advisory services to residents of any state in which the firm is not registered as an investment advisor. The views and opinions expressed in ASYMMETRY® Observations are those of the authors and do not necessarily reflect a position of Shell Capital Management, LLC. The use of this website is subject to its terms and conditions.
I’m not a Physician, I am a mathematician, so I deal with trends, velocity, momentum, exponentials, and differentials.
People tend to underreact to initial changes in new information and then overreact after they realize they underreacted. That’s when we see the panic and the madness of crowds.
The exponential growth of Coronavirus is likely to be shocking initially in the weeks ahead. As I shared with friends in January, this is an asymmetric uncertainly, and there is a chance for underestimation. So, I hope people are taking the advice of the CDC on things like social distancing, which will help.
What is asymmetric uncertainty?
Asymmetric Uncertainty: Properties of the virus that are uncertain will have a substantial impact on whether the policies implemented are effective. For instance, whether contagious asymptomatic carriers exist. These uncertainties make it unclear whether measures such as temperature screening at major ports will have the desired impact. Practically all the uncertainty tends to make the problem potentially worse, not better, as these processes are convex to uncertainty.
The funny thing is, as social distancing does help “flatten the curve,” many people will believe it wasn’t necessary to start with.
That’s okay, let them believe it.
Christi and I are operating from our home office and prepared to hunker down as long as we need to. We prepared by stocking up supplies we need, which we do to some degree anyway in advance of hurricane season. This year, we just did it early, and more of it. If we don’t eat canned food, it’s a good donation.
In the meantime, the simple way to avoid the virus is to simply avoid situations that could attract it. Beyond that, there are many resources straight from the horse’s mouth that help to track it.
For example, here in Florida, the Florida Department of Health provides updates on its website. Here are the latest updates at this moment. I don’t make the mistake of watching it closely all day, I check it in the morning to see how it’s trending and its rate of change.
Again, unless “social distancing” has a very dramatic impact immediately, we should expect to see the rate of change increase exponentially in the days and weeks ahead. For those who aren’t aware or prepared, it may be shocking for a while. If you want to embrace the asymmetric uncertainty, as we are, just hunker down for a while and watch it all unfold.
I have a good reason to, beyond not contracting or spreading the disease, as global markets in a downtrending volatility expansion. I’m trying to make the best of it.
Now is the time to check on our neighbors, friends, and family.
With the social media we have today, we may be physically distant, but we’ve never been more connected.
Beyond that, hang in there friends, this too shall pass. Someday we’ll look back and tell the stories just as we do about Y2K, 9/11, the Gulf Wars, and all the other things we hadn’t experienced before until it happened.
As for investment management, sign up to follow ASYMMETRY® Observations on the upper right side of this page.
Mike Shell is the Founder and Chief Investment Officer of Shell Capital Management, LLC, and the portfolio manager of ASYMMETRY® Global Tactical. Mike Shell and Shell Capital Management, LLC is a registered investment advisor in Florida, Tennessee, and Texas. Shell Capital is focused on asymmetric risk-reward and absolute return strategies and provides investment advice and portfolio management only to clients with a signed and executed investment management agreement. The observations shared on this website are for general information only and should not be construed as advice to buy or sell any security. Securities reflected are not intended to represent any client holdings or any recommendations made by the firm. I observe the charts and graphs to visually see what is going on with price trends and volatility, it is not intended to be used in making any determination as to when to buy or sell any security, or which security to buy or sell. Instead, these are observations of the data as a visual representation of what is going on with the trend and its volatility for situational awareness. I do not necessarily make any buy or sell decisions based on it. Any opinions expressed may change as subsequent conditions change. Do not make any investment decisions based on such information as it is subject to change. Investing involves risk, including the potential loss of principal an investor must be willing to bear. Past performance is no guarantee of future results. All information and data are deemed reliable but is not guaranteed and should be independently verified. The presence of this website on the Internet shall in no direct or indirect way raise an implication that Shell Capital Management, LLC is offering to sell or soliciting to sell advisory services to residents of any state in which the firm is not registered as an investment advisor. The views and opinions expressed in ASYMMETRY® Observations are those of the authors and do not necessarily reflect a position of Shell Capital Management, LLC. The use of this website is subject to its terms and conditions.
I have long said that many indexes are a black box. If we don’t know what will be added or deleted from the index in advance, the rules driving the changes must be a black box. I especially believe the Dow Jones Industrial Average is a Black Box.
I’ve also said most of the indexes are simply systematic investment strategies that apply some rules-based strategy and most of them are quantitative. That isn’t the case with all indices, however, since some of the additions and deletions (buys and sells) in the index are decided by a committee. However, even the committee uses some quantitative rules-based method to some degree.
But, it’s still people, making decisions, deciding which stocks to add or remove. As such, there is both a degree of quantitative rules-based system and some elements of discretionary decision-making. To be sure, read their notices of index changes.
S&P Dow Jones Indices recently announced their quarterly rebalance for S&P and Dow Jones equity indices scheduled to take effect prior to the open Monday, March 23, 2020, are being postponed.
S&P DJI made this decision following thorough consideration of how best to support our clients and govern our indices during this period of extreme global market volatility, market-wide circuit breaker events and exchange closures.
Below is a summary of the changes that will impact certain indices.
The majority of quarterly shares outstanding and investable weight factor (IWF) updates are postponed.
Membership changes (i.e., adds/drops) for select indices will be postponed.
Capping constraints that enable consistency with certain diversification requirements will be applied by the end of March.
This is an example of what I call Man + Machine. As most of the S&P Dow Jones Indices is systematic, applying a rules-based strategy for adding and deleting stocks in the index much like the manager of a fund does, this action is the result of the discretionary overlay of people making active decisions.
The recent volatility across global markets is one of the most extreme volatility expansions we’ve ever seen before as prices are spreading out everywhere. No index company is more known than S&P Dow Jones Indices, and even they have made a big discretionary active decision in response to changing market conditions.
Mike Shell is the Founder and Chief Investment Officer of Shell Capital Management, LLC, and the portfolio manager of ASYMMETRY® Global Tactical. Mike Shell and Shell Capital Management, LLC is a registered investment advisor in Florida, Tennessee, and Texas. Shell Capital is focused on asymmetric risk-reward and absolute return strategies and provides investment advice and portfolio management only to clients with a signed and executed investment management agreement. The observations shared on this website are for general information only and should not be construed as advice to buy or sell any security. Securities reflected are not intended to represent any client holdings or any recommendations made by the firm. I observe the charts and graphs to visually see what is going on with price trends and volatility, it is not intended to be used in making any determination as to when to buy or sell any security, or which security to buy or sell. Instead, these are observations of the data as a visual representation of what is going on with the trend and its volatility for situational awareness. I do not necessarily make any buy or sell decisions based on it. Any opinions expressed may change as subsequent conditions change. Do not make any investment decisions based on such information as it is subject to change. Investing involves risk, including the potential loss of principal an investor must be willing to bear. Past performance is no guarantee of future results. All information and data are deemed reliable but is not guaranteed and should be independently verified. The presence of this website on the Internet shall in no direct or indirect way raise an implication that Shell Capital Management, LLC is offering to sell or soliciting to sell advisory services to residents of any state in which the firm is not registered as an investment advisor. The views and opinions expressed in ASYMMETRY® Observations are those of the authors and do not necessarily reflect a position of Shell Capital Management, LLC. The use of this website is subject to its terms and conditions.
Today was just a reversal of Friday’s late-day surge.
The stock market is even more washed out.
With the Federal Reserve lowering interest rates and buying back bonds, the long term US Treasury Index reversed back up.
The stock indexes are down to their 2018 lows and if the selling doesn’t dry up, we may see a mean reversion of the last 10 years. It wouldn’t be surprising for many reasons, especially when we see it happens to be the area of trouble in 2015-16. Keep in mind, the Fed has been a key return driver for the last several years. It doesn’t seem to be working anymore.
I’m a risk manager, risk-taker, so I increase and decrease exposure to asymmetric risk/reward as conditions change over time. When I see signs of the selling pressure drying up or buying enthusiasm overwhelming the selling pressure, I’ll be looking to buy stocks again.
That is all.
Let me know if we can help.
Mike Shell is the Founder and Chief Investment Officer of Shell Capital Management, LLC, and the portfolio manager of ASYMMETRY® Global Tactical. Mike Shell and Shell Capital Management, LLC is a registered investment advisor in Florida, Tennessee, and Texas. Shell Capital is focused on asymmetric risk-reward and absolute return strategies and provides investment advice and portfolio management only to clients with a signed and executed investment management agreement. The observations shared on this website are for general information only and should not be construed as advice to buy or sell any security. Securities reflected are not intended to represent any client holdings or any recommendations made by the firm. I observe the charts and graphs to visually see what is going on with price trends and volatility, it is not intended to be used in making any determination as to when to buy or sell any security, or which security to buy or sell. Instead, these are observations of the data as a visual representation of what is going on with the trend and its volatility for situational awareness. I do not necessarily make any buy or sell decisions based on it. Any opinions expressed may change as subsequent conditions change. Do not make any investment decisions based on such information as it is subject to change. Investing involves risk, including the potential loss of principal an investor must be willing to bear. Past performance is no guarantee of future results. All information and data are deemed reliable but is not guaranteed and should be independently verified. The presence of this website on the Internet shall in no direct or indirect way raise an implication that Shell Capital Management, LLC is offering to sell or soliciting to sell advisory services to residents of any state in which the firm is not registered as an investment advisor. The views and opinions expressed in ASYMMETRY® Observations are those of the authors and do not necessarily reflect a position of Shell Capital Management, LLC. The use of this website is subject to its terms and conditions.
Growing up in East Tennessee and the Great Smoky Mountains, I observed a lot of waterfalls.
Wiki says a fall of water is an area where water flows over a vertical drop or a series of steep declines in the course of a stream or river.
According to National Geographic, a waterfall is a river or other body of water’s steep fall over a rocky ledge into a plunge pool below. Waterfalls are also called cascades. The process of erosion, the wearing away of earth, plays an essential part in the formation of waterfalls.
What we have witnessed in the global equity markets is a waterfall decline, the question now is if the plunge pool has developed.
An overhang in a waterfall can sometimes protrude out enough to form a base, or even drive the water to flow upward for a while, but the waterfall isn’t over until the plunge pool develops.
Using the S&P 500 stock index as a proxy, it’s pretty clear there wasn’t much of an overhang along the way. For example, in the middle of this 3-year chart, we see how the decline in late 2018 played out. It had a lot of overhangs as the stock market was swinging up and down for several weeks. Now, compare that to this time…
What we have here is panic selling.
Investors tend to underreact and overreact to new information.
Underreaction: Trends begin to drift in a direction as people initially underreact to change, so the price trend unfolds gradually.
Overreaction: Sometimes, investors overreact to new information, so the price is driven too far, too fast. When the market overreacts, prices overshoot too high, or too low.
At the bottom of a waterfall is a plunge pool, where the water settles. What does the plunge pool look like as it develops? It’s a floor that has enough support the water stays were it is.
The trouble is, in the market, we don’t physically see the rock bottom. Unlike in physical science, an exchange market is a social science because it’s human behavior. Don’t think this is humans? Maybe it’s the computer algorithms? They are created and operated by humans.
I apply quantitative tools to get a read on how extreme investor sentiment is.
In analyzing market trends and price action, we can see what is going on with market internals, such as breadth. The NYSE Bullish Percent was developed by Abe Cohen was the first breadth indicator. Abe Cohen was an early pioneer of Point & Figure charting and created the NYSE BP in the mid-1950s. The NYSE Bullish Percent is a market risk barometer that measures the percent of stocks listed on the New York Stock Exchange that have a Point & Figure buy signal, so they making higher highs, so they are in uptrends. The NYSE Bullish Percent is washed out. It hasn’t been this low since the waterfall decline in October 2008.
The challenge with countertrends is they can also trend farther than you would ever believe is possible. It’s because markets don’t follow a normal distribution. Instead, market trends have fat tails, meaning some gains and losses exceed an otherwise normal distribution, as we see in physical science. As such, the overreactions can overshoot and just keep overshooting. We never know for sure when a trend has stopped. What we can do, however, is apply quantitative tools to gauge and guide. I use these as a guide and barometer for overall market risk.
The percent of the S&P 500 stocks above the 50-day moving average is washed out to 1%. In fact, only 7 of the 505 stocks in the S&P 500 are in a short term uptrend. While in a big bear market such as 2008-09, these conditions can continue for a long time, historically, this lower level of risk eventually offers the potential for asymmetric risk/reward. That is, the possibility for reward is greater than the risk it takes the achieve it. Or, the magnitude for a reward is greater than the downside risk, which can be predetermined with options or an exit (i.e., stop-loss.)
A material change that has occurred the past week is the percent of S&P 500 stocks above their 200 day moving average, or longer-term uptrends have washed out. Only 5% of the stocks are in uptrends now, so 95% of them are in long term downtrends. That doesn’t sound good, but when it reaches an extreme, it suggests to me the selling pressure is intense and could eventually dry up.
This is about as oversold the stock market gets, both internally looking at the individual stocks and the indexes. Sure, it can get more oversold and stay there for as long as sellers have the desire to sell, but it has reached the point the odds of a short term reversal is increasing the lower it goes.
Yesterday I asked: where do you think we are in the cycle of market emotions?
Clearly, when stock indexes drop 8-10% in a single day after already well off their highs, it is driven by emotional panic.
The US Investor Sentiment poll from AAII is released on a few day’s time lag, but Bearish % of those polled is another measure up to 2008-09 levels.
To no surprise, the Fear & Greed Index was penned all the way back to 1 after yesterday’s close.
What we have here is a washout. A washout is an event or period that is spoiled by constant or heavy rain. We may see more rain, but it’s a washout nonetheless. A washout in the stock market is when prices have been flooding down so hard, so broad, it seems like a washout of rain.
As you can imagine, with a waterfall, heavy rains increase the volume and speed of water flow. A washout pushes the river to its limits.
The desire to sell has been overwhelming any buying interest that remains for a few weeks now. This has been the fastest decline in US stock market history. I guess we shouldn’t be so surprised if we believe a trend stretched far in one direction is more prone to snap back harder and faster. That’s what we’ve seen here.
This is the end of the longest bear market in US history, and it has indeed ended with a bang. That also means this is the beginning of a bear market. What we don’t know in advance is how long it will last or how low it will go. If we knew it would be -50%, we could simply sell short and profit from the fall. If we knew this was “the bottom,” we could use leverage to maximize gains on the upside. But, none of us know the outcome in advance, not the biggest banks, not the largest asset managers, and neither you nor I. The edge I do have is accepting this reality and embracing it to the point I drove me to create risk management systems to limit the downside when I’m wrong and focus on the things I can control. I’ve operated tactically through periods like this many times before in the last two decades, so I’ll just do what I do, which means I’ll execute many entries and exits until we find the trend. In conditions like we’ve seen this year, they’ll be countertrends. Once trends do develop, they’ll be trend following.
What I’ve typically seen in past bear markets is many cycles up and down along the way. That isn’t what we’ve seen this time, so far. This reminds me more of September 11, 2001, after the World Trade Center was attacked. The difference is, the S&P 500 was already down about -17%, and since the planes hit the World Trade Center in New York, the NYSE was closed. The New York Stock Exchange remained closed until the following Monday. This was the third time in history that the NYSE experienced prolonged closure, the first time being in the early months of World War I[2][3] and the second being March 1933 during the Great Depression.
It may not play out this way this time, but countertrends should be expected. Here is what the stock market did after the exchange opened after September 11. The SPX dropped -12% quickly, but then investors become patriotic, and it recovered a few weeks later. Of course, this happened inside a bear market that started in 2000 and didn’t end until 2003.
Is this so different than 9/11? Of course, it is. Every new moment is always different. But, we’ve experienced these things before. I was much more of a rookie 20 years ago when I walked into my investment firm office to see the planes hit. It was an incredibly emotional and panicked time in American history. At the time, it wasn’t just the one attack, we wondered what would be next. It was the Pentagon, and another plane was hijacked. We didn’t know what to expect, it was uncertain. When would we be attacked again? Where? Would it wipe us out?
We didn’t know.
Portfolio managers and tactical traders must be here, now, in the present moment, not dwelling on the recent past, there will be time for that later when things are calm and quiet. But even then, we can’t do anything in the past, we can only do it now.
I hope this helps.
Mike Shell is the Founder and Chief Investment Officer of Shell Capital Management, LLC, and the portfolio manager of ASYMMETRY® Global Tactical. Mike Shell and Shell Capital Management, LLC is a registered investment advisor in Florida, Tennessee, and Texas. Shell Capital is focused on asymmetric risk-reward and absolute return strategies and provides investment advice and portfolio management only to clients with a signed and executed investment management agreement. The observations shared on this website are for general information only and should not be construed as advice to buy or sell any security. Securities reflected are not intended to represent any client holdings or any recommendations made by the firm. I observe the charts and graphs to visually see what is going on with price trends and volatility, it is not intended to be used in making any determination as to when to buy or sell any security, or which security to buy or sell. Instead, these are observations of the data as a visual representation of what is going on with the trend and its volatility for situational awareness. I do not necessarily make any buy or sell decisions based on it. Any opinions expressed may change as subsequent conditions change. Do not make any investment decisions based on such information as it is subject to change. Investing involves risk, including the potential loss of principal an investor must be willing to bear. Past performance is no guarantee of future results. All information and data are deemed reliable but is not guaranteed and should be independently verified. The presence of this website on the Internet shall in no direct or indirect way raise an implication that Shell Capital Management, LLC is offering to sell or soliciting to sell advisory services to residents of any state in which the firm is not registered as an investment advisor. The views and opinions expressed in ASYMMETRY® Observations are those of the authors and do not necessarily reflect a position of Shell Capital Management, LLC. The use of this website is subject to its terms and conditions.
At the moment, the popular US stock market indexes are down over 25% from their years year-to-date.
Looking at the Cycle of Market Emotions, where do you think we are at this moment?
The magnitude and speed of the decline are impressive by any measure. For example, below I charted two different historical (realized) volatility measures around the stock index. The green area is a channel of average true range, which I used to define the normal noise of the market. The waterfall decline has been anything but normal, as it has exceeded two times its average true range several times. We can say the same for the standard deviation, which is the red line.
This price action is a “black swan” outside anything ‘normal’, so this is an extreme level of panic selling.
Looking at the Cycle of Market Emotions, this is the panic phase
Based on price action across global markets including many alternative assets like Real Estate, Energy MLPs, and investor sentiment measures, this is the panic, capitulation, and despondency phase. The reality of a bear market has to the fore and investors are panicking. Many panic and tap-out from the market from of fear of further losses. Those who stay in and endure the decline may become despondent and wonder whether the markets are ever going to recover. They’ll start to think “this time is different” and we’ve never seen anything like this before.
We haven’t, and this time is necessarily different, as it’s a new moment that never before existed. All market trends are unique because all new momentums are unique – never existed before. But, that doesn’t mean we can use the past to understand future possibilities. History is all we have as a guide and our past experience is essential at times like this. As my focus is on investor behavior and how it drives market trends, momentum, and volatility, I’ll be sharing my beliefs on this in the days ahead.
Ironically, it’s times like this investors fail to realize markets also reach the point of maximum asymmetric risk/reward after such a radical waterfall decline. We never know in advance if it will keep trending down or reverse. This downtrend has been a fine example as it wasn’t interrupted my much of a countertrend back up. But in the big picture, the more extreme a price move, the higher the likelihood of a swing the other way – at least short term. I said the same about the uptrend. I like uptrends, but sometimes when it comes to momentum; the higher they go, the lower they fall. That’s what we’re seeing now. Investors should also be prepared for the opposite; the speed and magnitude of this decline may result in correspondingly strong countertrend reversals.
This is panic level selling.
This is a volatility expansion, so expect prices to swing up and down.
This price trend will reverse when the selling pressure has exhausted and has driven prices down to a low enough point to attract the enthusiasm to buy.
Surely the trend is nearing that level at least on a short term basis. Market trends are a process, not an event, but this one has been a much faster and deeper process – and it feels like an event.
At times like this, it’s essential to be stoic. For me, as a professional investment manager who has tactically operated through many times like this before, a stoic is being calm, emotionally intelligent, focus on the things I can control and let go of those I can’t and most of all self-discipline.
Self-discipline is the ability to control one’s feelings and overcome one’s weaknesses; the ability to pursue what one thinks is right despite temptations to abandon it.
I started increasing exposure to stocks after they fell because my managed portfolio was in a position of strength. I was in US Treasuries at the January stock market high, so we missed the first big leg down. We’re participating now as I increased exposure the last two weeks, so my tactical decisions are never perfect and never a sure thing. I don’t have to get it perfectly right every time, which is impossible. I just keep doing what I do, over and over, with great self-discipline and the calm of a stoic.
Hang in there friends, this too shall pass.
Mike Shell is the Founder and Chief Investment Officer of Shell Capital Management, LLC, and the portfolio manager of ASYMMETRY® Global Tactical. Mike Shell and Shell Capital Management, LLC is a registered investment advisor in Florida, Tennessee, and Texas. Shell Capital is focused on asymmetric risk-reward and absolute return strategies and provides investment advice and portfolio management only to clients with a signed and executed investment management agreement. The observations shared on this website are for general information only and should not be construed as advice to buy or sell any security. Securities reflected are not intended to represent any client holdings or any recommendations made by the firm. I observe the charts and graphs to visually see what is going on with price trends and volatility, it is not intended to be used in making any determination as to when to buy or sell any security, or which security to buy or sell. Instead, these are observations of the data as a visual representation of what is going on with the trend and its volatility for situational awareness. I do not necessarily make any buy or sell decisions based on it. Any opinions expressed may change as subsequent conditions change. Do not make any investment decisions based on such information as it is subject to change. Investing involves risk, including the potential loss of principal an investor must be willing to bear. Past performance is no guarantee of future results. All information and data are deemed reliable but is not guaranteed and should be independently verified. The presence of this website on the Internet shall in no direct or indirect way raise an implication that Shell Capital Management, LLC is offering to sell or soliciting to sell advisory services to residents of any state in which the firm is not registered as an investment advisor. The views and opinions expressed in ASYMMETRY® Observations are those of the authors and do not necessarily reflect a position of Shell Capital Management, LLC. The use of this website is subject to its terms and conditions.
The point is just as the title said, when stock prices trend up quietly, they are eventually interrupted by the loud bang of falling prices.
In this case, it took a few months to see it play out.
Below, I updated the chart so it still has the same starting date, but shows us what happened after I posted it. The 11/15/19 day is labeled on the chart. It had a small decline shortly after, but then resumed the uptrend.
In fact, the stock index went on to gain 9% from that point and was interrupted by only two small countertrend declines of 3-4%.
That is, until February 19th.
Since the peak, the stock index has declined -19% and volatility has exploded.
The volatility measure I used in the chart is an average of the true range, which accounts for a full price range of the period. The average true range is also what I used to draw the channels above and below the price trend to define “normal” price action.
The average true range of the price trend has increased by 420% since December, from 17 to 97. I know it shocked most people in the market and while I didn’t expect a -19% waterfall in just three weeks, I expected a volatility expansion and mean reversion. As I exited stocks a little early, we see now it didn’t matter this time as the stock market has given up far more upside than we missed out on over those few weeks.
Next, let’s look at a chart of implied volatility as indicated by the VIX based on how the market is pricing options. Implied vol spiked over 200%. I also included the 30-Day rolling volatility of the S&P 500 ETF. Implied volatility lead realized, historical, volatility to the upside.
So, the condition of the US stock market is volatile one as prices and swinging up and down, and only December 2008 in the middle of the Financial Crisis was it higher.
If the VIX is a fear gauge, it’s signaling a lot of fear.
The good news is, the opposite is also true; periods of high volaltity are eventually followed by volatility contractions.
But, just as before, as it took time for the volatility contraction to become a volatility expansion, we’ll probably see a continuation of price swings and elevated volatility for a while.
Eventually, this too shall pass.
Mike Shell is the Founder and Chief Investment Officer of Shell Capital Management, LLC, and the portfolio manager of ASYMMETRY® Global Tactical. Mike Shell and Shell Capital Management, LLC is a registered investment advisor in Florida, Tennessee, and Texas. Shell Capital is focused on asymmetric risk-reward and absolute return strategies and provides investment advice and portfolio management only to clients with a signed and executed investment management agreement. The observations shared on this website are for general information only and should not be construed as advice to buy or sell any security. Securities reflected are not intended to represent any client holdings or any recommendations made by the firm. I observe the charts and graphs to visually see what is going on with price trends and volatility, it is not intended to be used in making any determination as to when to buy or sell any security, or which security to buy or sell. Instead, these are observations of the data as a visual representation of what is going on with the trend and its volatility for situational awareness. I do not necessarily make any buy or sell decisions based on it. Any opinions expressed may change as subsequent conditions change. Do not make any investment decisions based on such information as it is subject to change. Investing involves risk, including the potential loss of principal an investor must be willing to bear. Past performance is no guarantee of future results. All information and data are deemed reliable but is not guaranteed and should be independently verified. The presence of this website on the Internet shall in no direct or indirect way raise an implication that Shell Capital Management, LLC is offering to sell or soliciting to sell advisory services to residents of any state in which the firm is not registered as an investment advisor. The views and opinions expressed in ASYMMETRY® Observations are those of the authors and do not necessarily reflect a position of Shell Capital Management, LLC. The use of this website is subject to its terms and conditions.
If we want to profit from the madness of crowds, we necessarily need to believe and do different things than the crowd at the extremes.
You may have heard the stock market was down a lot yesterday. I consider yesterday’s price action a black swan event. The -8% one-day decline was the worst day for S&P500 since 2008 and the 19th worst day since 1928.
The popular S&P 500 stock index dropped -7.6%, which was enough to trigger a circuit breaker to halt trading for the first time in 23 years. Circuit breakers are the thresholds when, if reached during a single-day decline in the S&P 500, trading is halted. Circuit breakers halt trading on US stock markets during dramatic price declines and are set at 7%, 13%, and 20% of the closing price for the previous day.
After yesterday’s waterfall decline, the price trend of the S&P 500 lost the 24% gain it had achieved a month ago.
Interestingly, we’re seeing “mean reversion” as the SPX is now all the way back to the same level it reached in January 2018. In investment management, mean reversion is the theory that a stock’s price will tend to move to the average price over time. This time it did.
US equity investors would have been better off believing the market was too overvalued then and shifting to short term Treasuries. But, who would have been able to do that? Who wouldn’t have had the urge to jump back in on some of the enormous up days the past two years? There’s the real challenge: investor behavior. And yes, some may even look back and say they knew then but didn’t do anything. If we believed it then, we can go back and read out notes we made at the time. But, it wouldn’t matter if a belief isn’t acted on. I’m a trigger puller, I pull the trigger and do what I believe I should do in pursuit of asymmetric risk/reward for asymmetry.
Dow Jones is down -16.4% YTD at this point.
The Dow Jones has also experienced some “mean reversion” over the 3-year time frame.
Mid-cap stocks, as measured by the S&P 400, are down, even more, this year, in the bear market territory.
Small-cap stocks, considered even riskier, are now down -23% in 2020.
Clearly, the speed and magnitude of this waterfall decline have been impressive since the February 19th top just three weeks ago. Decreases in these broad stock indexes of -20% are indications of a strong desire to sell and yesterday, panic selling.
So, -20% from peak, the stock market decline has reached bear market territory and is now nearly in-line with the typical market-sell off since 1928 that preceded an upcoming recession.
Global Equity Market Decline
And by the way, it wasn’t just US equities, the selling pressure was global with some markets like Russia, Australia, Germany, Italy, and Brazil down much more.
Extreme Investors Fear is Driving the Stock Market
Indeed, after Extreme Fear is driving the stock market according to investor sentiment measures. A simple gauge anyone can use is the Fear & Greed Index, which measures seven different indicators.
As of today, it shows the appetite for risk is dialed back about as close to zero it can get.
In the next chart, we can observe the relative level of the gauge to see where it is comparable to the past. While this extreme level of fear can stay elevated for some time, it has now reached the lowest levels of 2018. It’s important to note this isn’t a market timing indicator, and it does not always provide a timely signal. As you can see, at prior extreme lows such as this, the fear remained extreme for some time as the indicator oscillated around for a while. It’s a process, not an event. Investor sentiment measures like this tell us investors are about as scared as they get at their extreme level of fear is an indication those who wanted to sell may have sold.
Monitoring Market Conditions
My objective is asymmetric investment returns, so I look to find an asymmetric risk-reward in a new position. An asymmetric return profile is created by a portfolio of asymmetric risk-reward payoffs. For me, these asymmetric payoffs are about low-risk entries created through predefined exits and how I size the positions at the portfolio level. As such, I’ve been entering what I consider to be lower risk points when I believe there is potentila for an asymmetric payoff. Sometimes these positions are entering a trend that is already underway and showing momentum. The market is right most of the time, but they get it wrong at extremes on both ends. I saw that because of my own personal observations for more than two decades of professional money management, which is confirmed, markets and behavior really haven’t changed.
Humphrey B. Neill, the legendary contrarian whose book “The Art of Contrary Thinking,” published in 1954, including the same observations nearly seventy years ago.
“The public is right more of the time than not ” … but “the crowd is right during the trends but wrong at both ends.”
As market trends reverse and develop, we see a lot of indecision about if it will keep falling or reverse back up, which results in volatility as prices spread out wider driven by this indecisiveness. Eventually, the crowd gets settled on once side and drives the price to trend more in one direction as the majority of capital shifts enough demand to overwhelm the other side.
Risk Manager, Risk Taker
At these extremes, I have the flexibility to shift from a trend following strategy to a countertrend contrarian investment strategy. My ability to change along with conditions is why I am considered an “unconstrained” investment manager. I have the flexibility to go anywhere, do anything, within exchange-traded securities. By “go anywhere,” I mean cash, bonds, stocks, commodities, and alternatives like volatility, shorting/inverse, real estate, energy MLPs, etc. I give myself as broad of an opportunity set as possible to find potentially profitable price trends. So, as prices have been falling so sharply to extremes, I was entering new positions aiming for asymmetric risk/reward. I was able to buy at lower prices because I had also reduced exposure at prior higher prices. As trends became oversold as measured by my systems, I started increasing exposure for a potential countertrend.
On ASYMMETRY® Observations, I’m writing for a broad audience. Most of our clients read these observations as do many other investment managers. My objective isn’t to express any detail about my specific buying and selling, but instead overall observations of market conditions to help you see the bigger picture as I do. As long time readers know, I mostly use the S&P 500 stock index for illustration, even though I primarily trade sectors, stocks, countries; an unconstrained list of global markets. I also share my observations on volatility, mostly using the VIX index to demonstrate volatility expansions/contractions. At the extremes, I focus a lot of my observations on extremes in investor sentiment and breadth indicators to get an idea of buying and selling pressure that may be drying up.
Market Risk Measurement
One of my favorite indicators to understand what is going on inside the stock market is breadth. To me, breadth indicators are an overall market risk measurement system. Here on ASYMMETRY® Observations, I try to show these indicators as simple as possible so that anyone can understand.
If we want to profit from the madness of crowds, we necessarily need to believe and do different things than the group at the extremes.
One of my favorite charts to show how the market has de-risked or dialed up risk is the percent of S&P 500 stocks above the moving average. As you see in the chart, I labeled the high range with red to signal a “higher risk” zone and the lower level in green to indicate the “lower risk” zone.
I consider these extremes “risk” levels because it suggests to me after most of the stocks are already in long term uptrends, the buying enthusiasm may be nearing its cycle peak. And yes, it does cycle up and down, as evidenced by the chart. As of yesterday’s close, only 17% of the S&P 500 stocks are trending above their 200-day moving average, so most stocks are in a downtrend. That’s not good until it reaches an extreme level, then it suggests we may be able to profit from the madness of crowds as they tend to overreact at extremes. The percent of S&P 500 stocks above the longer-term moving average has now declined into the green zone seen in late 2018, the 2015-16 period, 2011, but not as radical as 2008 into 2009. If this is the early stage of a big bear market, we can expect to see it look more like the 2008-09 period.
We can’t expect to ever know if equities will enter a bear market in advance. If you base your trading and investment decisions on the need to predict what’s going to happen next, you already have a failed system. You are never going to know. What I do, instead, is focus on the likelihood. More importantly, I predefined the amount of risk I’m willing to take and let it rip when the odds seem in my favor. After that, I let it all unfold. I know I’ll exit if it falls to X, and my dynamic risk management system updates this exit as the price moves up to eventually take profits.
Zooming in to the shorter trend, the percent of stocks above their 50 day moving average has fallen all the way down to only 5% in an uptrend. This means 95% of the S&P 500 stocks are in shorter-term downtrends. We can interpret is as nearly everyone who wants to sell in the short term may have already sold.
I can always get worse. There is no magical barrier at this extreme level that prevents it from going to zero stocks in an uptrend and staying there a long time as prices fall much more. But, as you see in the charts, market breadth cycles up and down as prices trend up and down.
If we are in the early stage of a big bear market, I expect there will be countertrends along the way if history is a guide. I’ve tactically traded through bear markets before, and the highlight of my career was my performance through the 2007-09 period. I didn’t just exit the stock market and sit there, I traded the short term price trends up and down. If someone just exited the stock market and sit there, that may have been luck. If we entered and exited 8 or 10 different times throughout the period with a positive asymmetry of more significant profits than losses, it may have required more skill. I like my managed portfolio to be in synch with the current risk/reward characteristics of the market. If that is what we are achieving, we may have less (or hedged) exposure at the peak and more exposure after prices fall. I believe we should always be aware of the potential risk/reward the market itself is providing, and our investment strategy should dynamically adapt to meet these conditions.
If we want to profit from the madness of crowds, it means we have some cash or the equivalent near trend highs and reenter after prices fall. It may also be achieved by hedging near highs and using profits from the hedge to increase exposure after prices have dropped. It sounds like a contrarian investor. To be a contrarian investor at extremes to profit from a countertrend, we study crowd behavior in the stock market and aim to benefit from conditions where other investors/traders act on their emotions. These extremes of fear and greed are seen at major market turning points, presenting the disciplined contrarian with opportunities to both enter and exit the market.
This crowd psychology has been observed for many decades, and unfortunately, investors and traders are excellent lab rates to study the behavior.
Believe it or not, 179 years ago, in 1841, Charles Mackay published his book “Extraordinary Popular Delusions and the Madness of Crowds” in which discussing the South Sea Bubble and Dutch Tulip Mania as examples of this mass investment hysteria. People haven’t changed. As a crowd, we the people still underreact to initial information and then overreact at the extremes.
As Mackay observed nearly two centuries ago:
“Men, it has been well said, think in herds; it will be seen that they go mad in herds, while they only recover their senses slowly, and one by one.”
Once people begin to go with the crowd, their thinking can become irrational and driven by the emotional impulses of the crowd rather than on their own individual situation.
According to studies like DALBAR’sQuantitative Analysis of Investor Behavior (QAIB), individual investors have poor results over the long haul. QAIB has measured the effects of investor decisions to buy, sell and switch into and out of mutual funds over short and long-term timeframes since 1994 and finds people tend to do the wrong things at the wrong time. If we want to create different results from the majority, we must necessarily believe and do things differently.
At this point, we’ve seen fund flows from stocks to bonds reach extreme levels across multiple time frames as panic selling set in. I’m glad to say, while imperfect as to timing, I have done the opposite by shifting to short term US Treasuries at the prior high stock prices and then started rebuying stocks last week. Of course, I have predetermined points I’ll exit them if they fall, so I remain flexible and may change direction quickly, at any time.
I’m seeing a lot of studies showing that history suggests single-day waterfall declines like yesterday were followed by gains over the next few weeks. Rather than hoping past performance like that simply repeats, I prefer to measure the current risk level and factor in existing conditions.
It’s important to understand, as. I have pointed out many times before, that the US stock market has been in a very aged bull market that has been running 11 years now. And the longest on record. The US is also in the longest economic expansion in history, so we should be aware these trends will eventually change. But, when it comes to the stock market, longer trends are a process, not an event. Longer trends unfold as many smaller swings up and down along the way that may offer the potential for flexible tactical traders to find some asymmetry from the asymmetric risk/reward payoffs these conditions may create.
It’s also important to be aware the volatility expansion and waterfall decline the past three weeks seems to indicate a fragile market structure with a higher range of prices, so we’re likely to observe turbulence for some time. These conditions can result in amplified downtrends and uptrends.
Falling prices create forced selling by systematic investment managers similar to what we saw in the December 2018 market crash. As I’ve seen signals from my own systematic trend following and momentum systems shift, it’s no surprise to see some increased selling pressure that may be helped by more money in these programs.
We are in another period of extremes driven by the “madness of crowds,” and my plan is to apply my skills and experience with the discipline to tactically operate through whatever unfolds.
Mike Shell is the Founder and Chief Investment Officer of Shell Capital Management, LLC, and the portfolio manager of ASYMMETRY® Global Tactical. Mike Shell and Shell Capital Management, LLC is a registered investment advisor in Florida, Tennessee, and Texas. Shell Capital is focused on asymmetric risk-reward and absolute return strategies and provides investment advice and portfolio management only to clients with a signed and executed investment management agreement. The observations shared on this website are for general information only and should not be construed as advice to buy or sell any security. Securities reflected are not intended to represent any client holdings or any recommendations made by the firm. I observe the charts and graphs to visually see what is going on with price trends and volatility, it is not intended to be used in making any determination as to when to buy or sell any security, or which security to buy or sell. Instead, these are observations of the data as a visual representation of what is going on with the trend and its volatility for situational awareness. I do not necessarily make any buy or sell decisions based on it. Any opinions expressed may change as subsequent conditions change. Do not make any investment decisions based on such information as it is subject to change. Investing involves risk, including the potential loss of principal an investor must be willing to bear. Past performance is no guarantee of future results. All information and data are deemed reliable but is not guaranteed and should be independently verified. The presence of this website on the Internet shall in no direct or indirect way raise an implication that Shell Capital Management, LLC is offering to sell or soliciting to sell advisory services to residents of any state in which the firm is not registered as an investment advisor. The views and opinions expressed in ASYMMETRY® Observations are those of the authors and do not necessarily reflect a position of Shell Capital Management, LLC. The use of this website is subject to its terms and conditions.
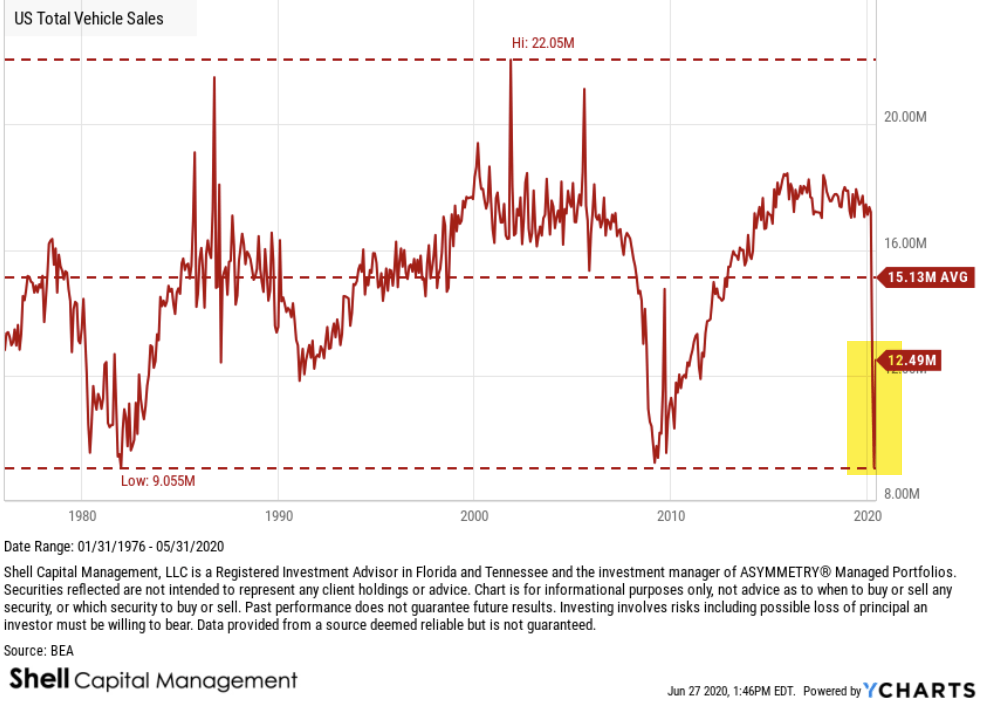
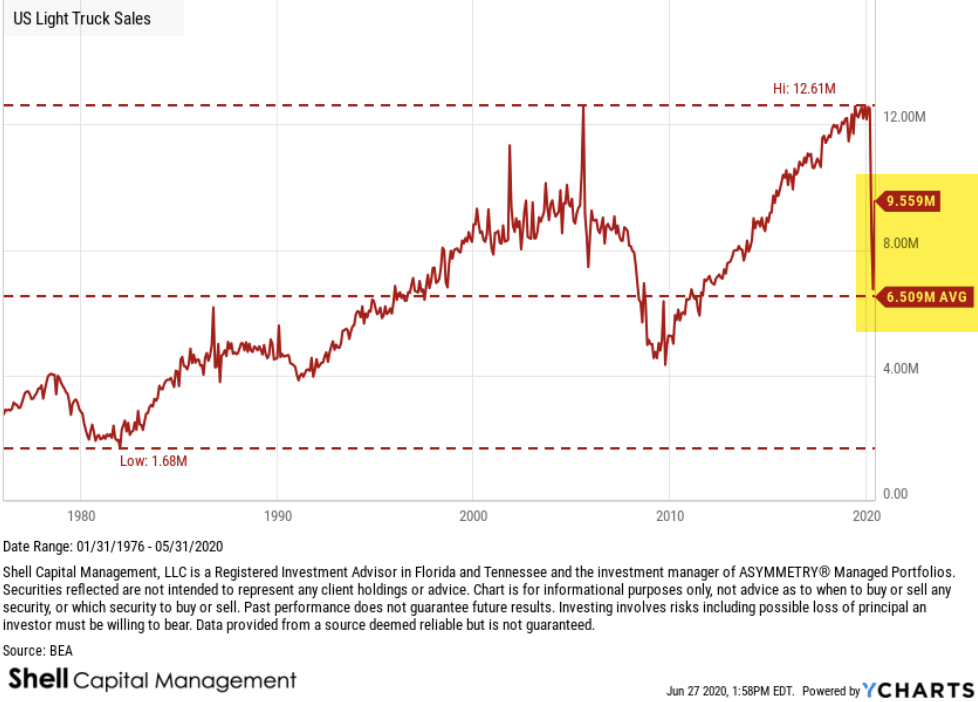
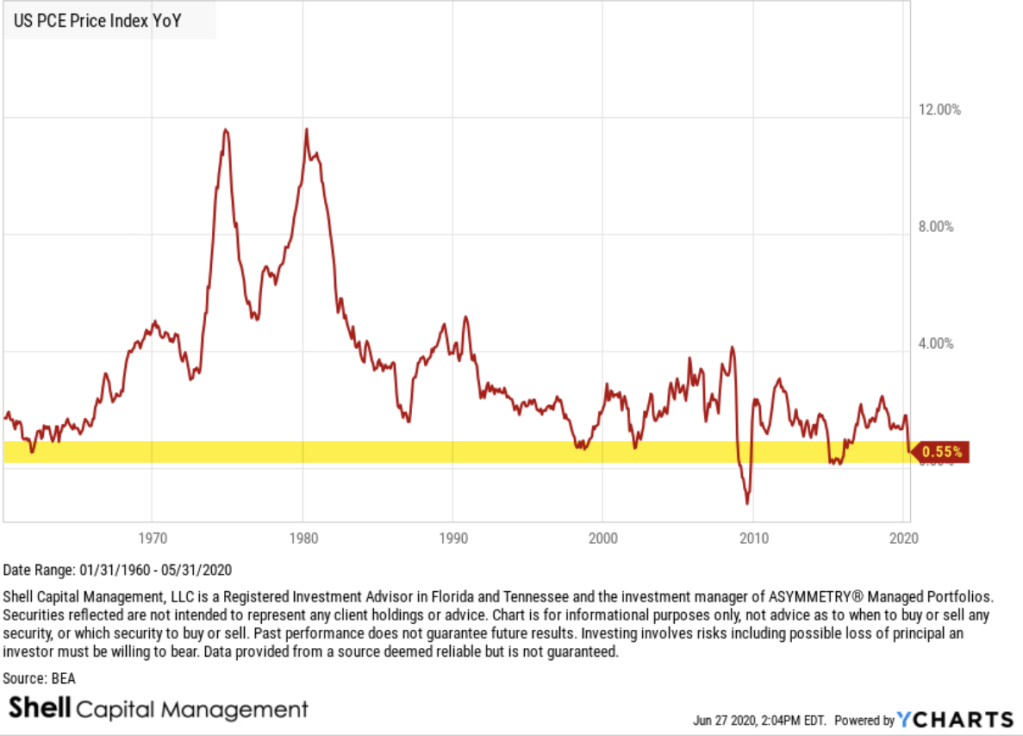
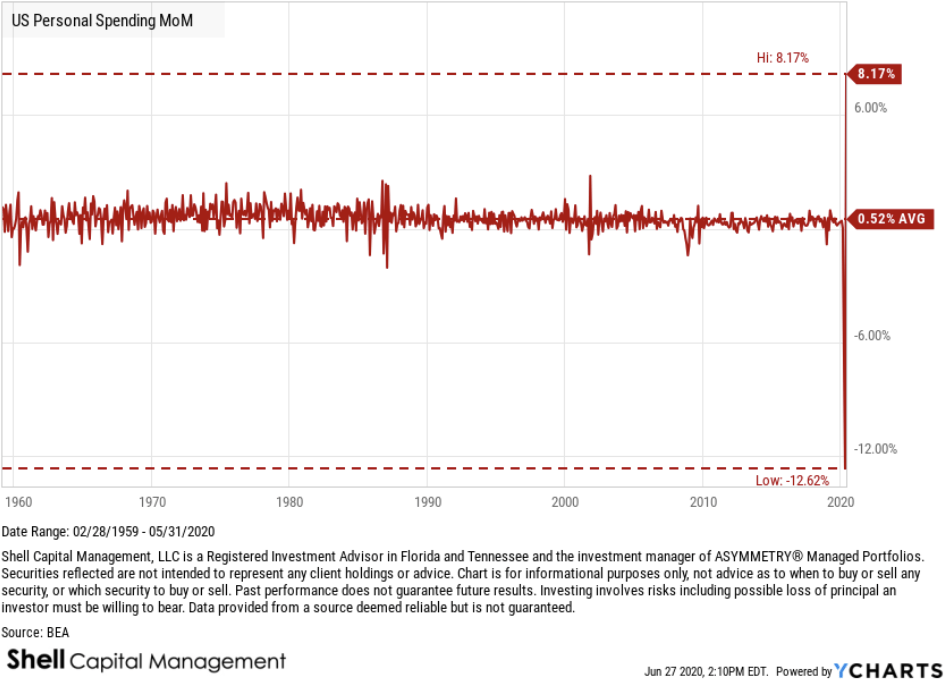
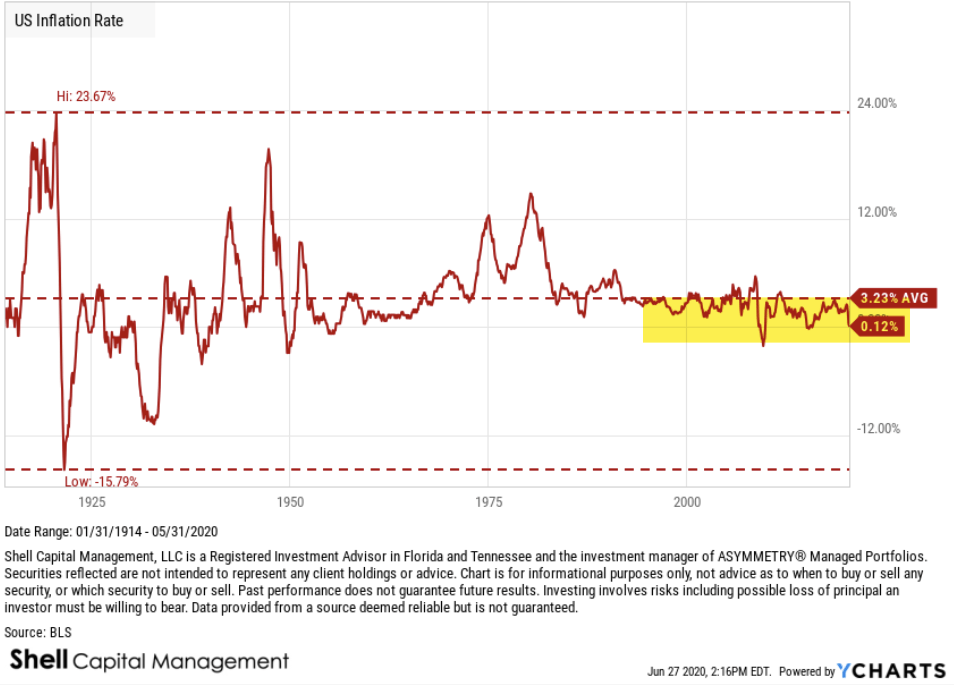
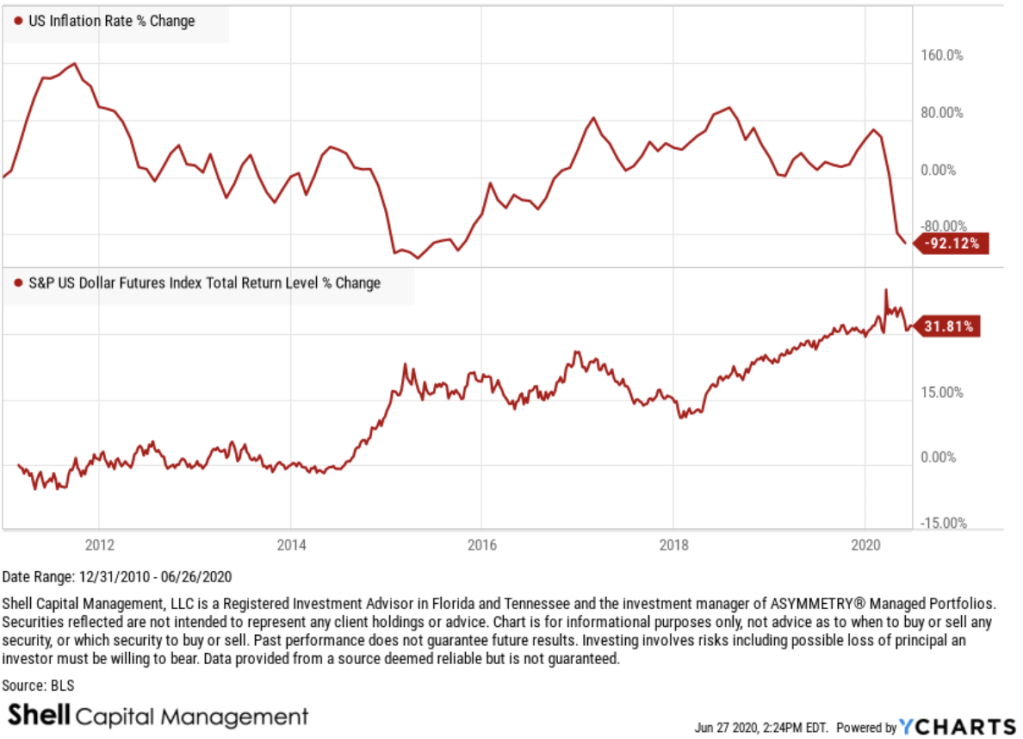
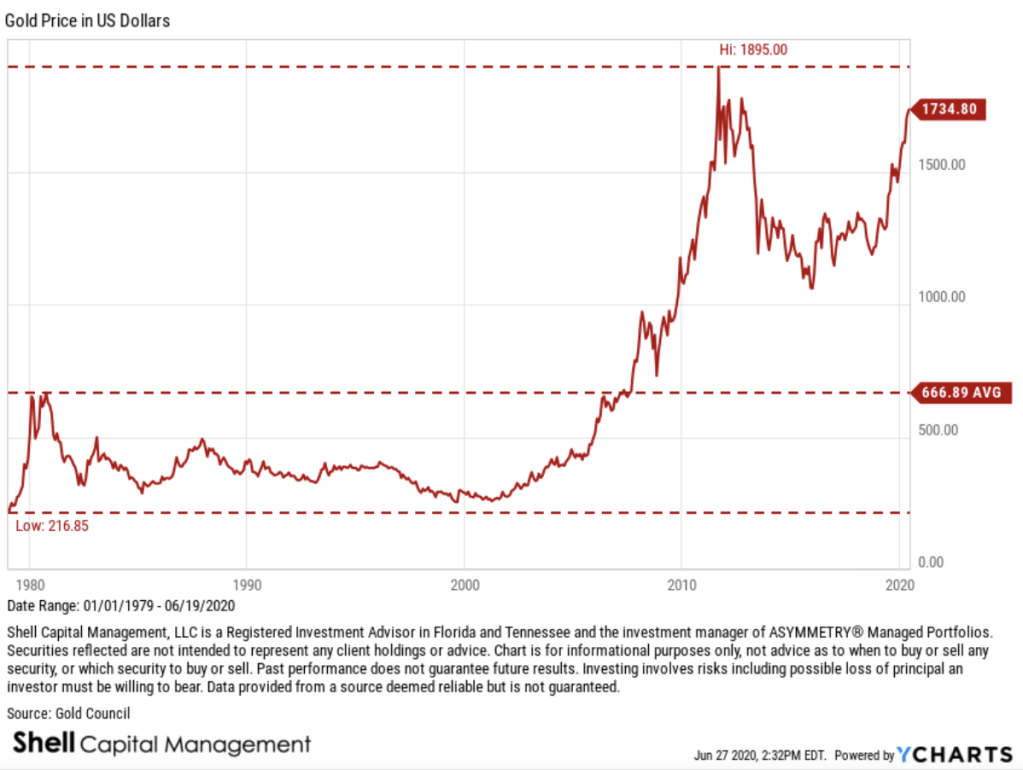
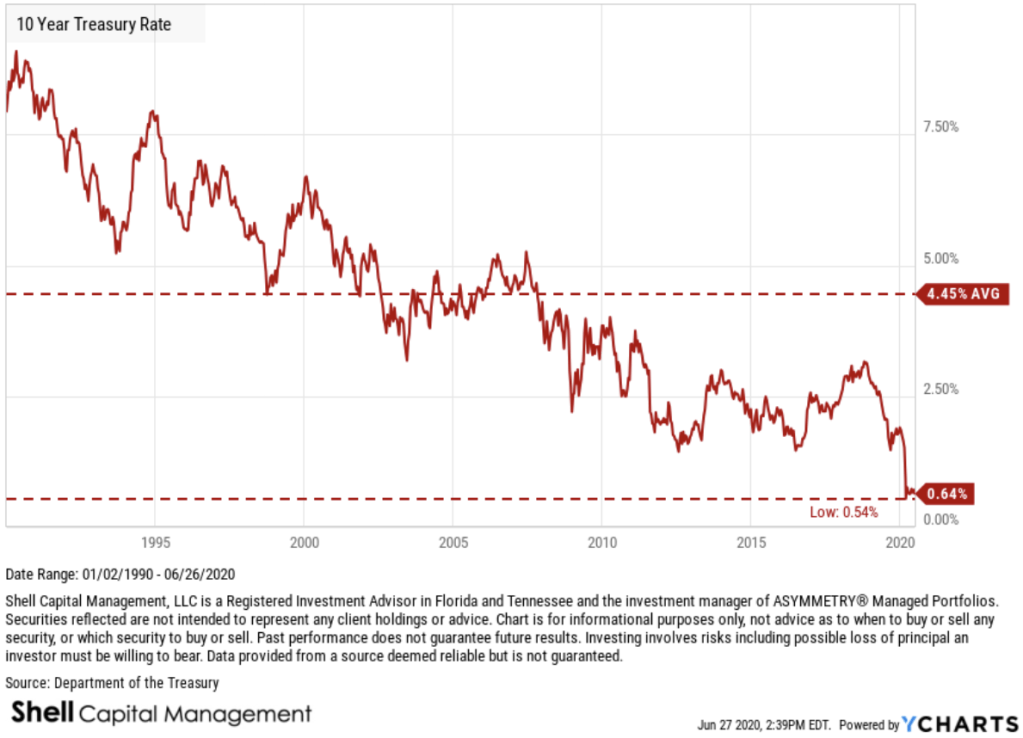
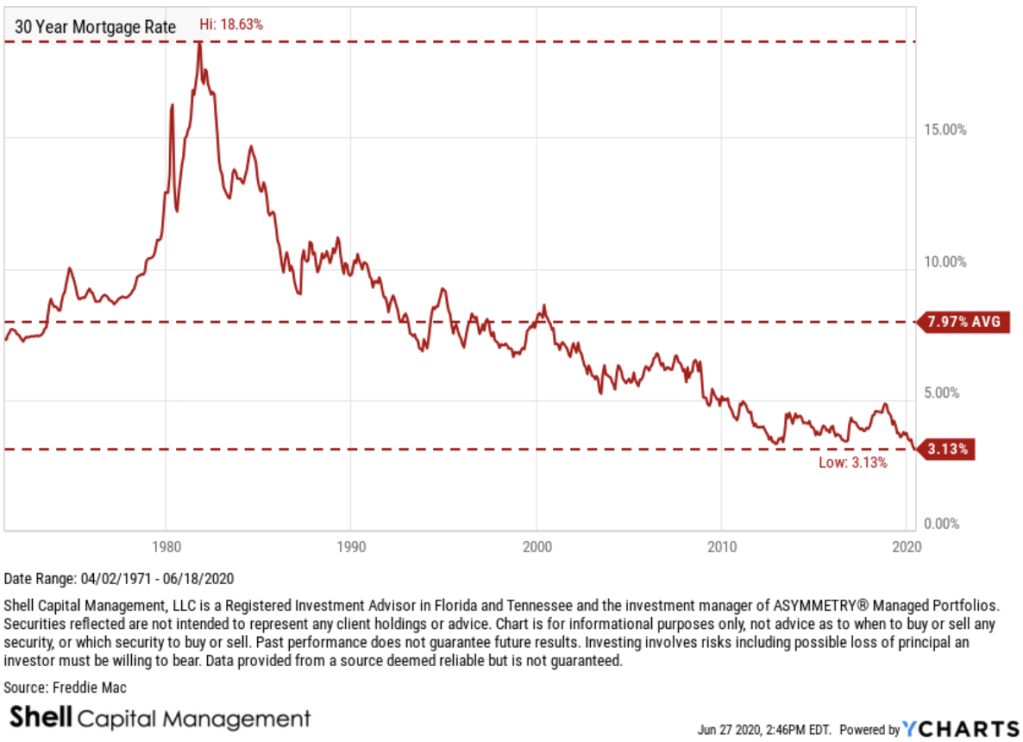
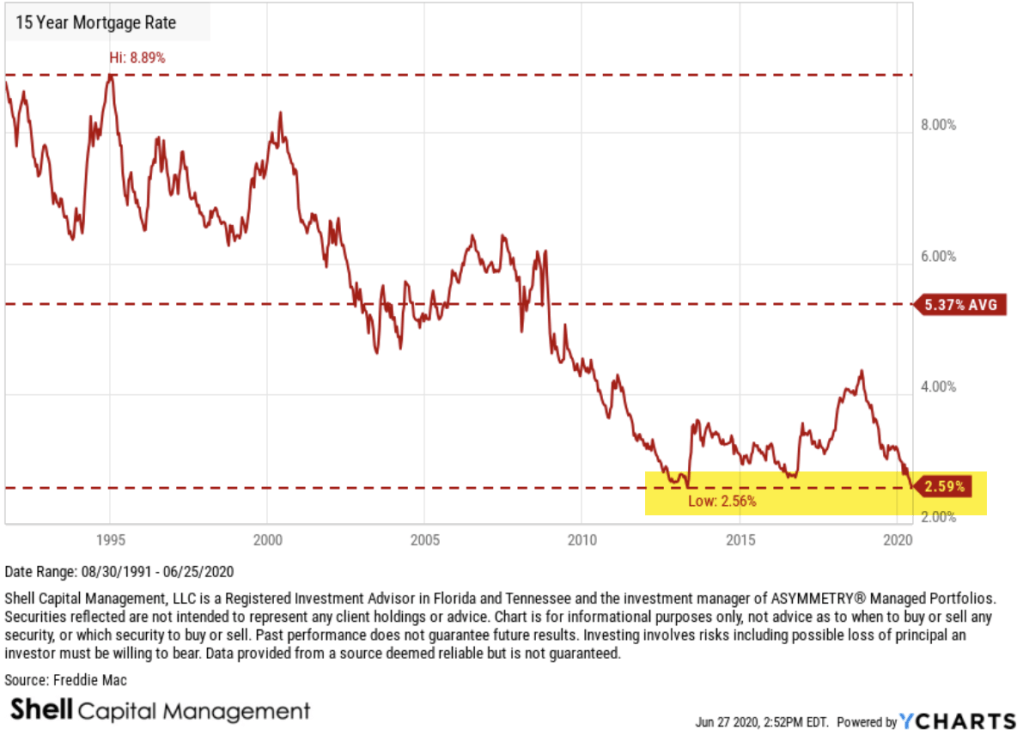
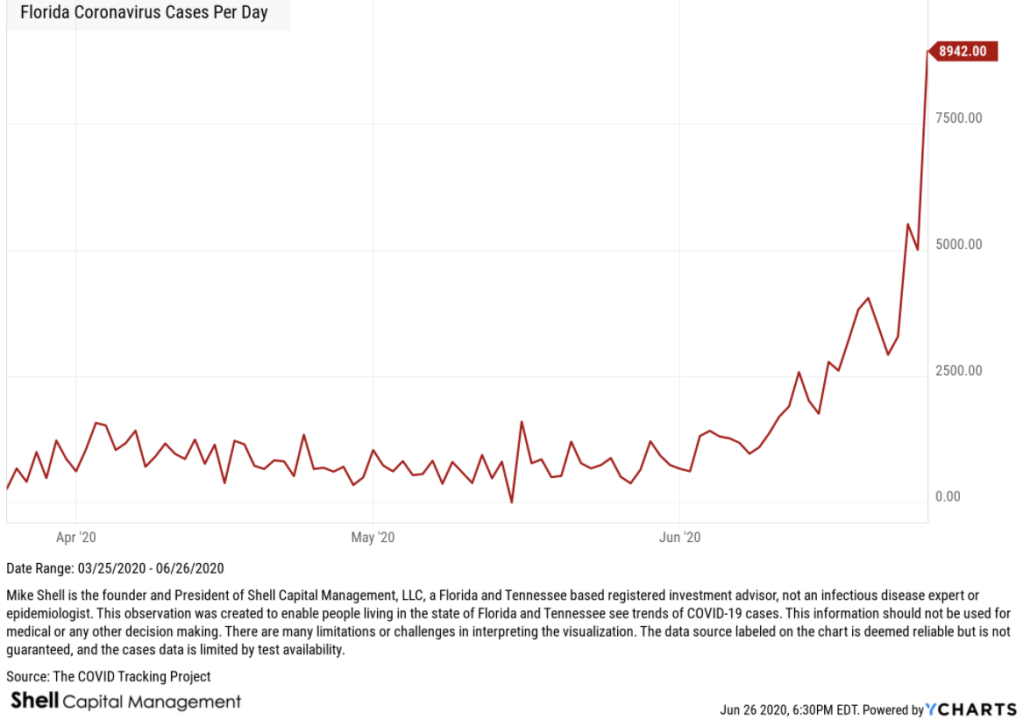
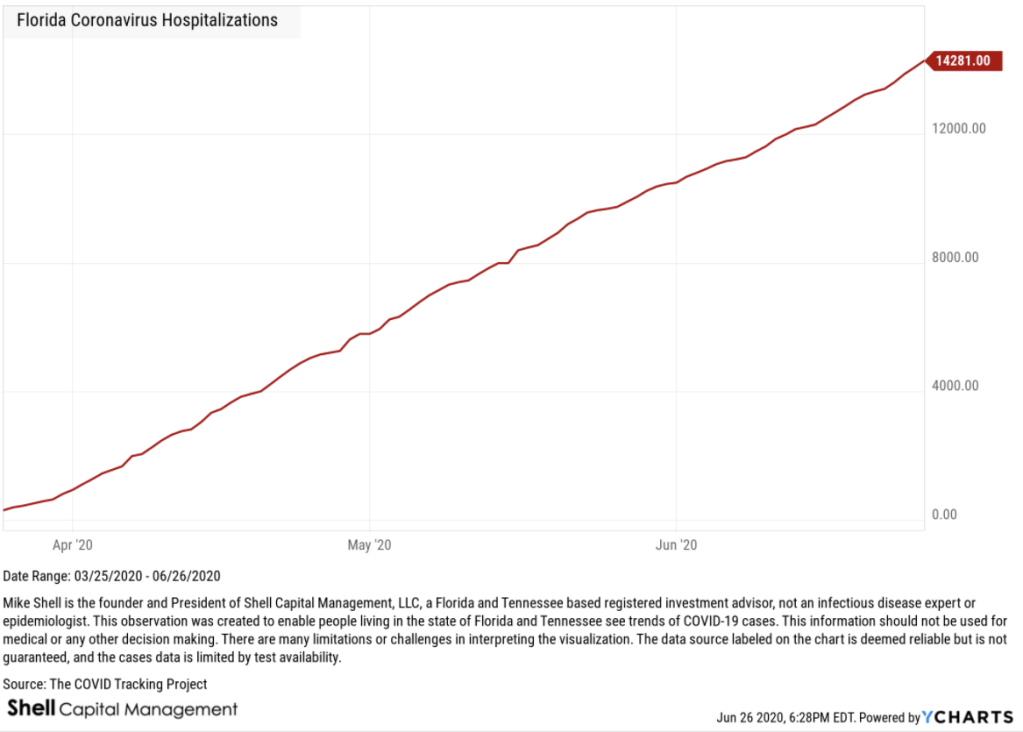
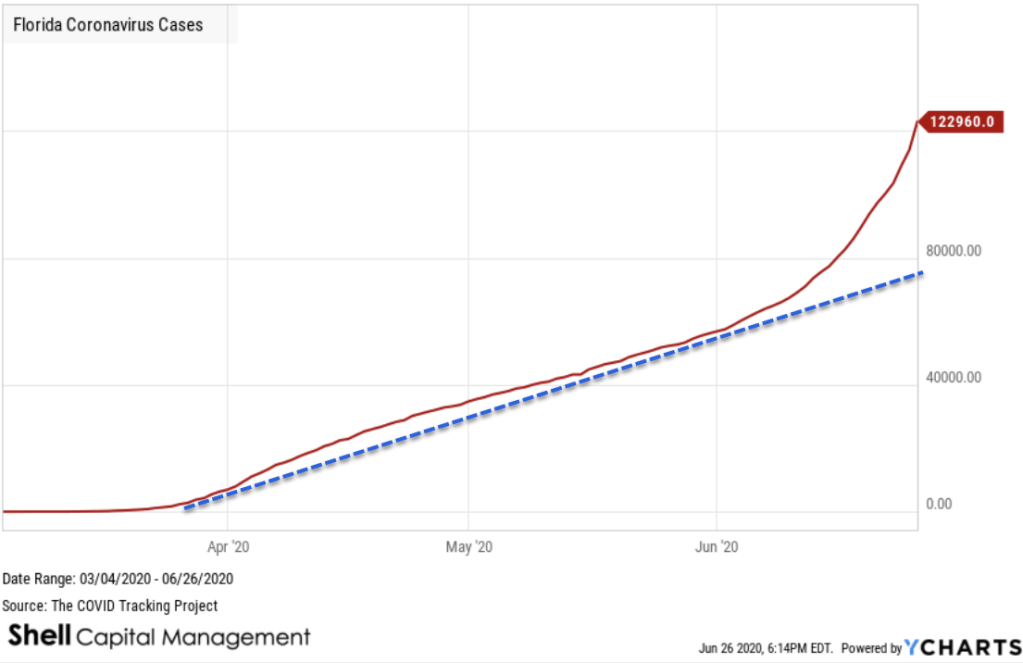
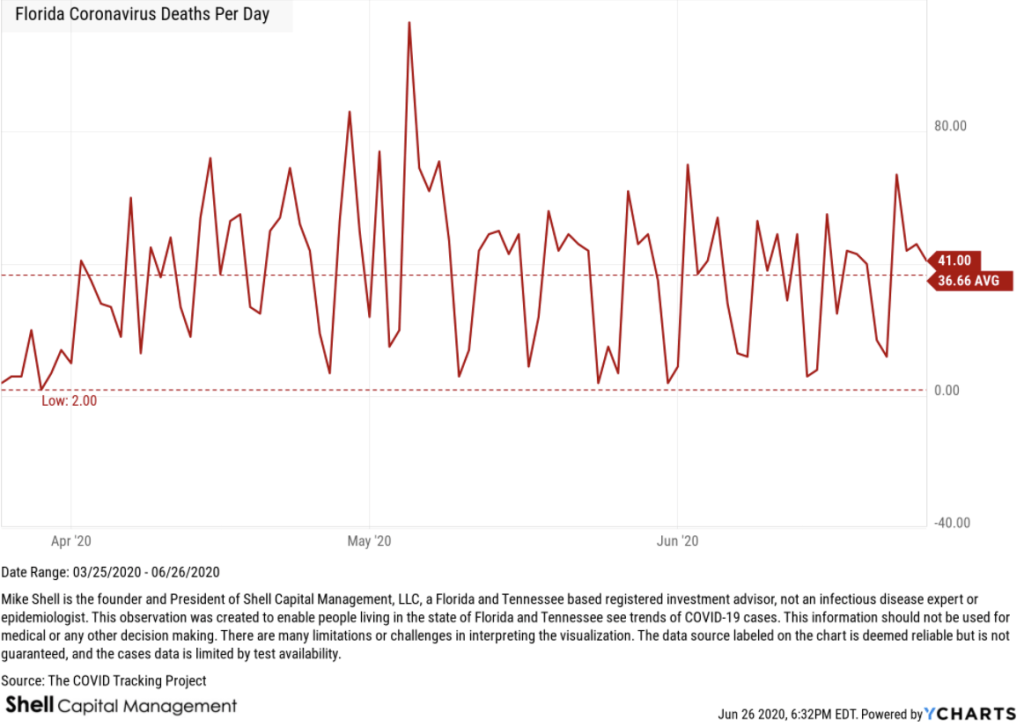
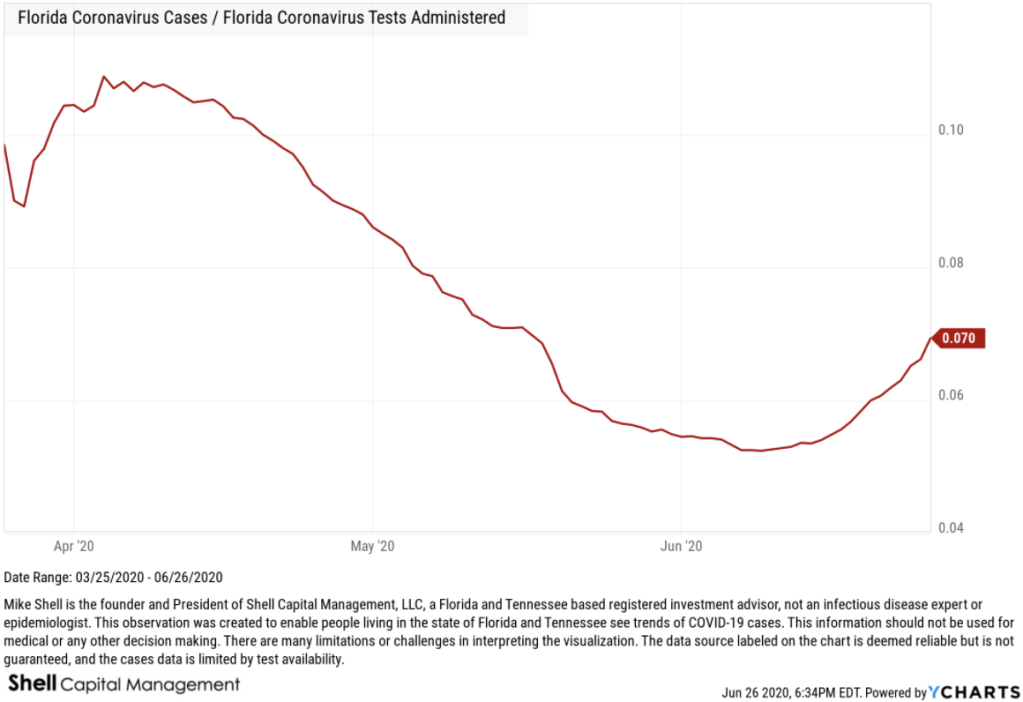
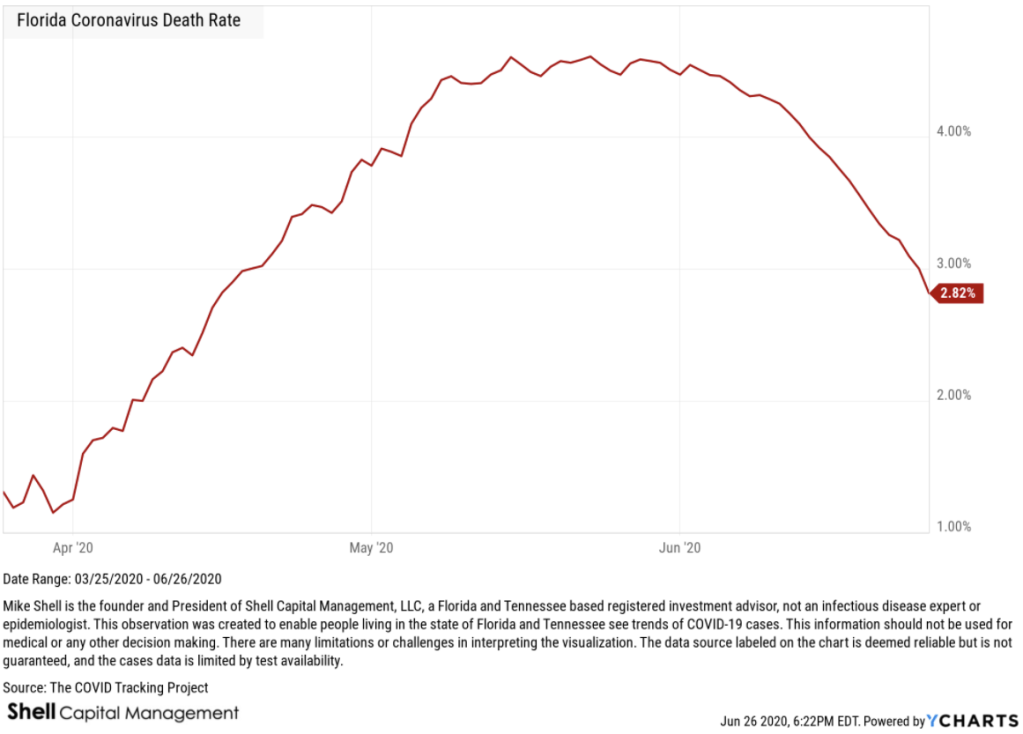
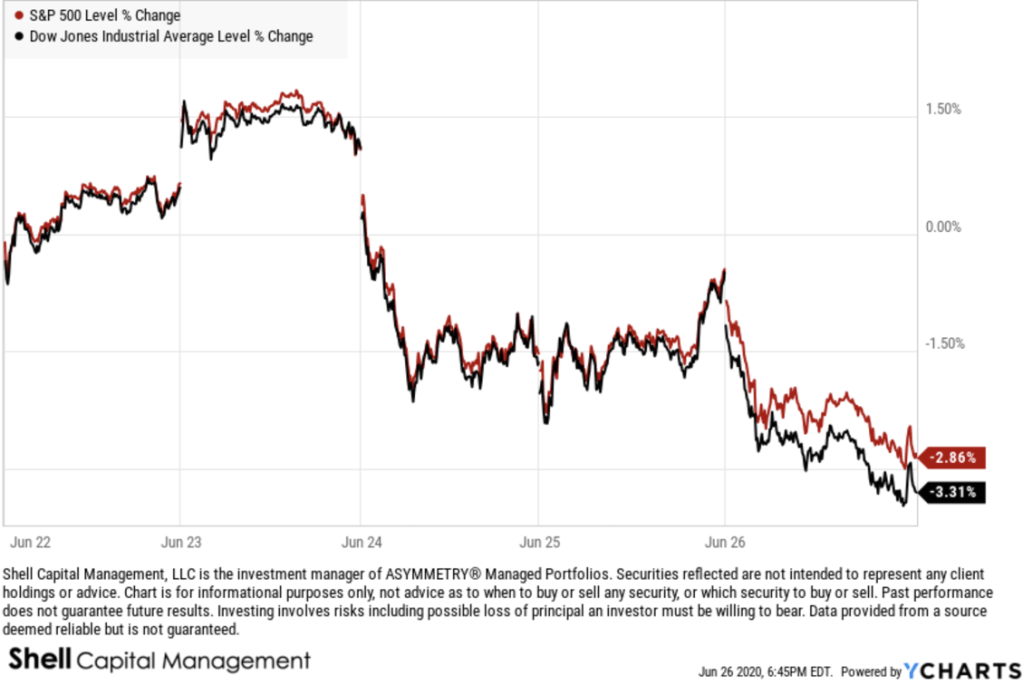
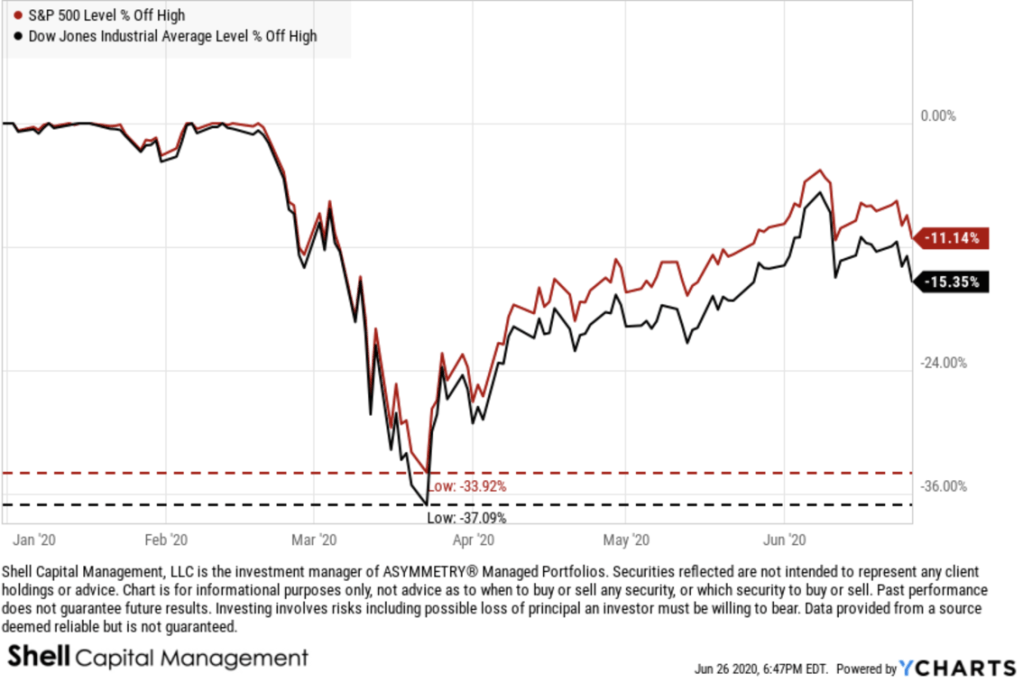
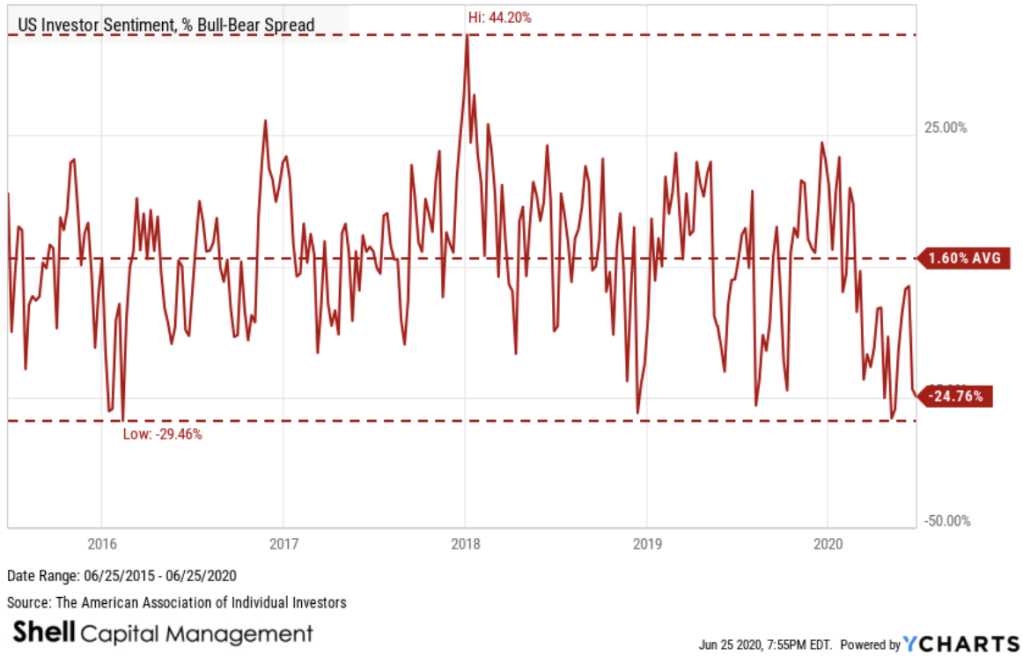
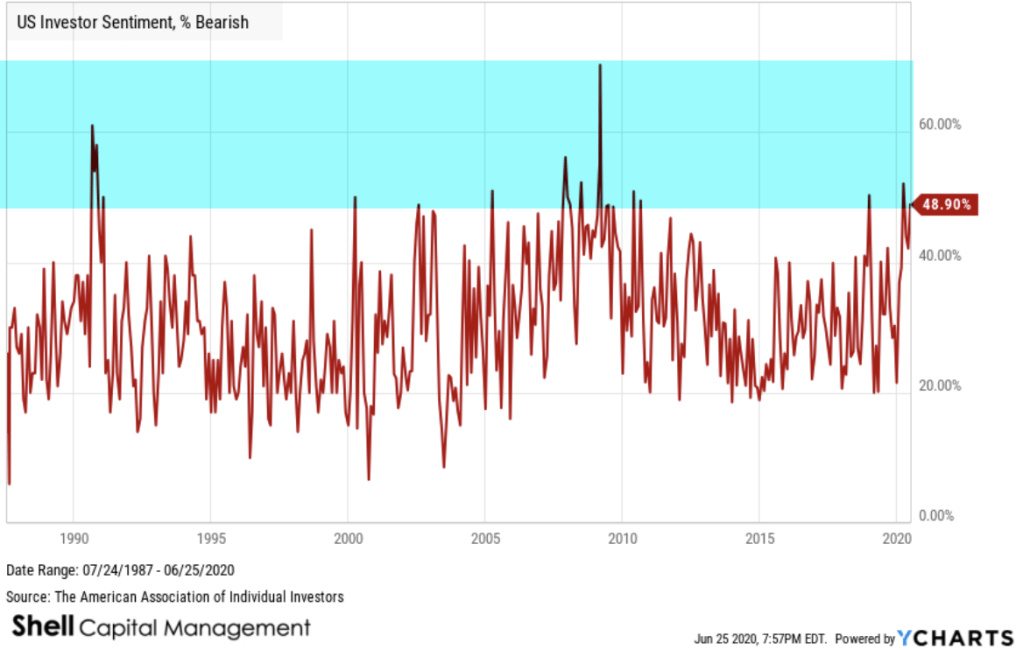
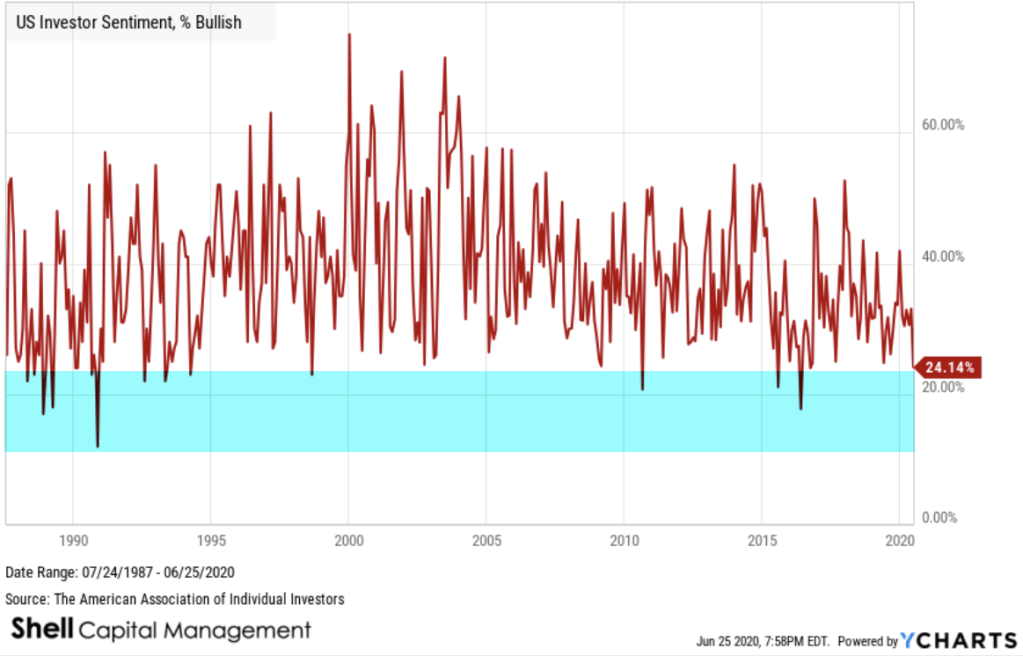
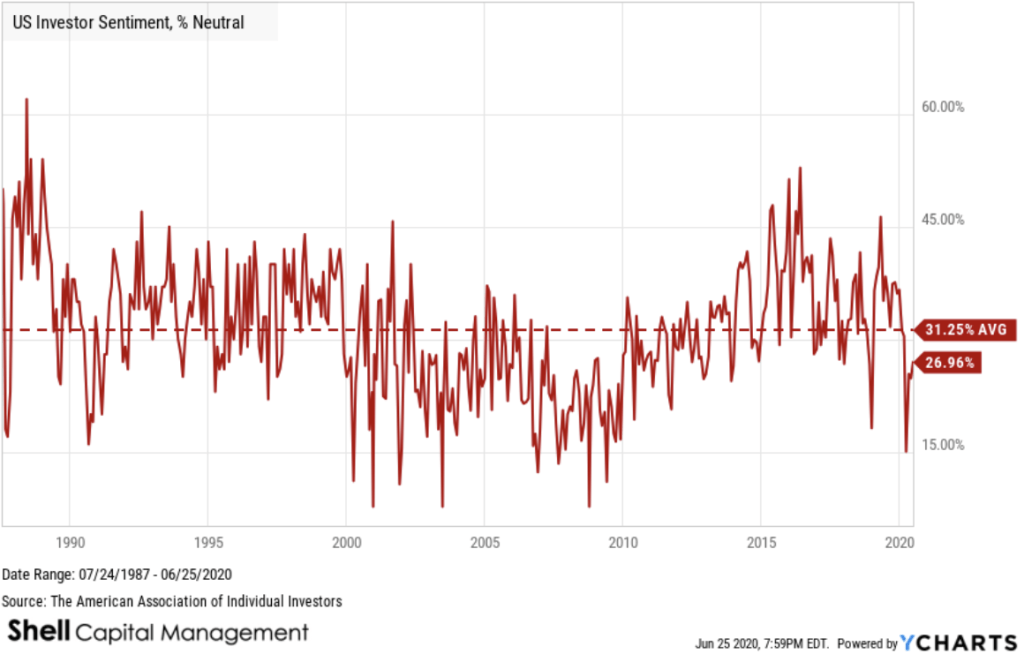
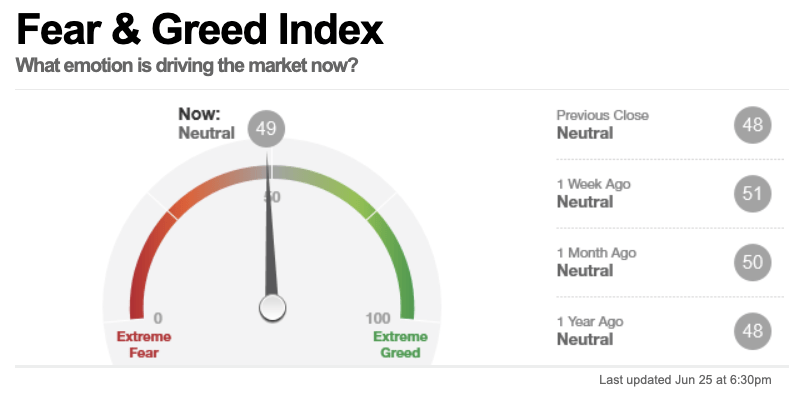
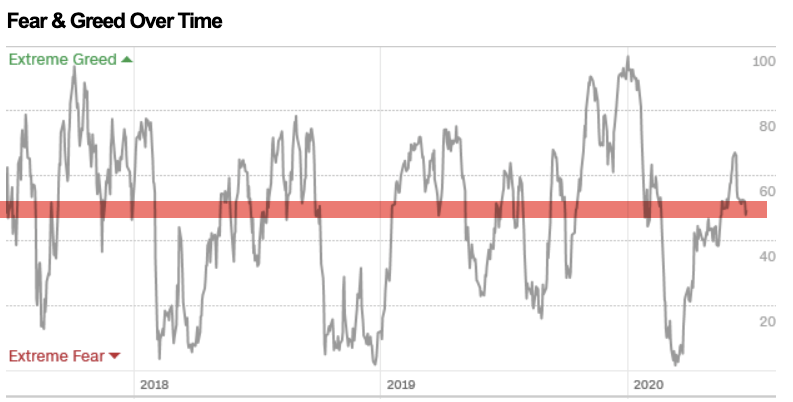
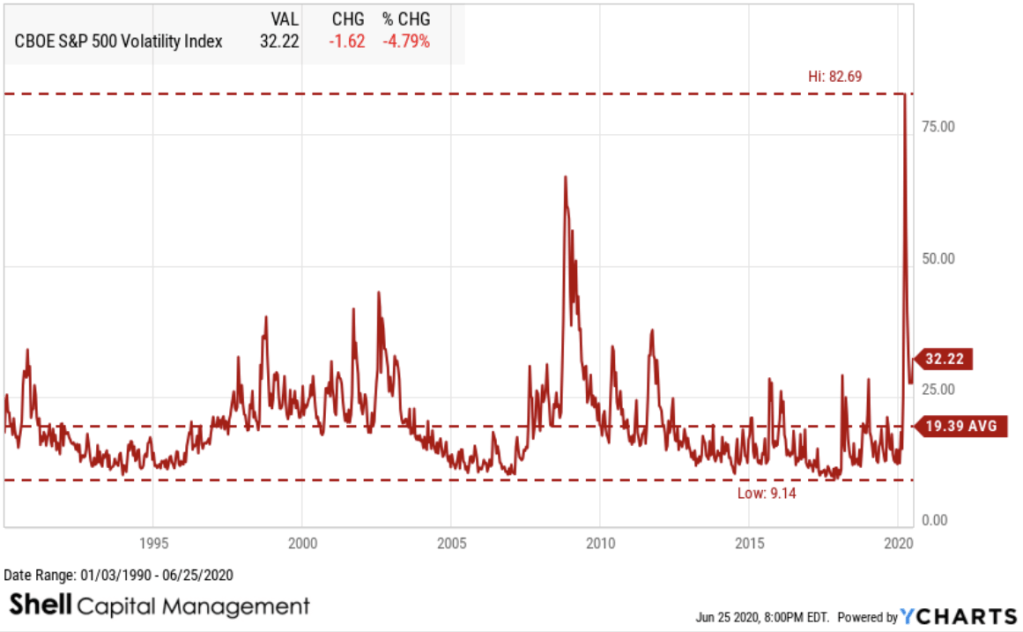
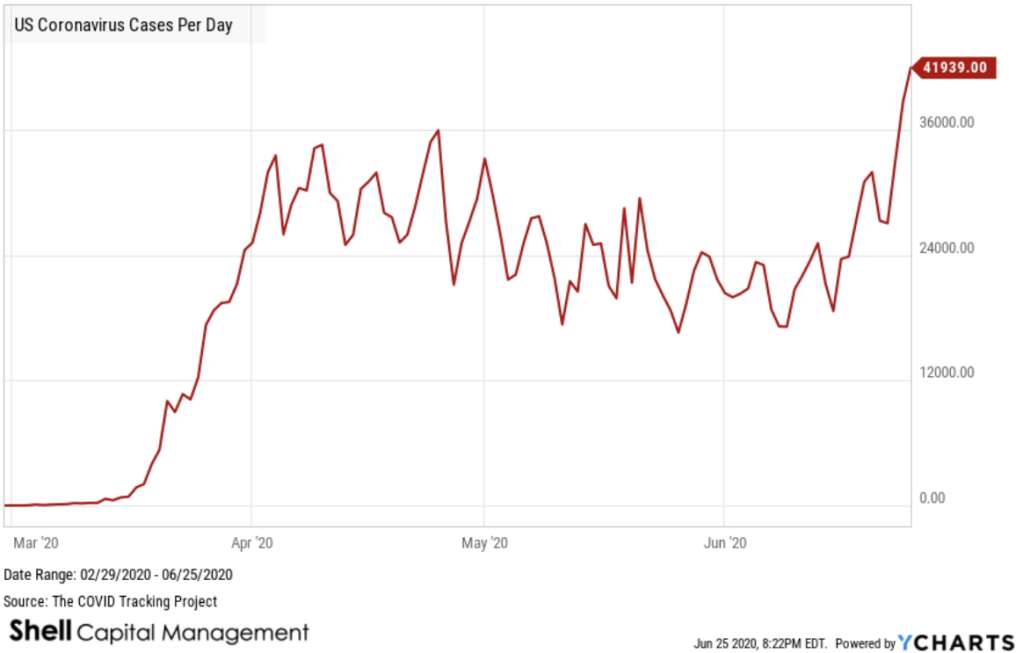
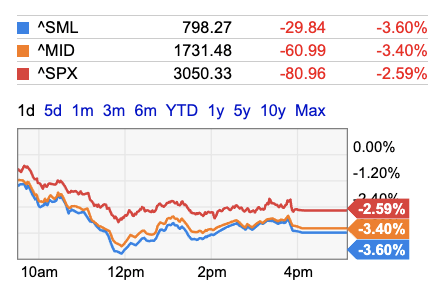
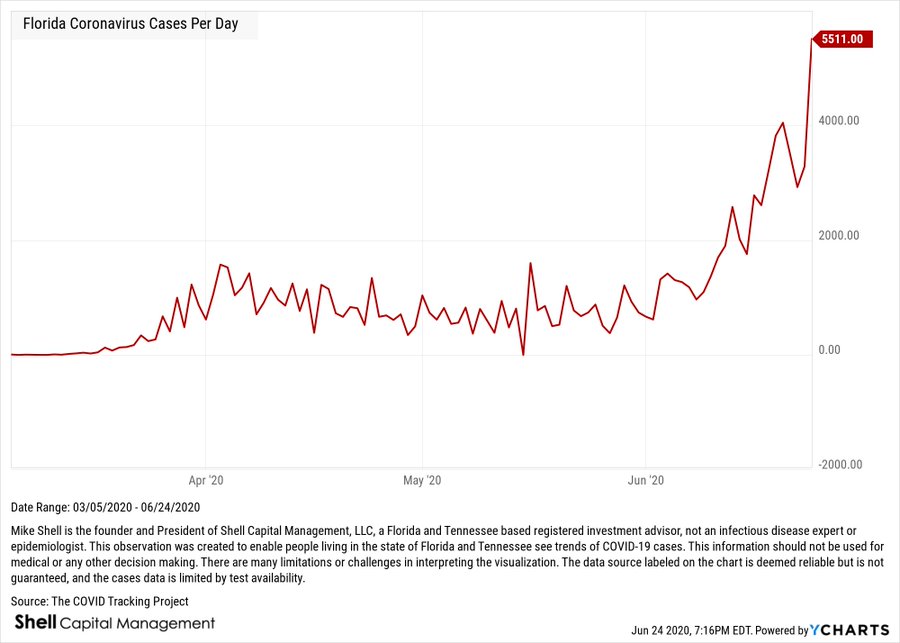
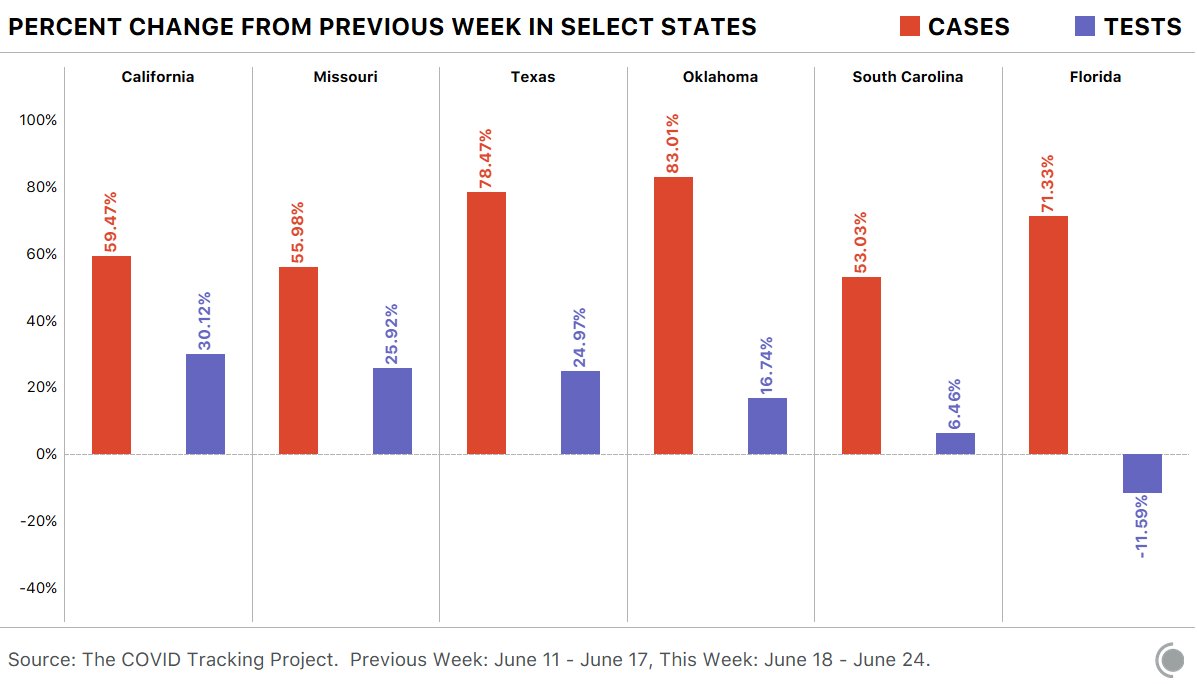
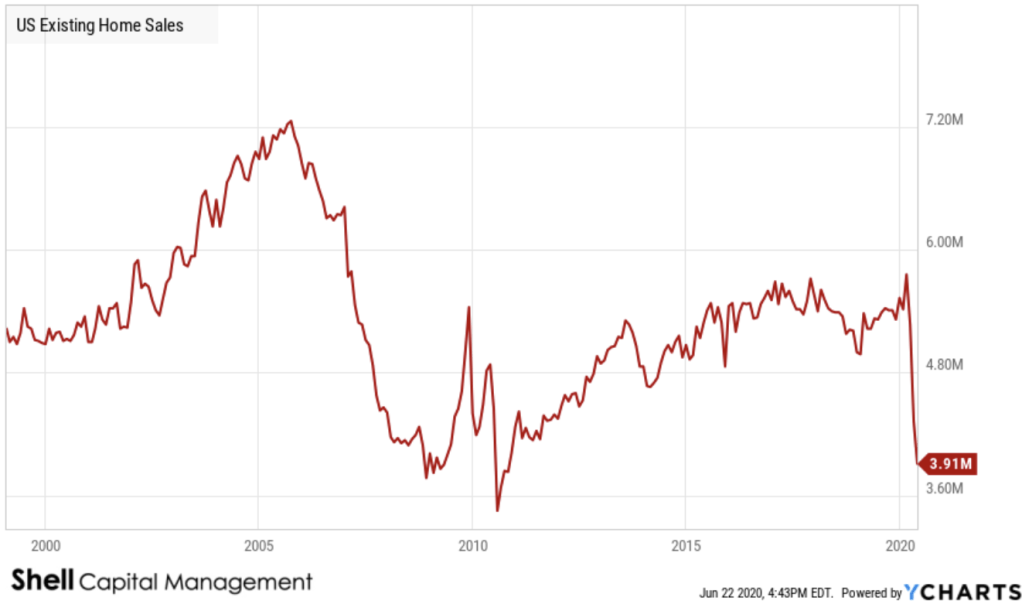
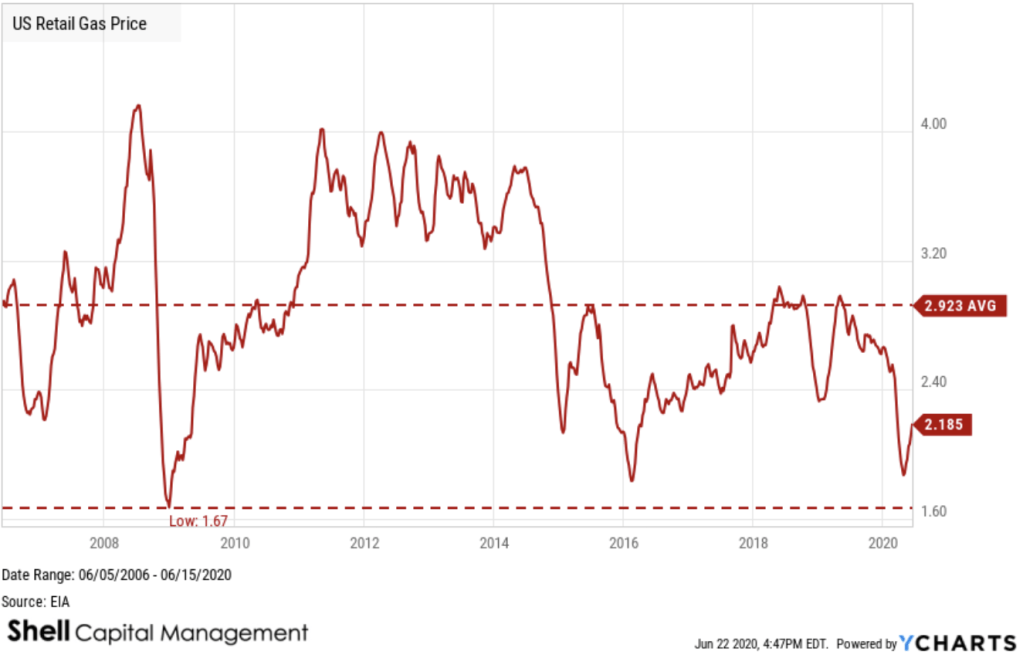
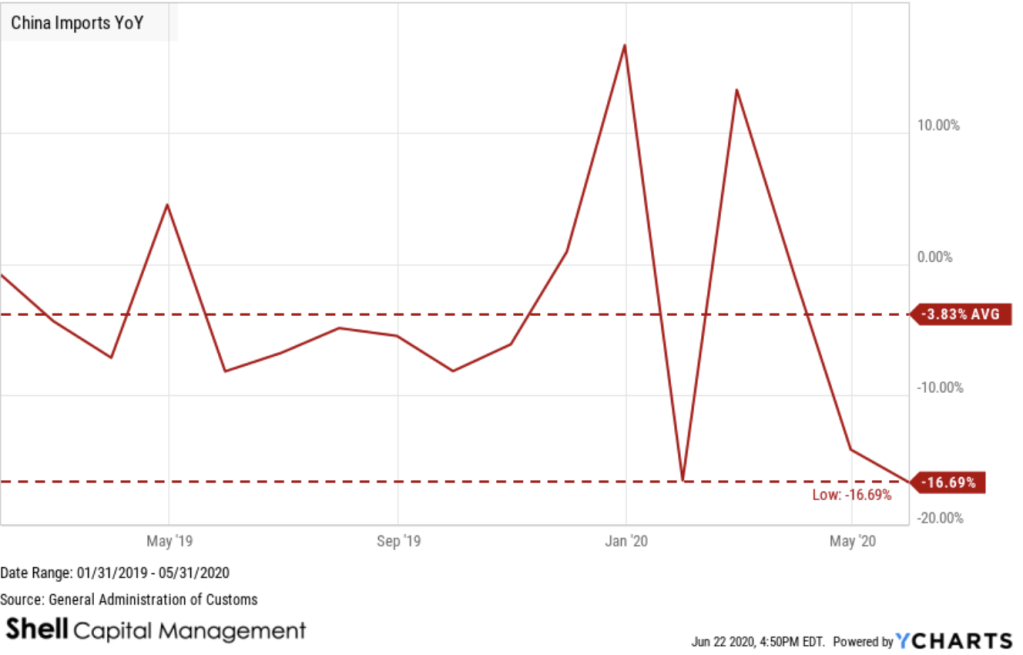
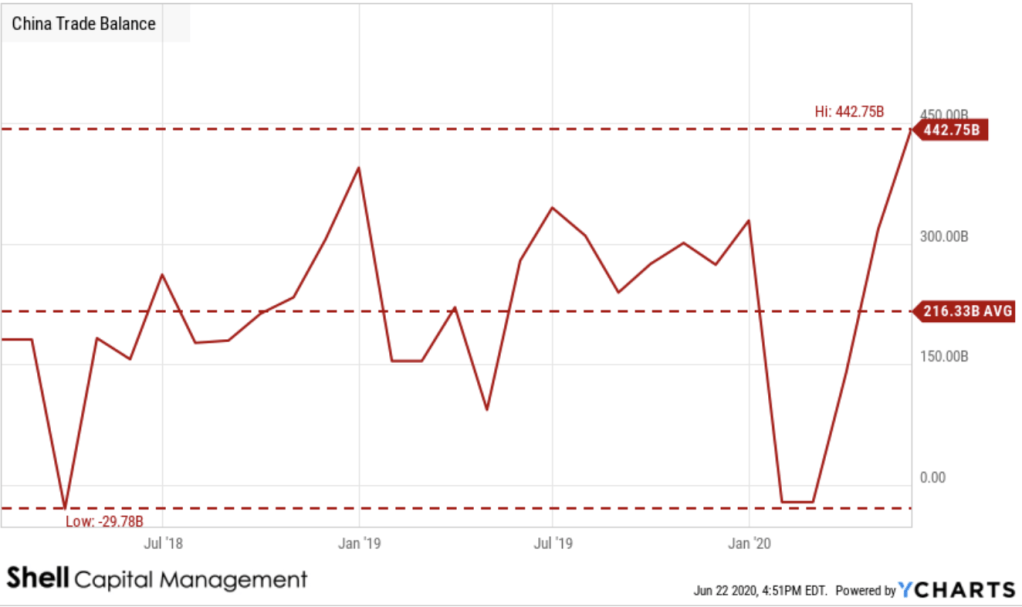
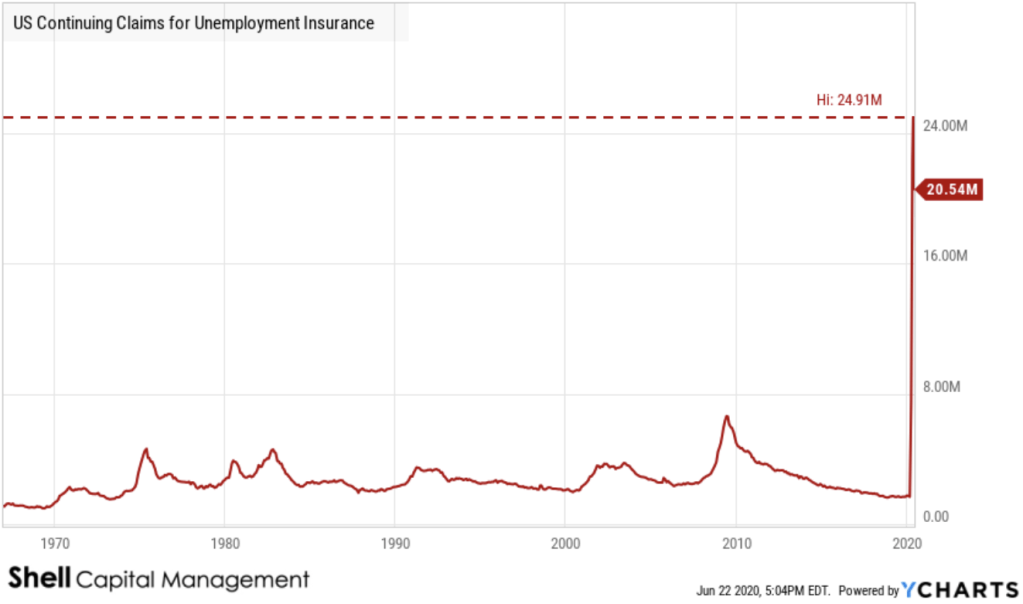
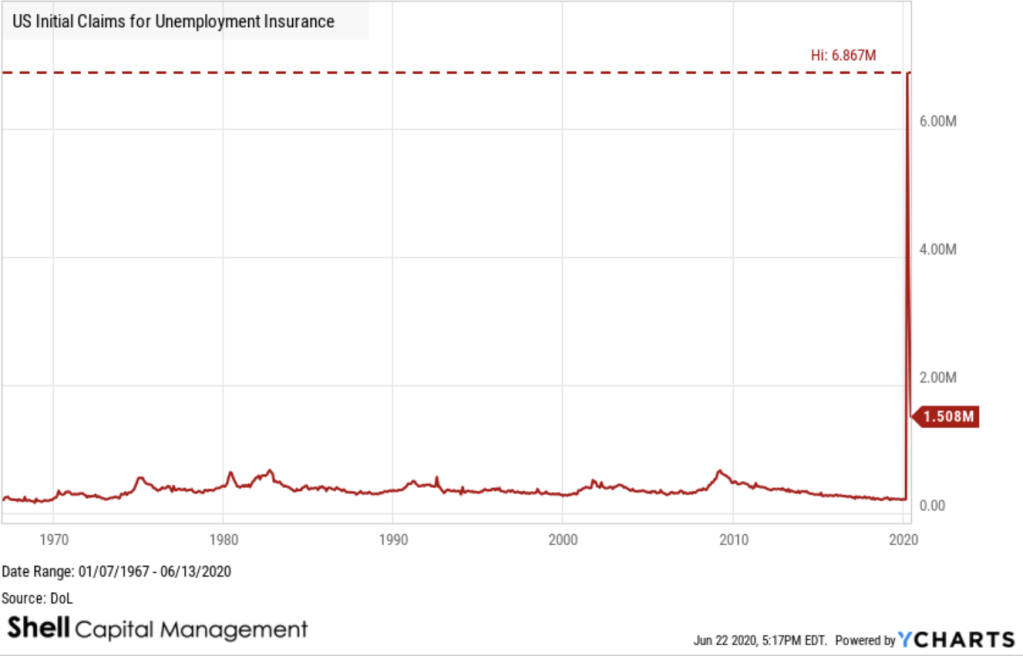
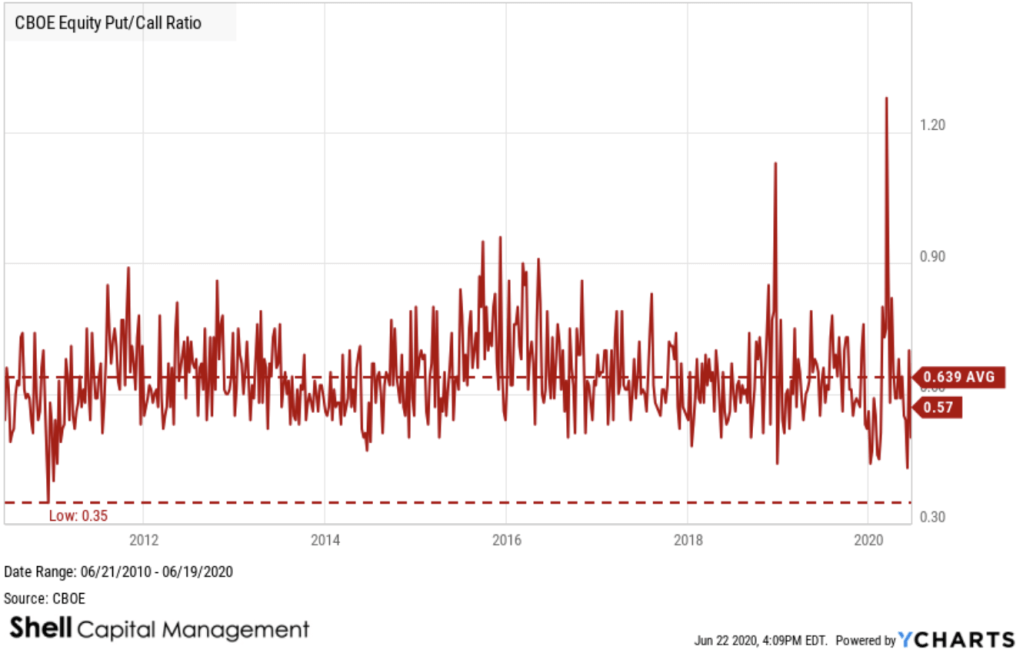
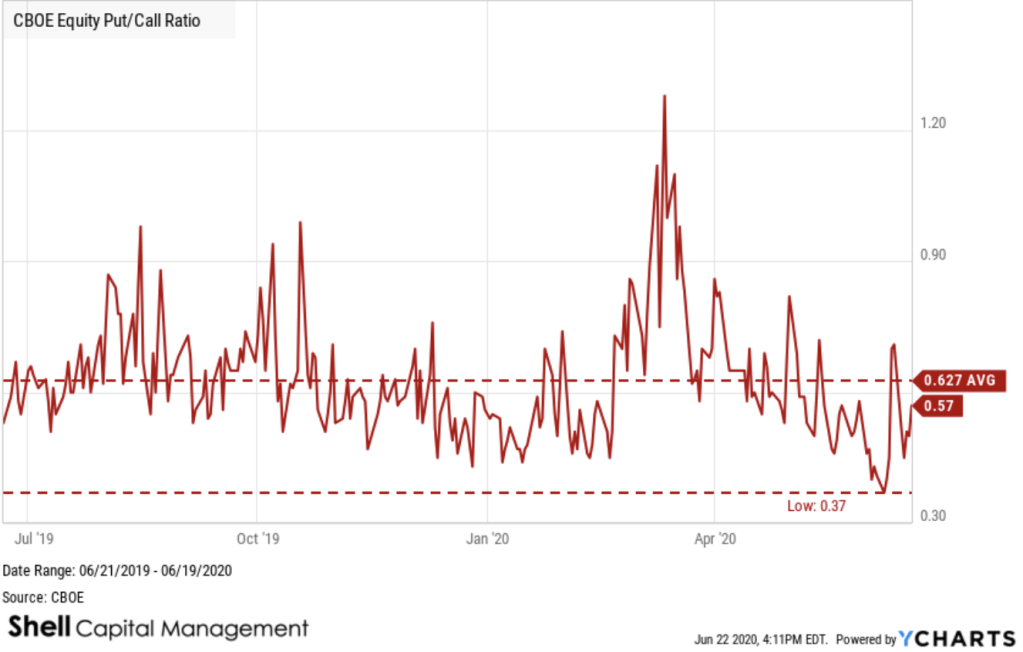
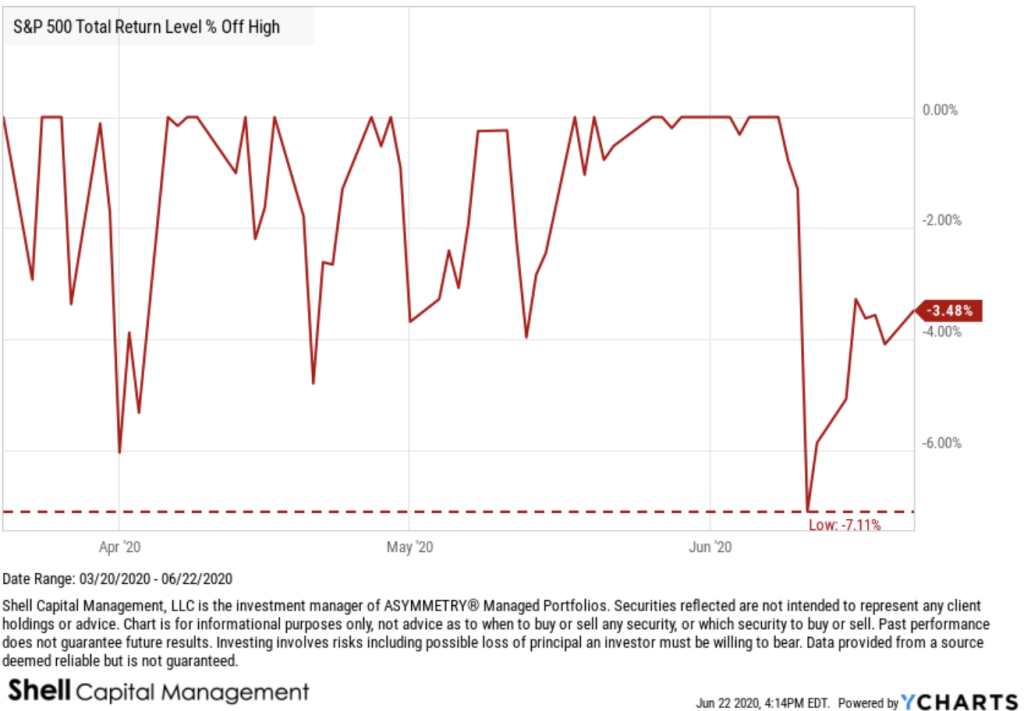
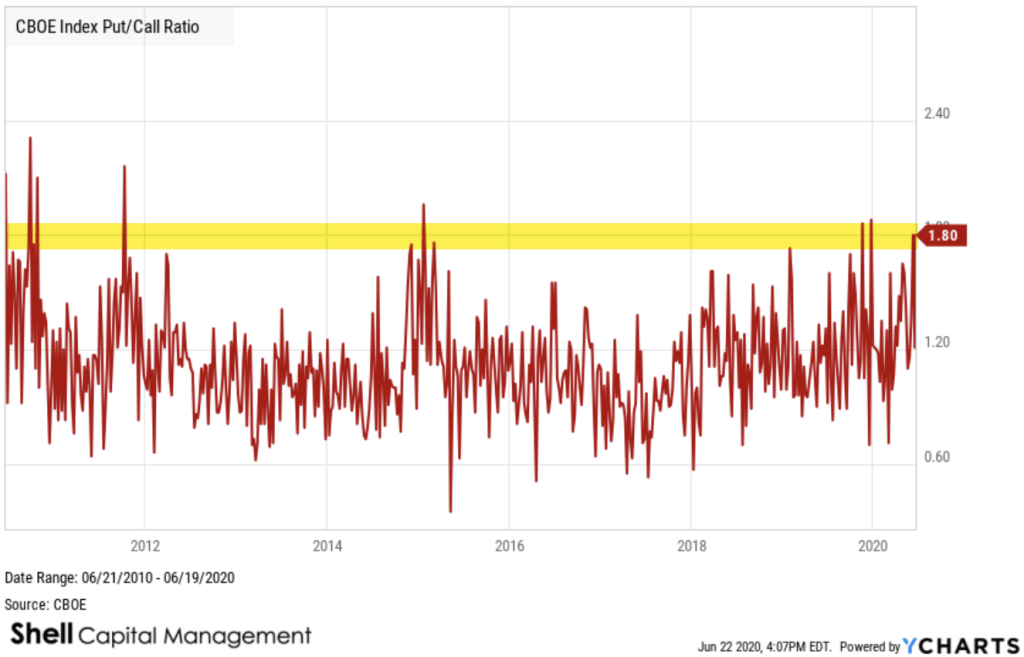
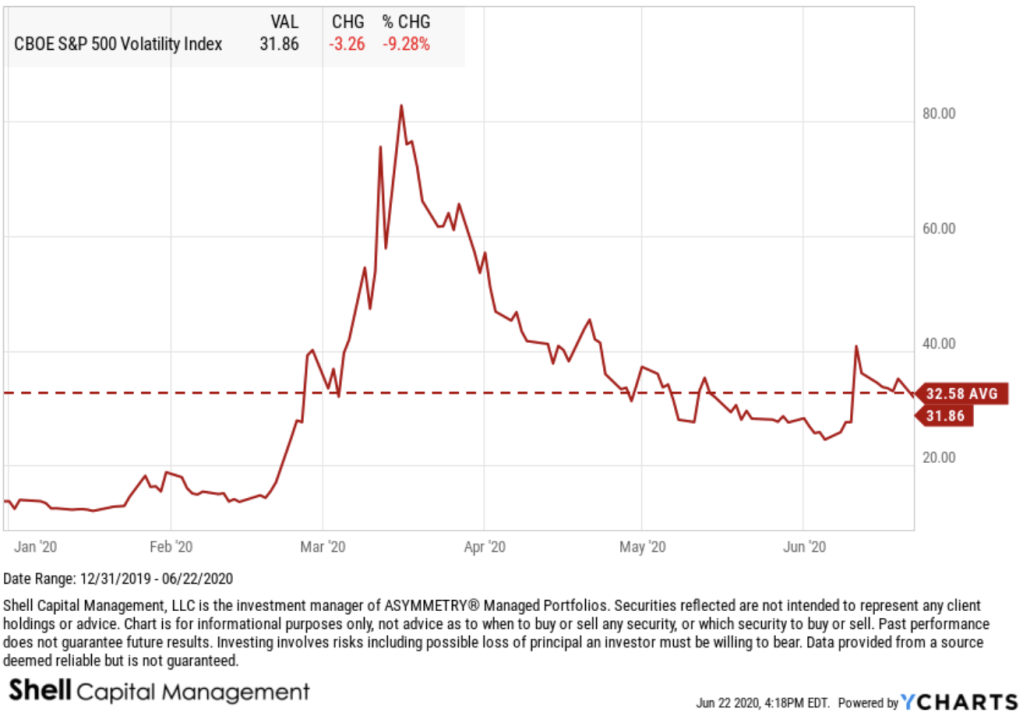
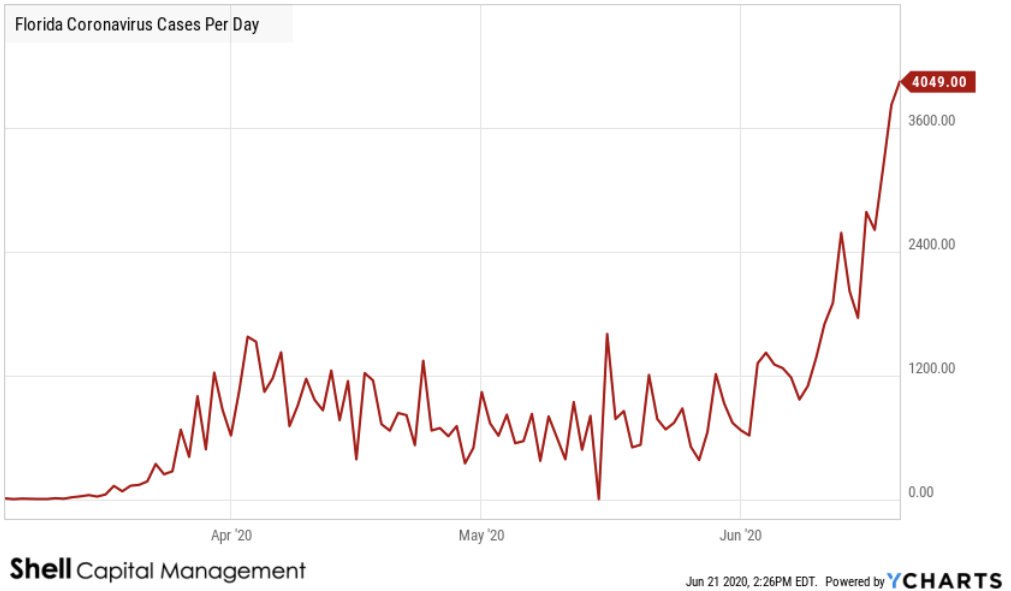
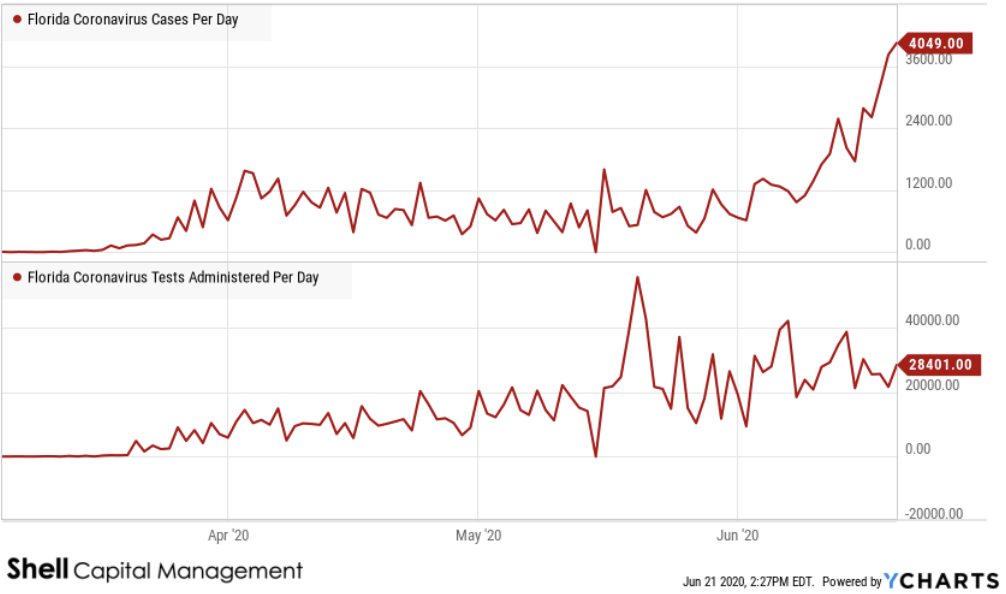
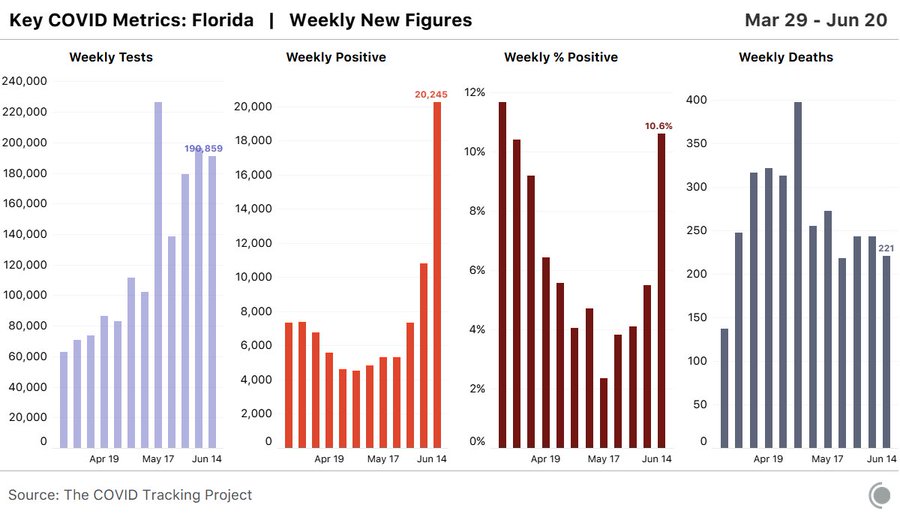
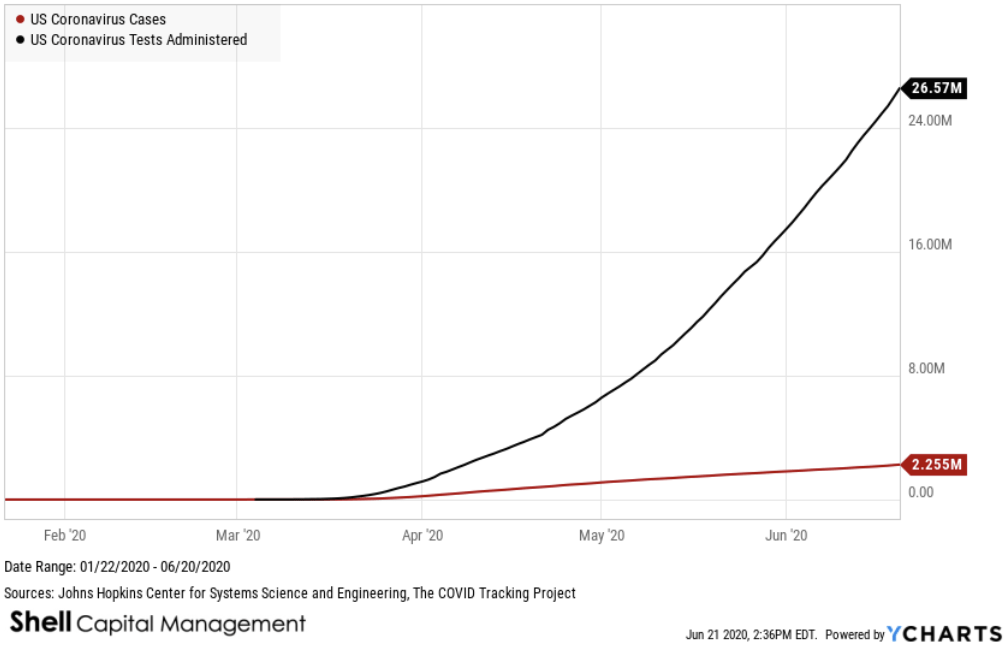
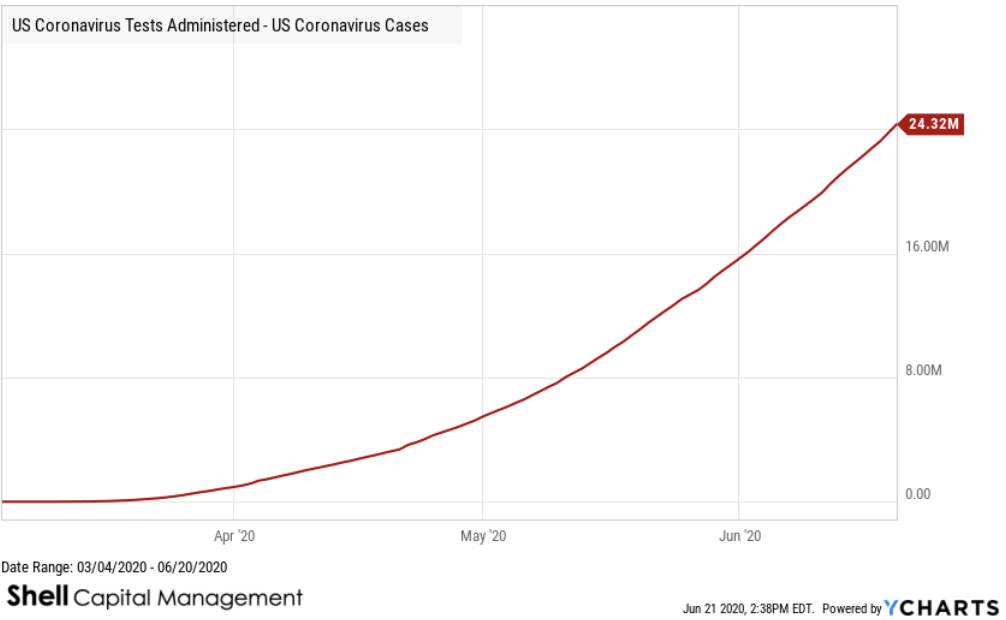
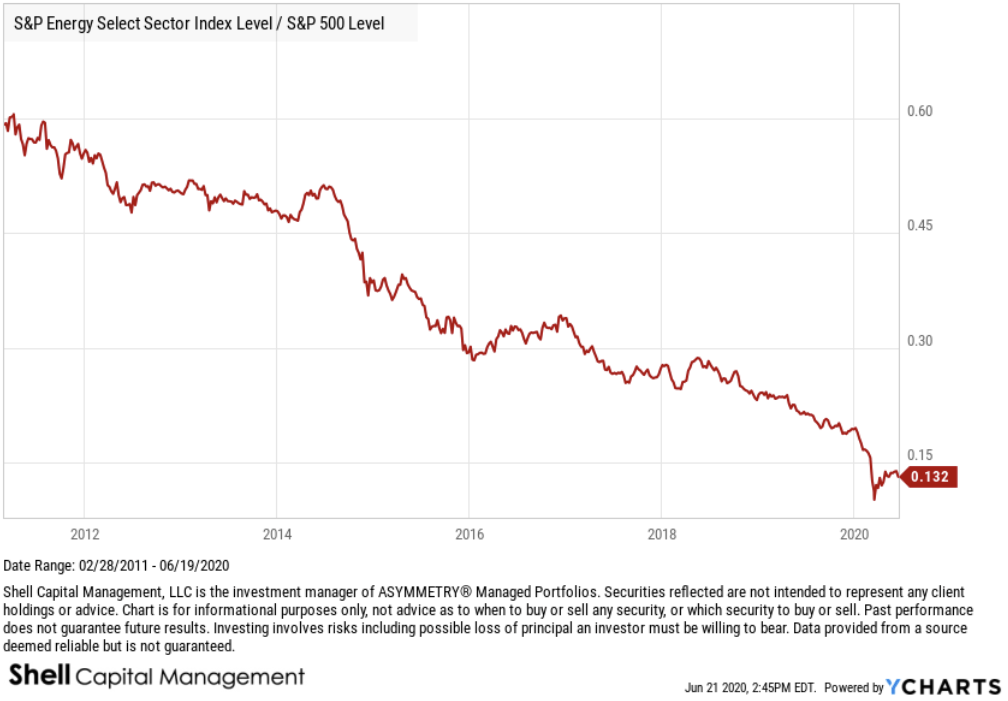
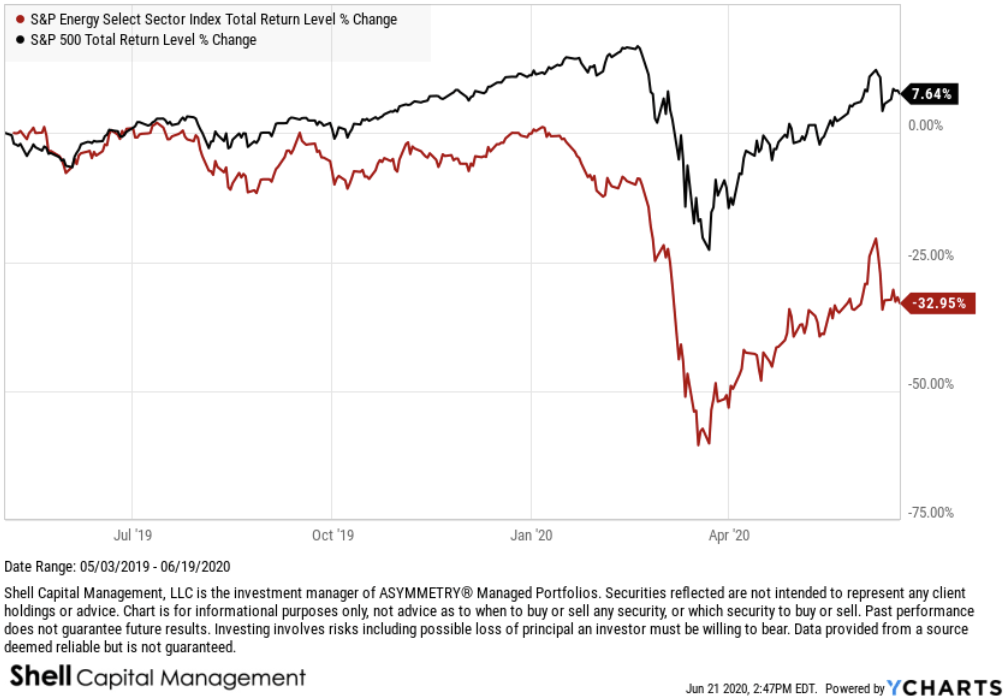
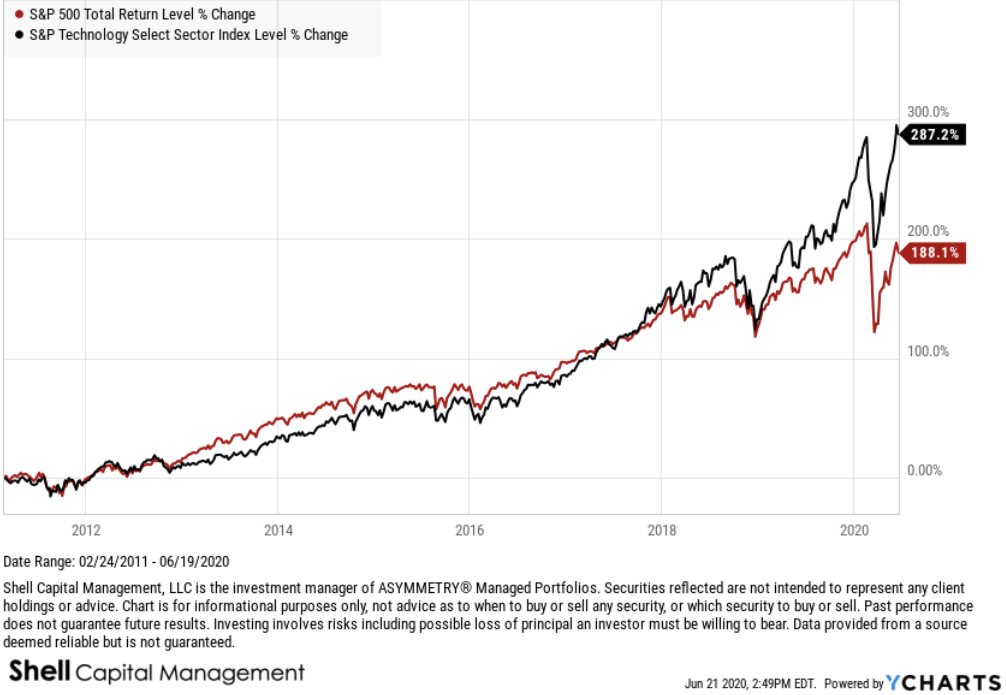
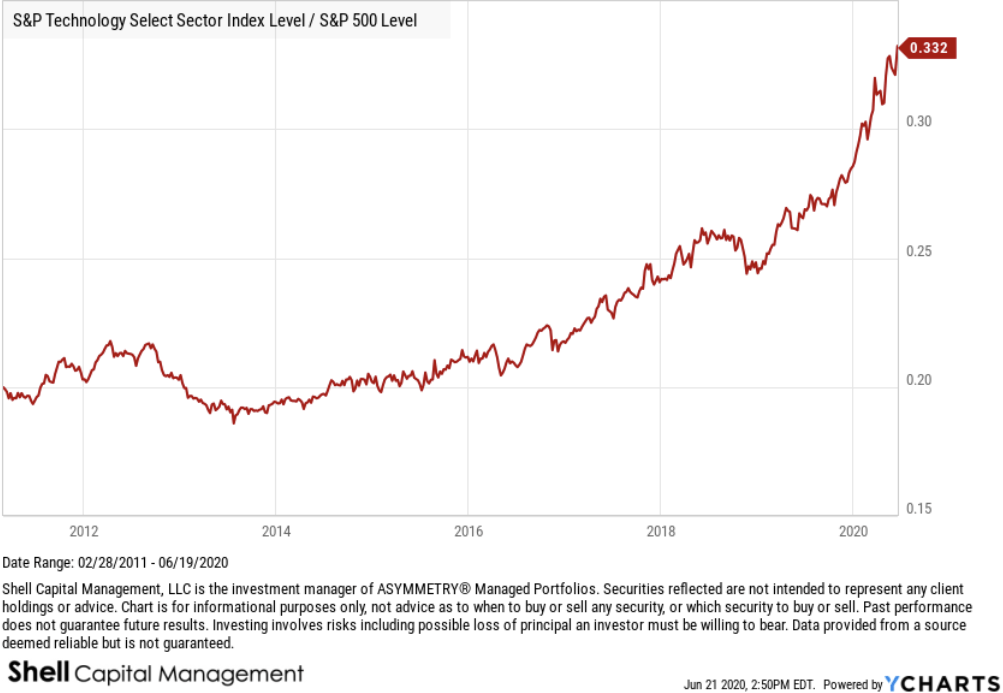
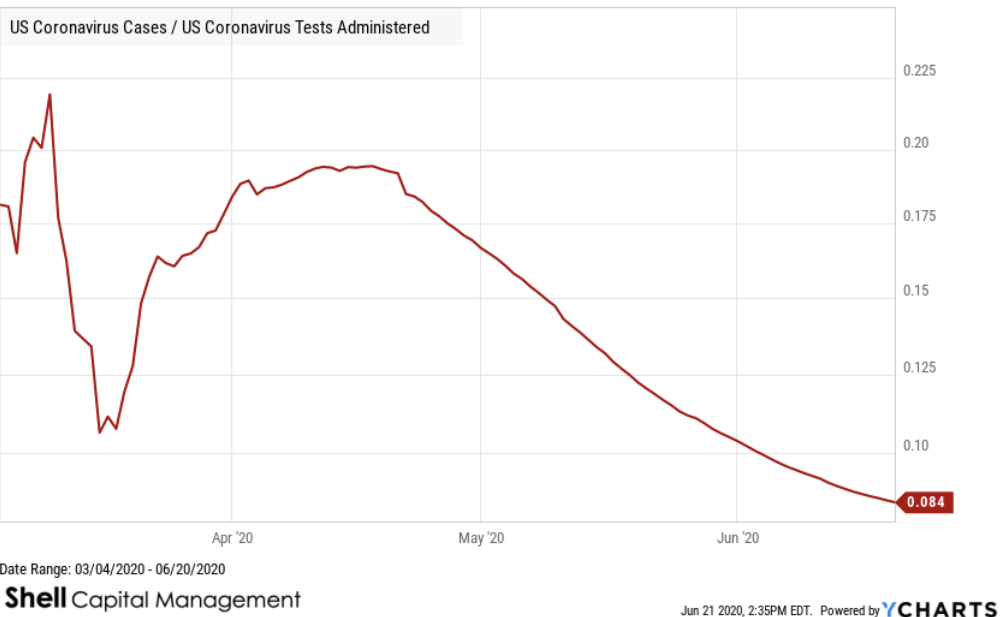
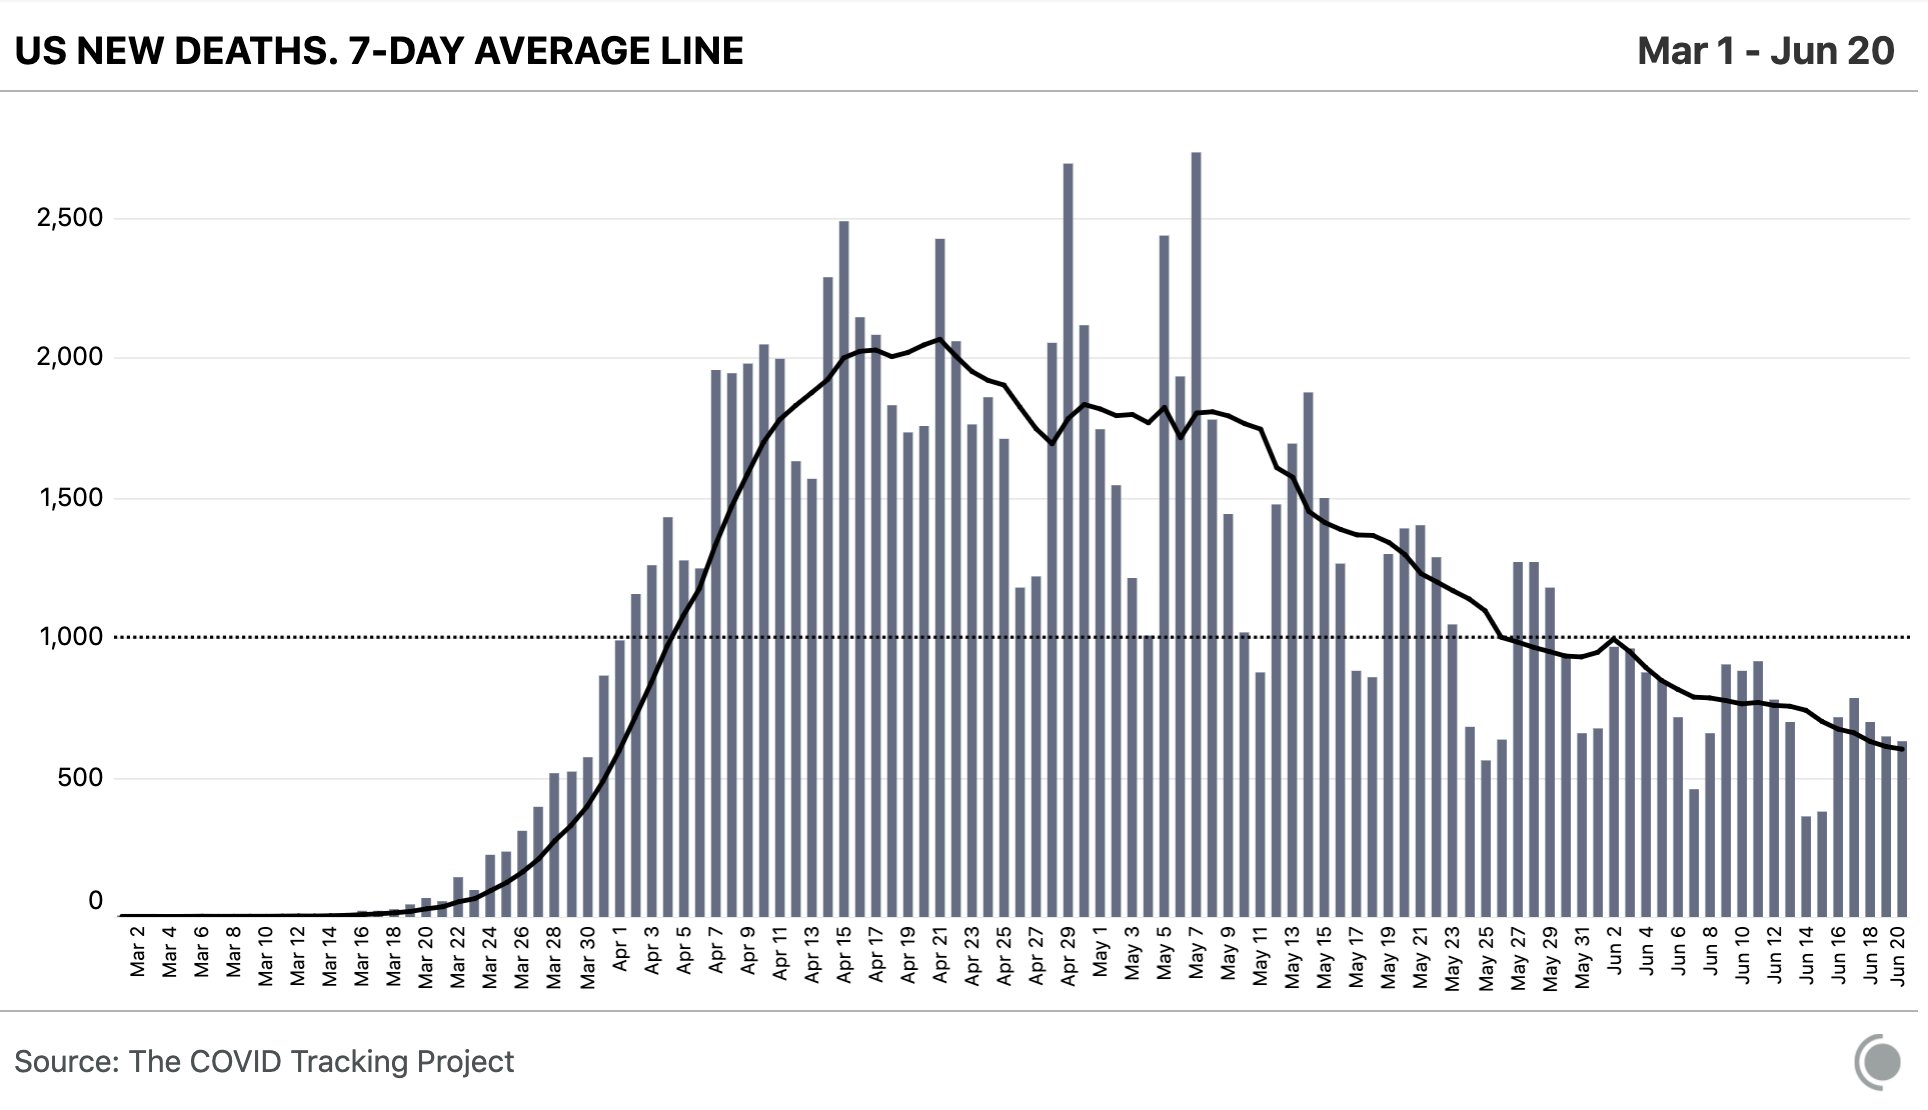
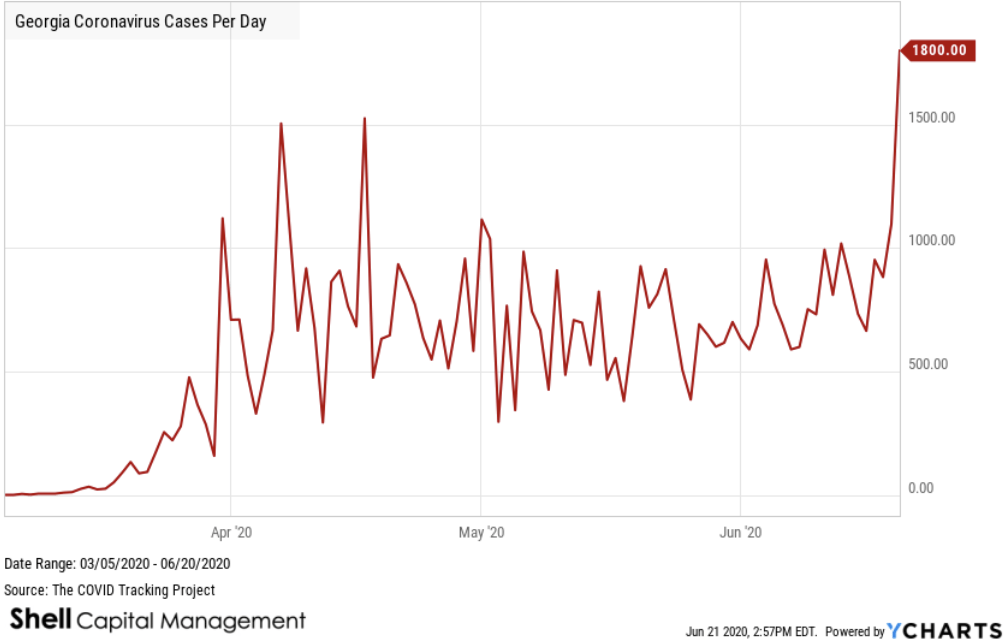
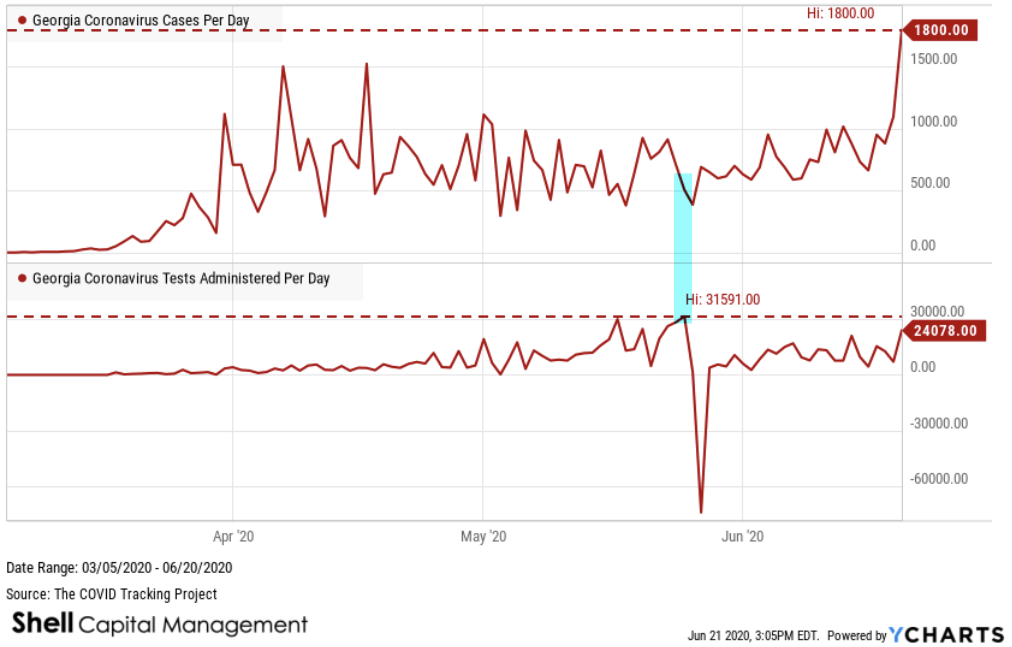
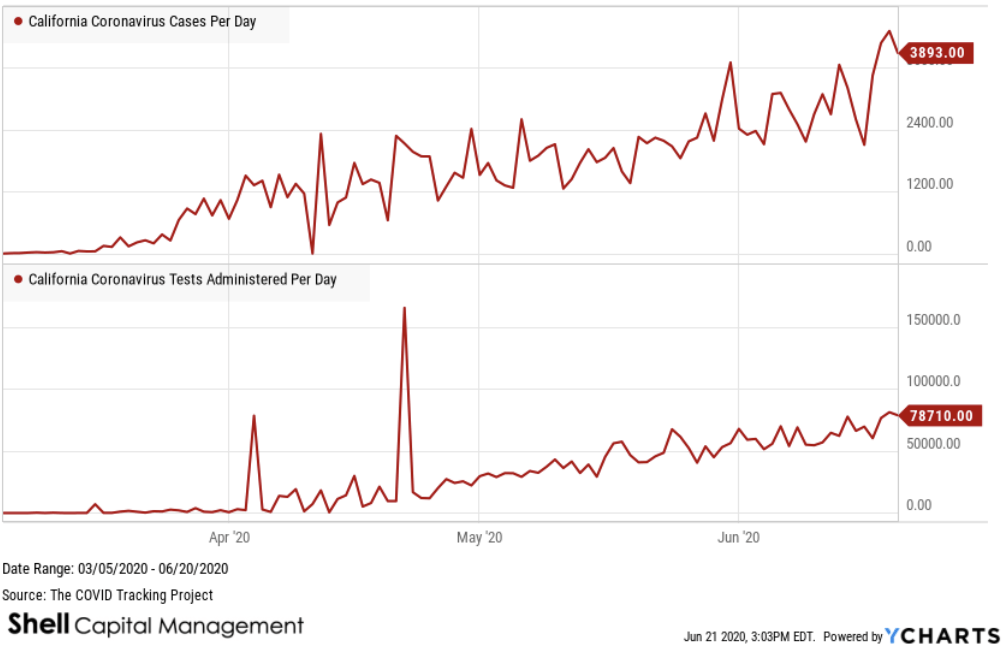
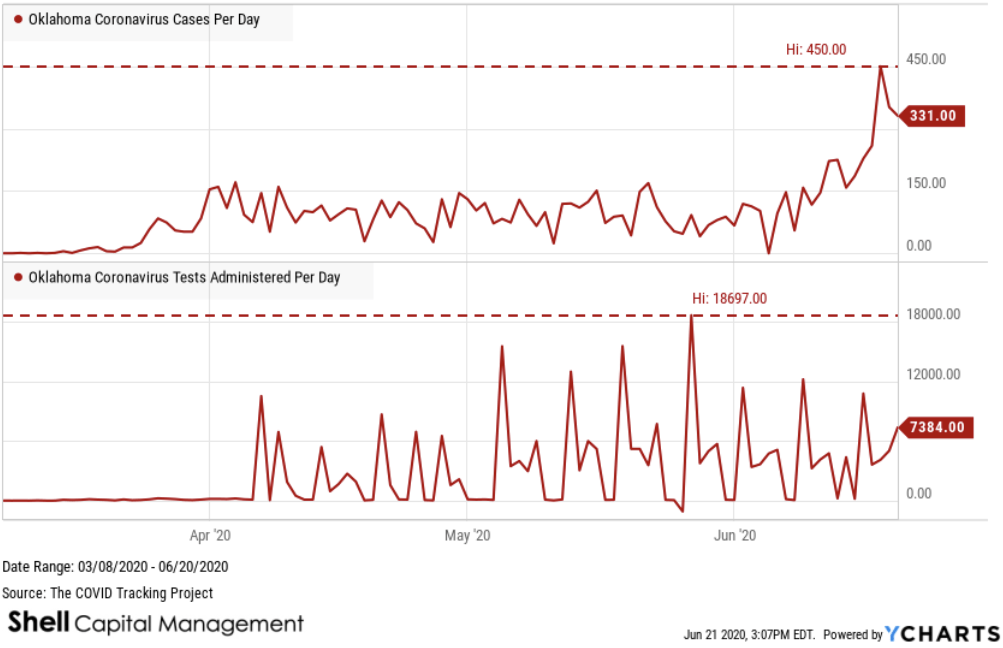
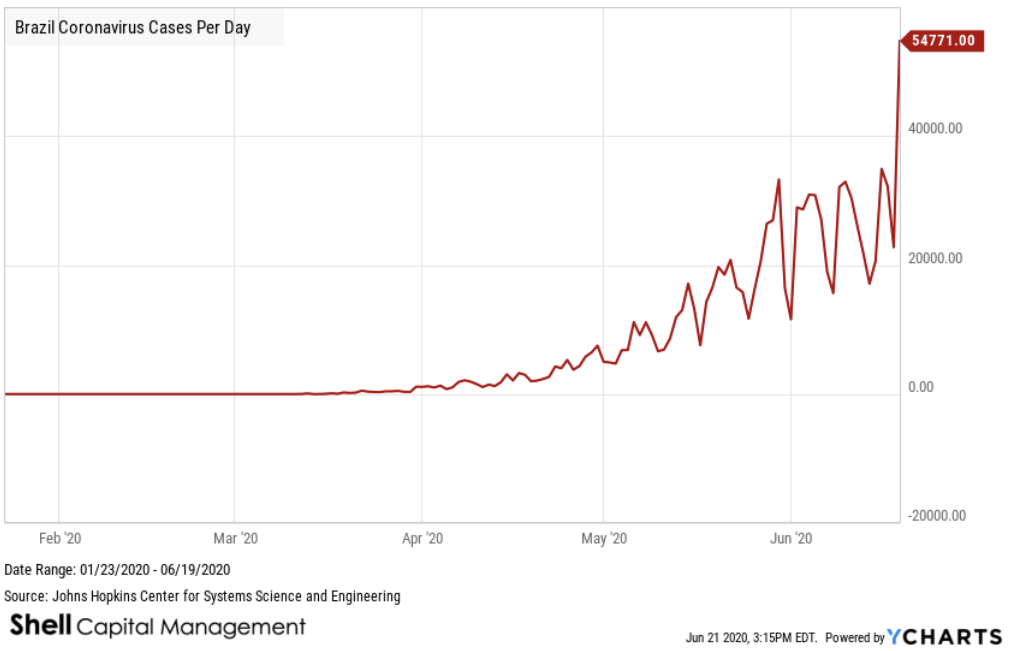
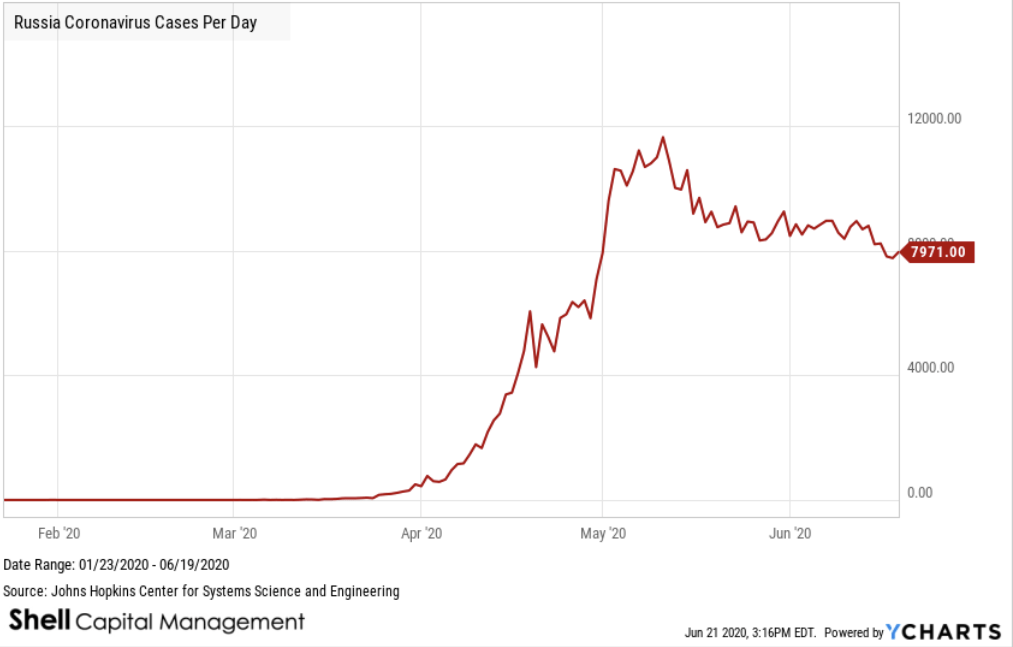
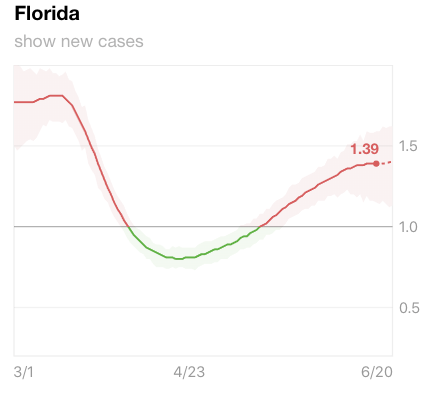
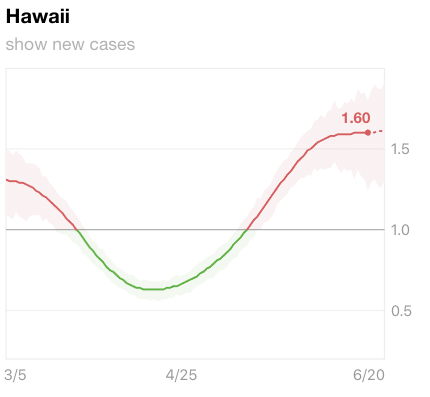
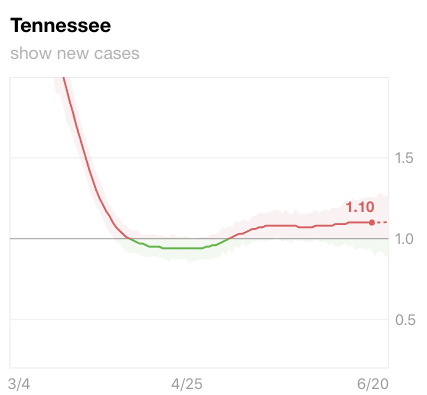
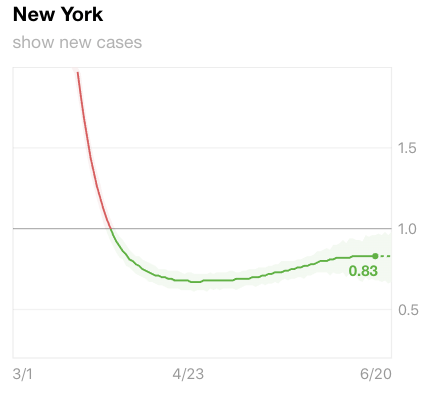
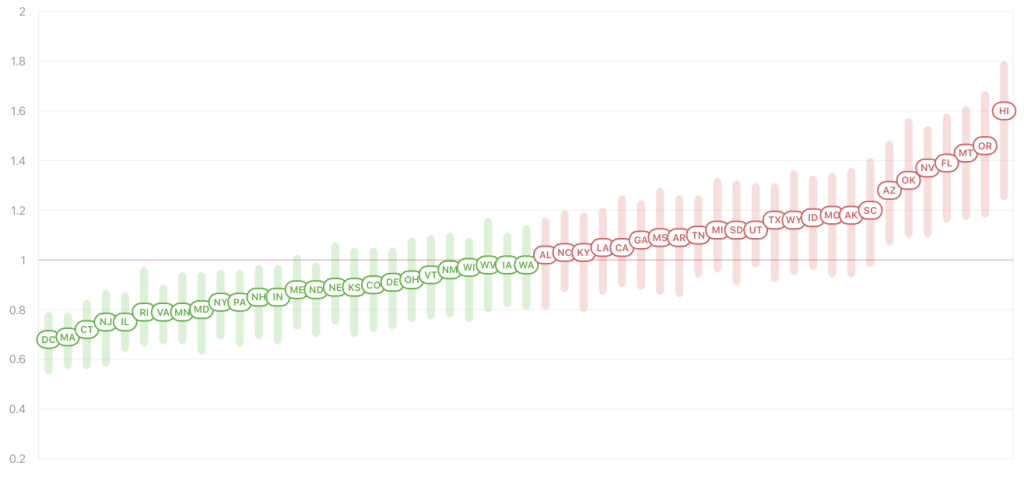
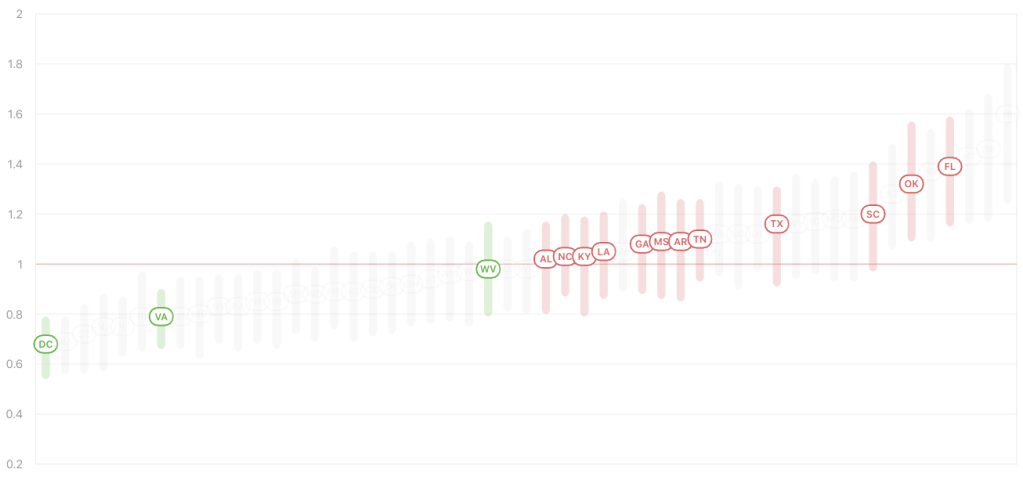
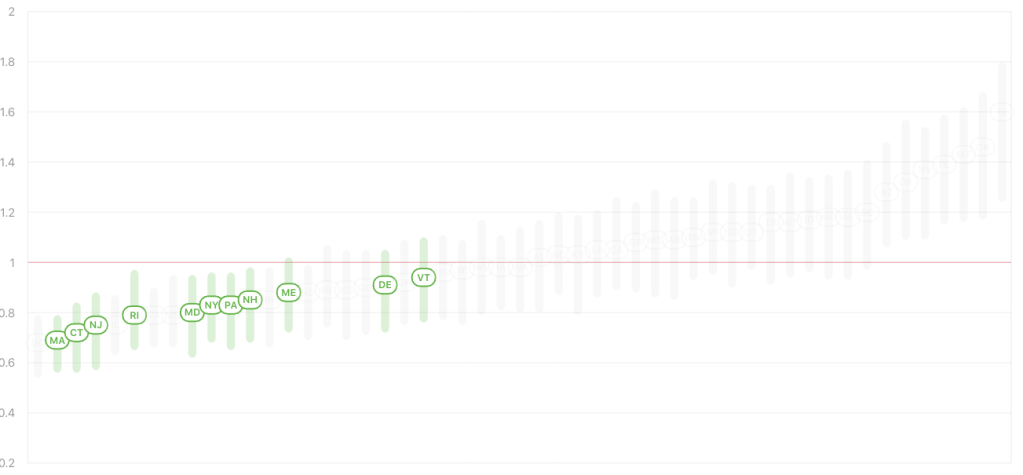
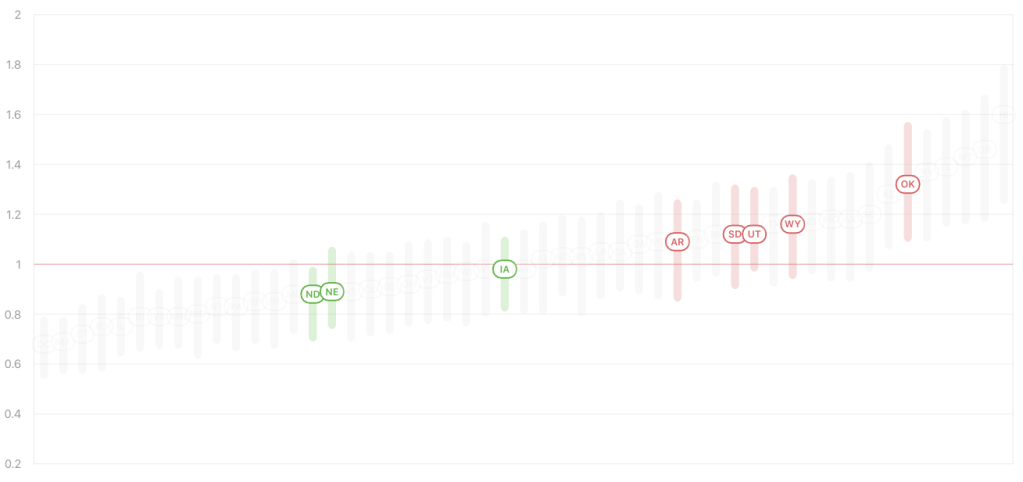
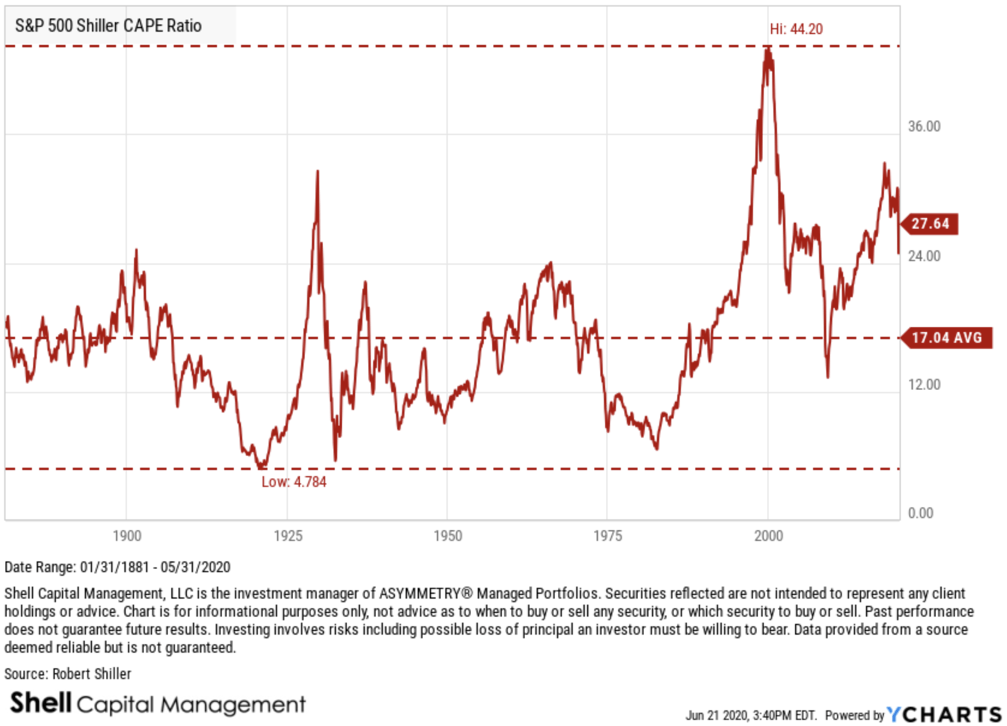
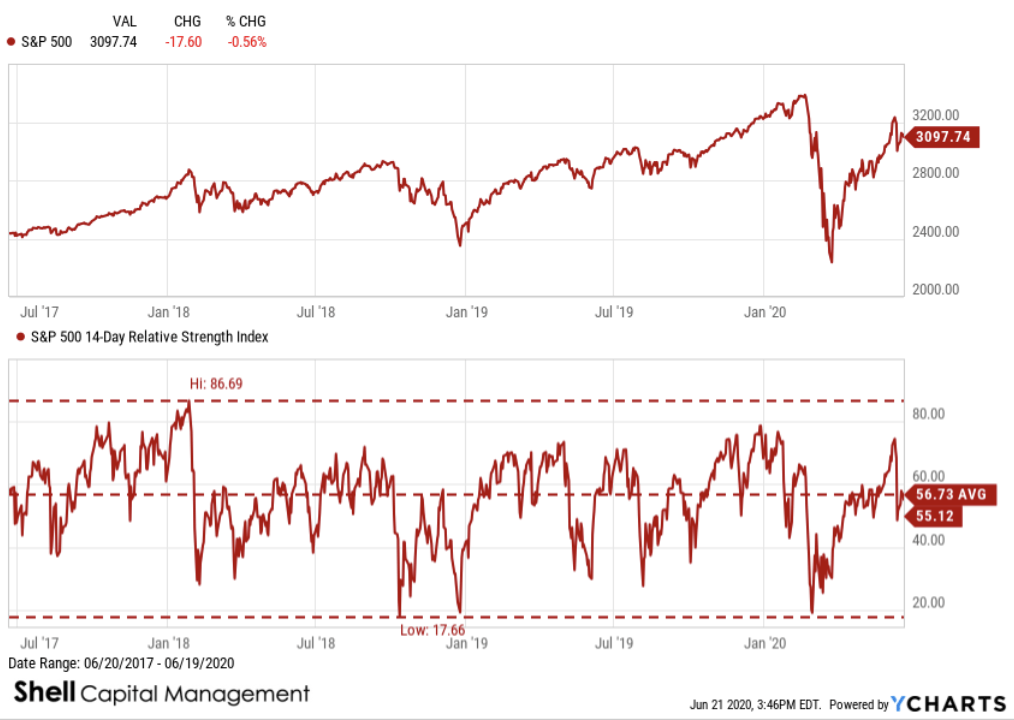
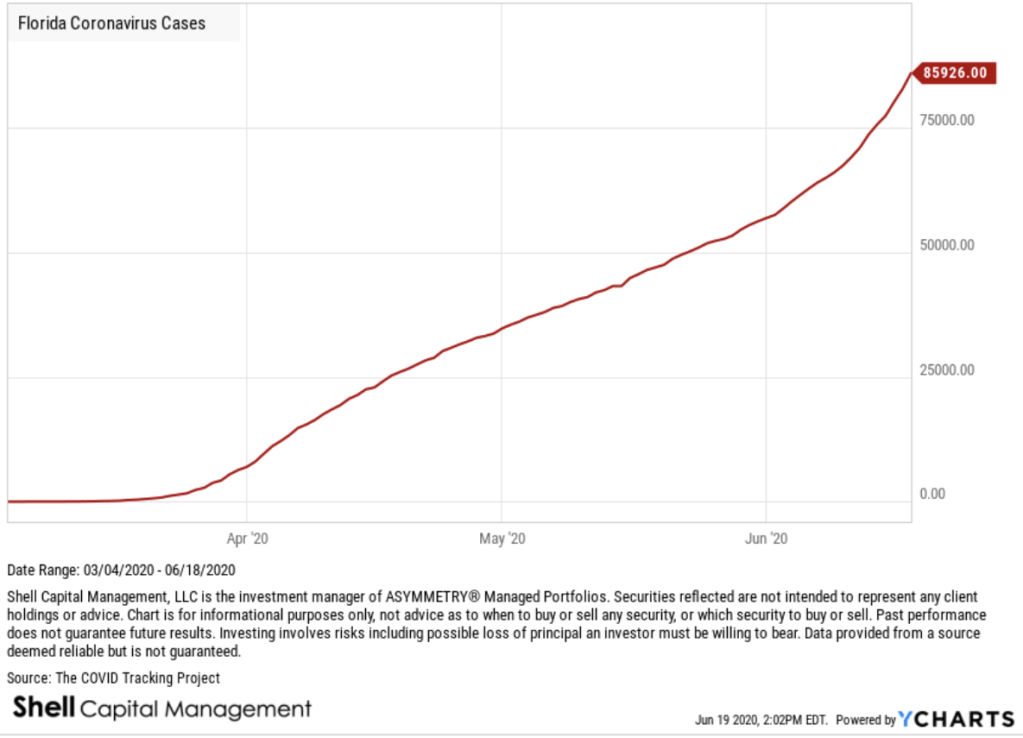
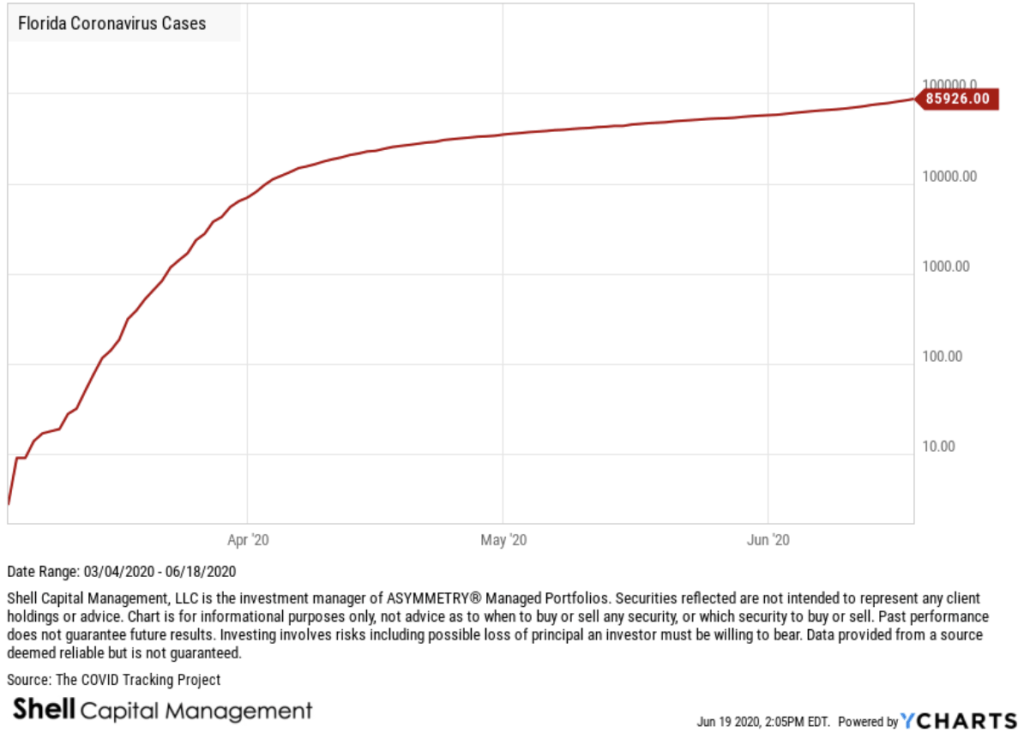
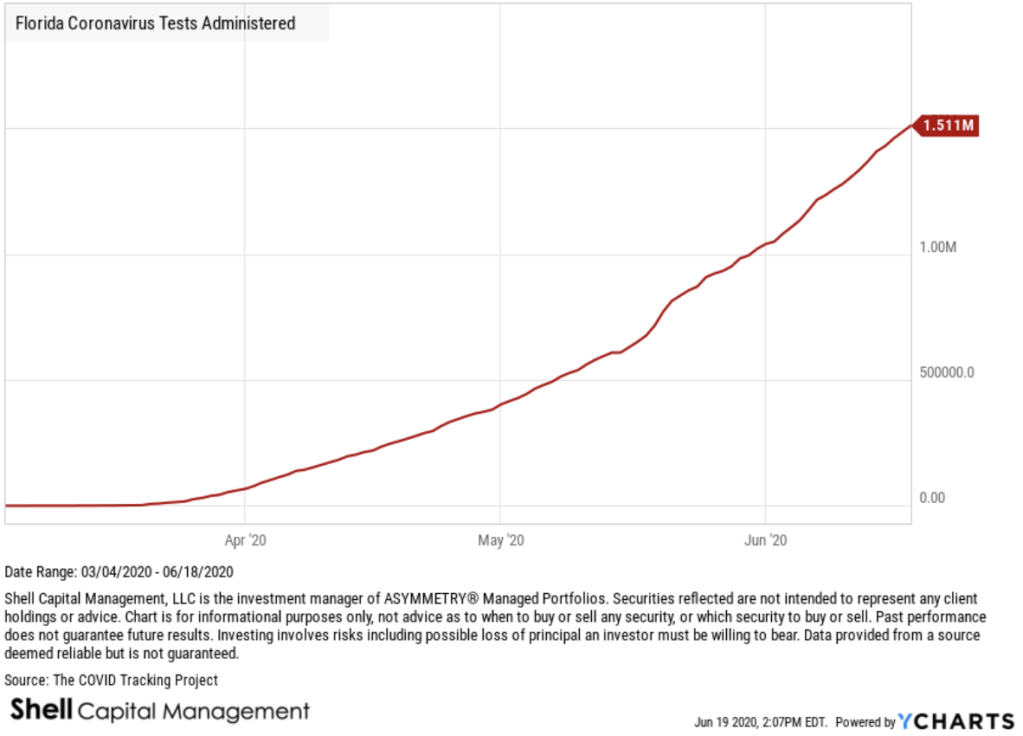
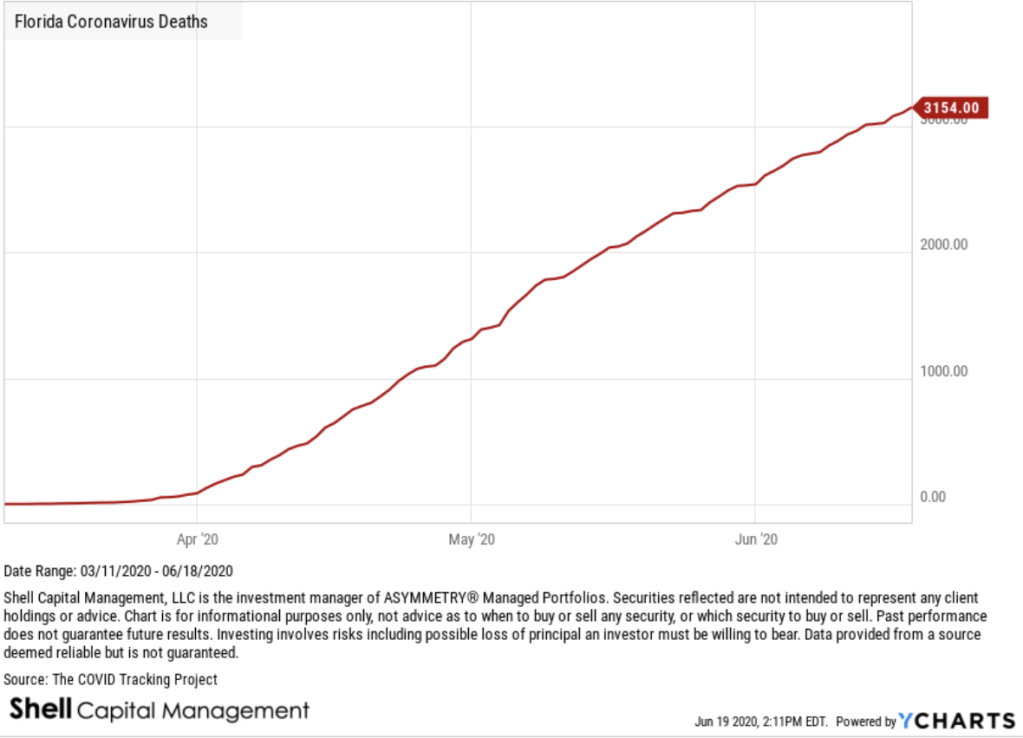
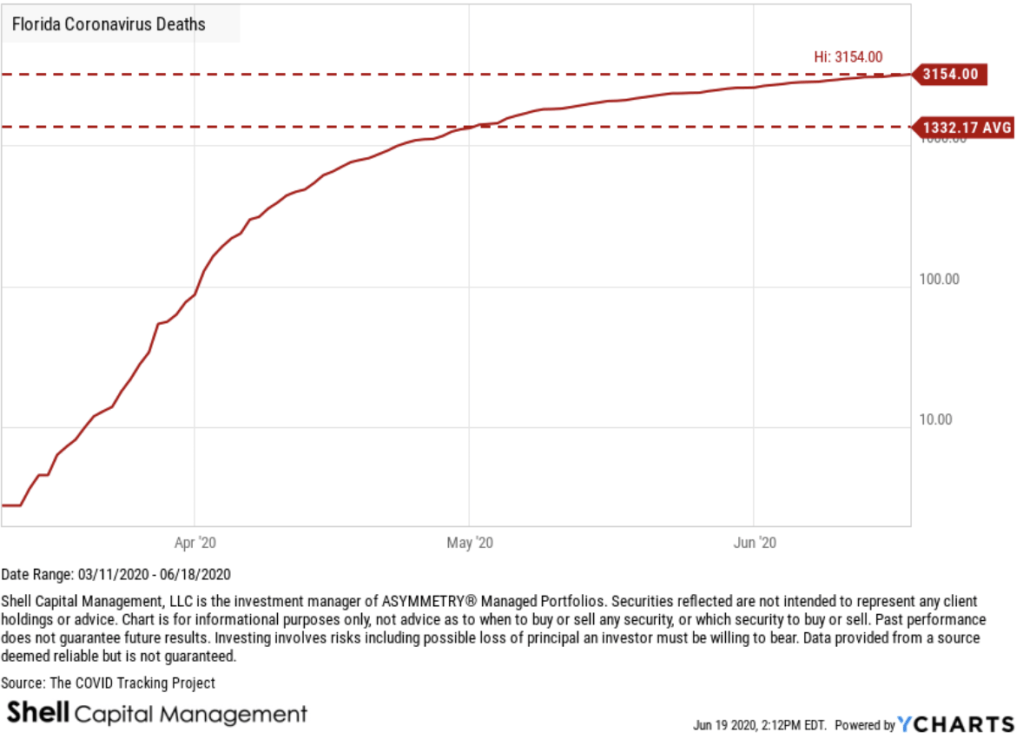
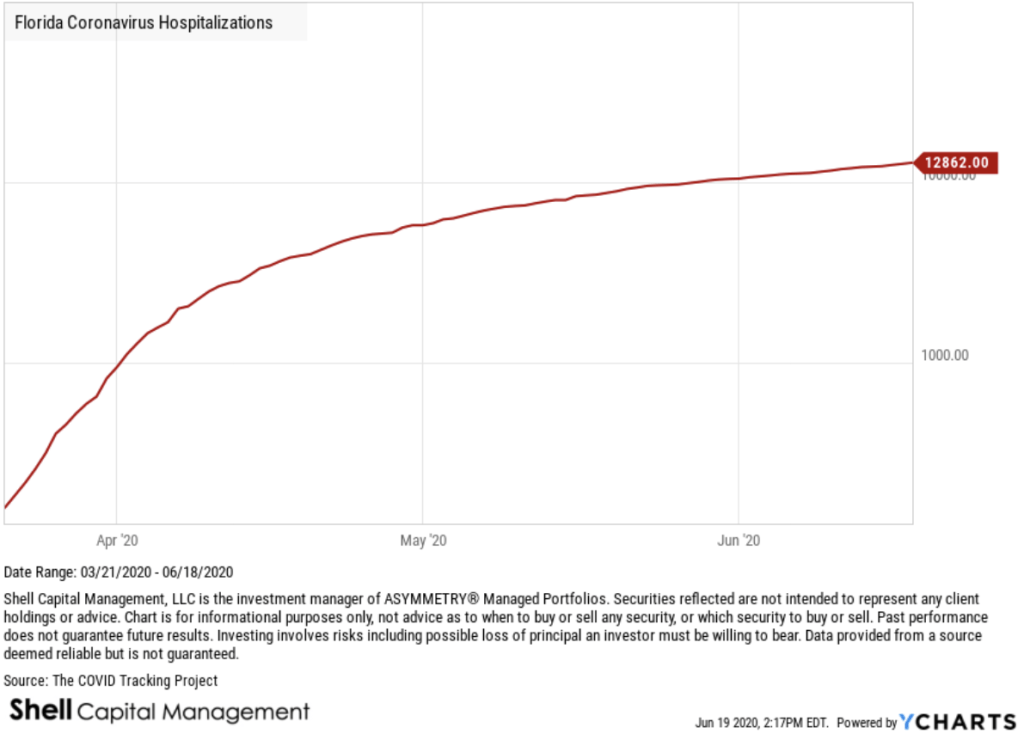
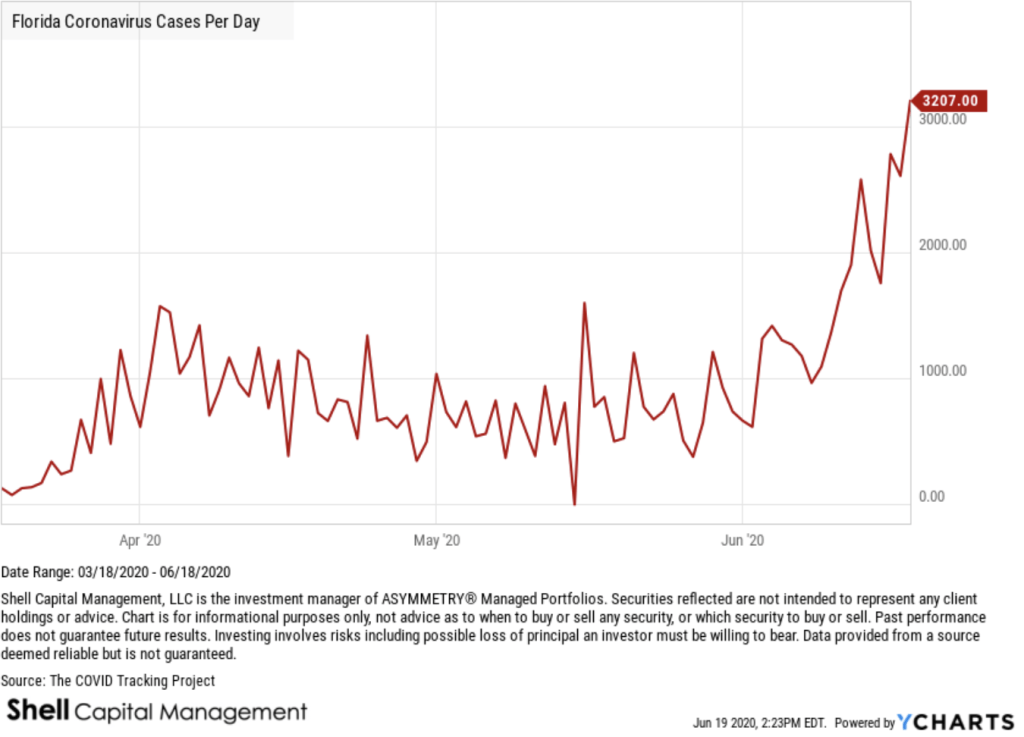
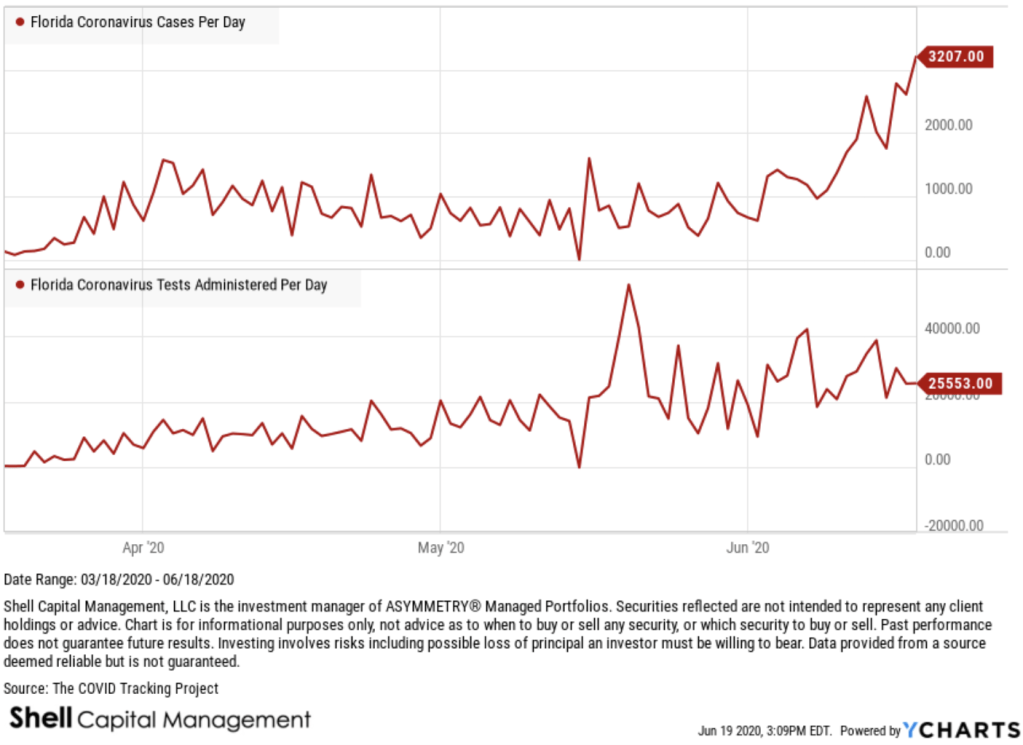
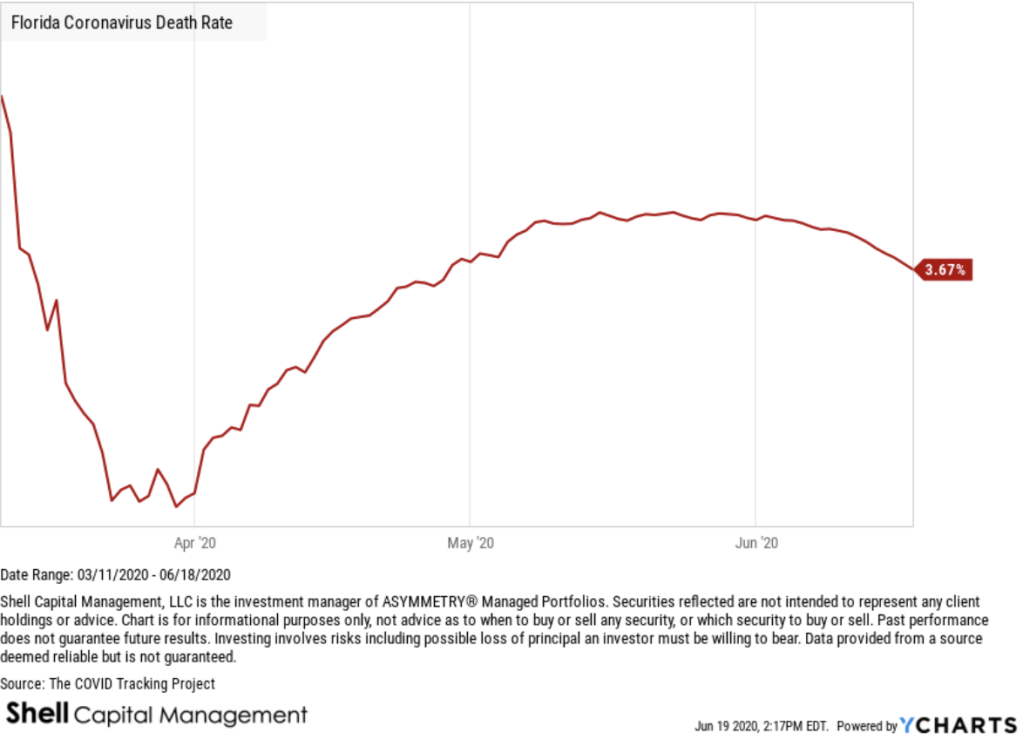
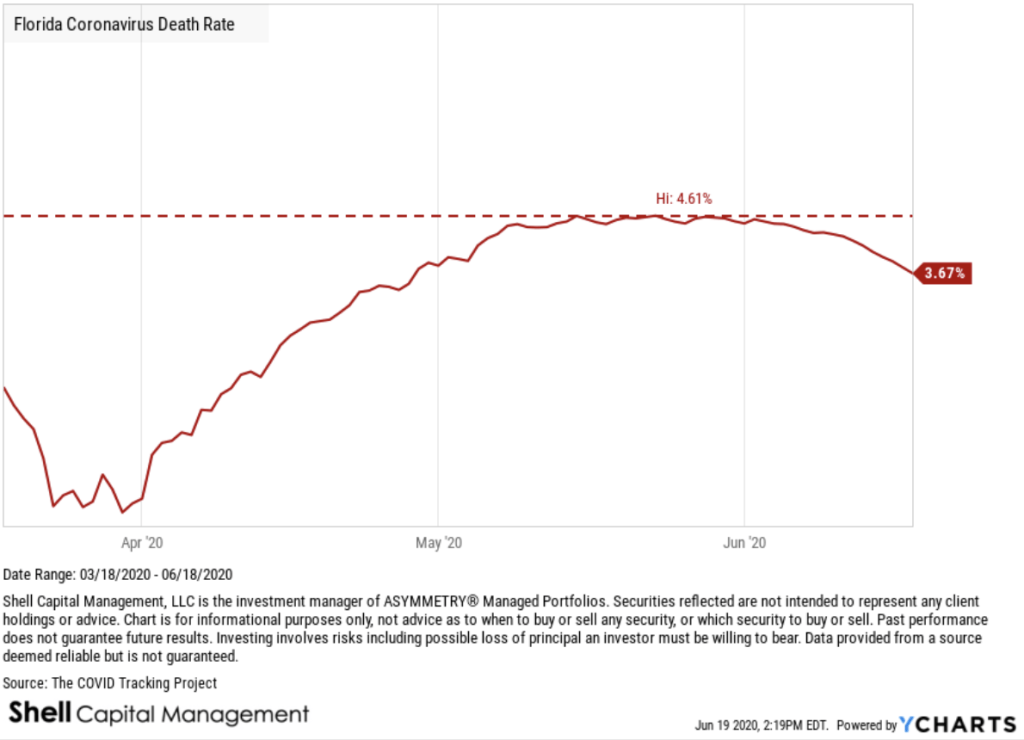
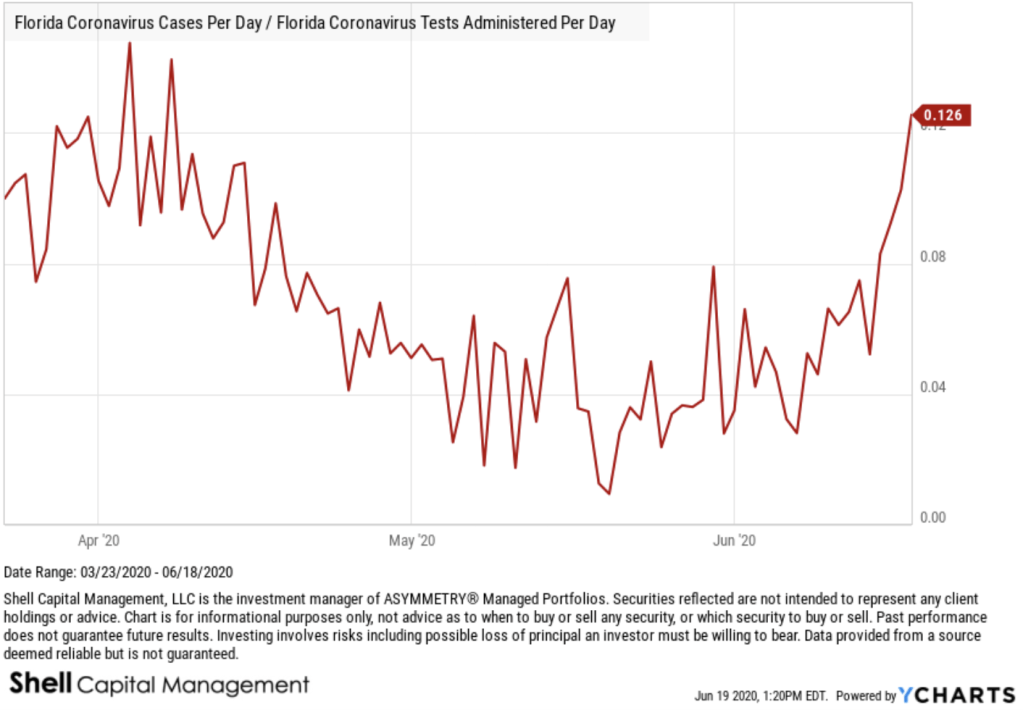
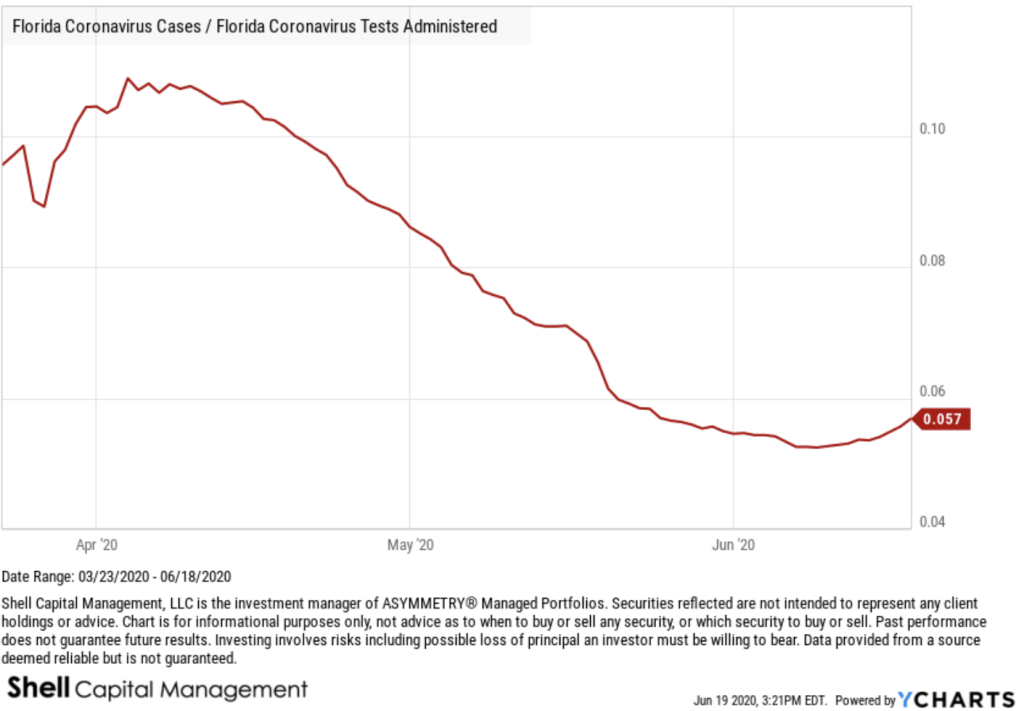
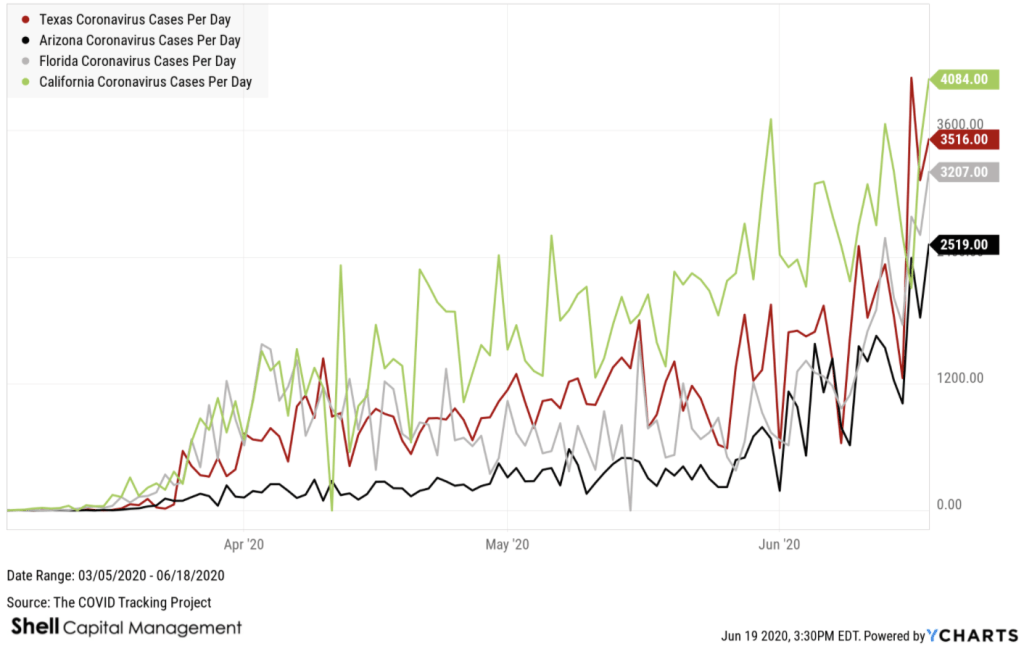
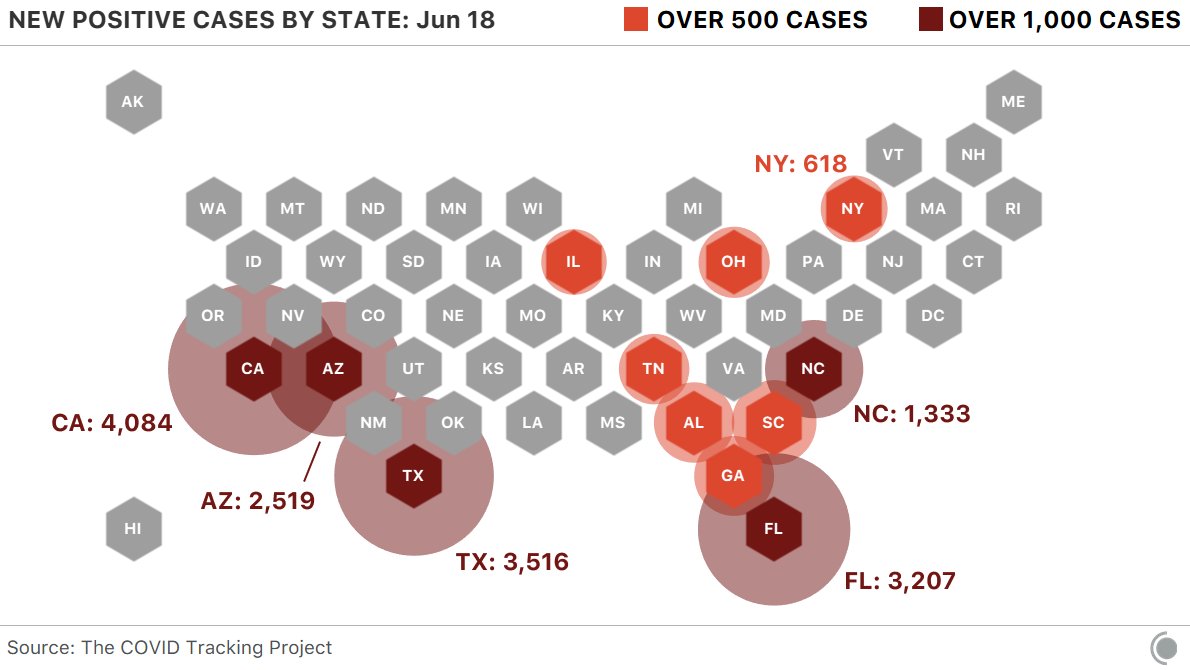
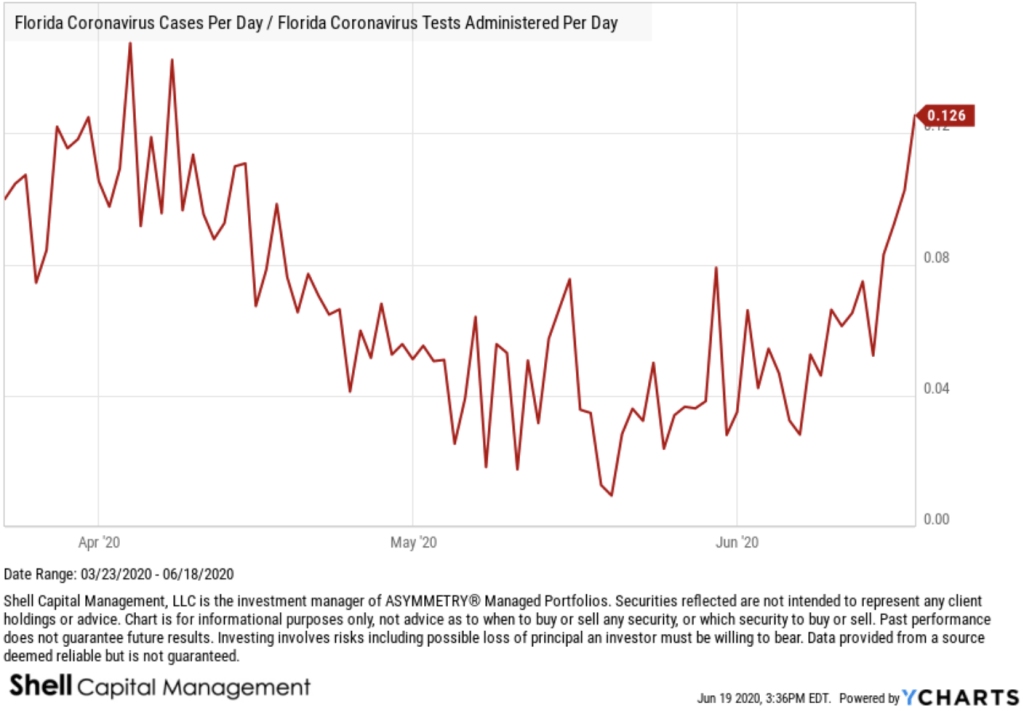
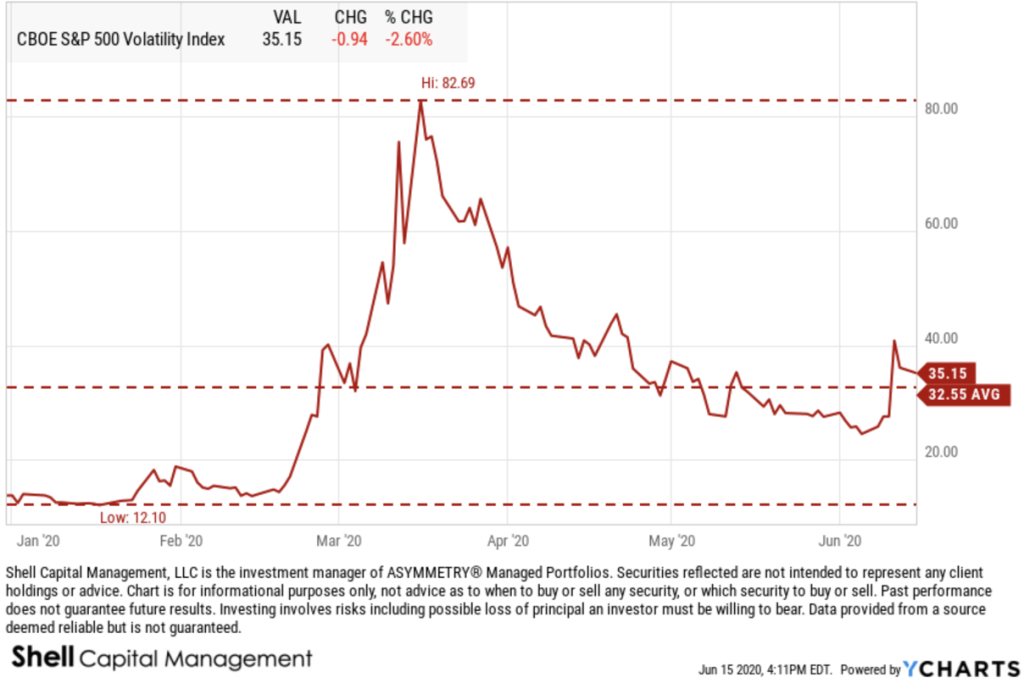

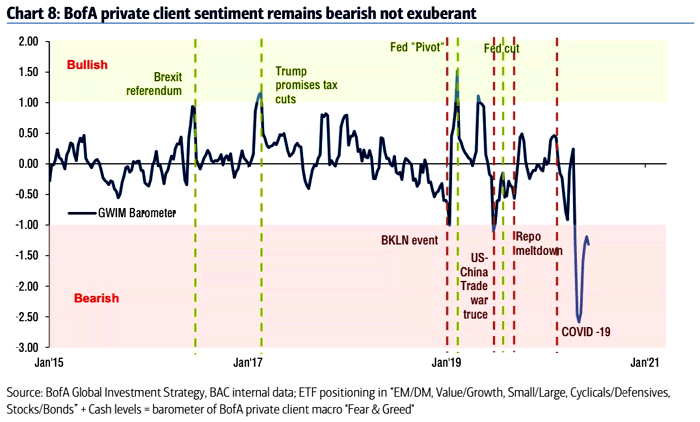

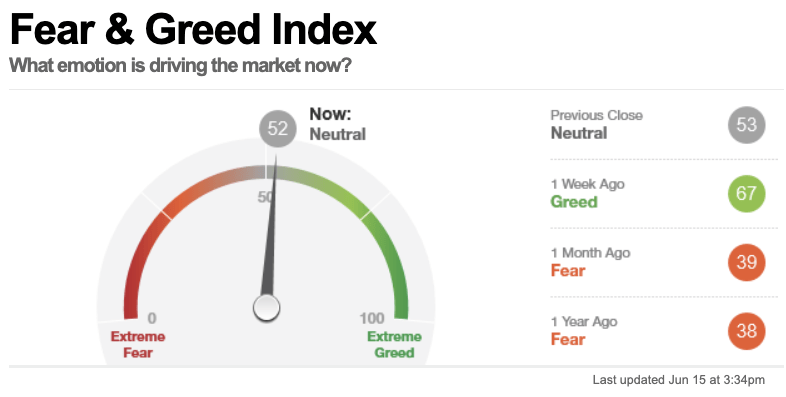
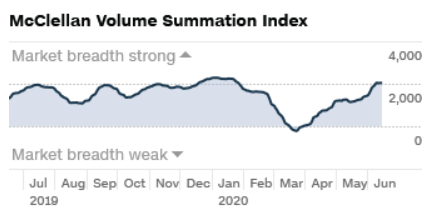
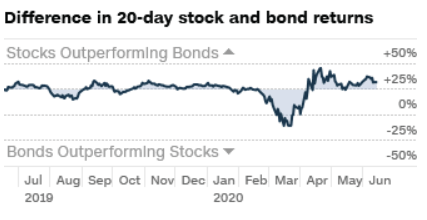
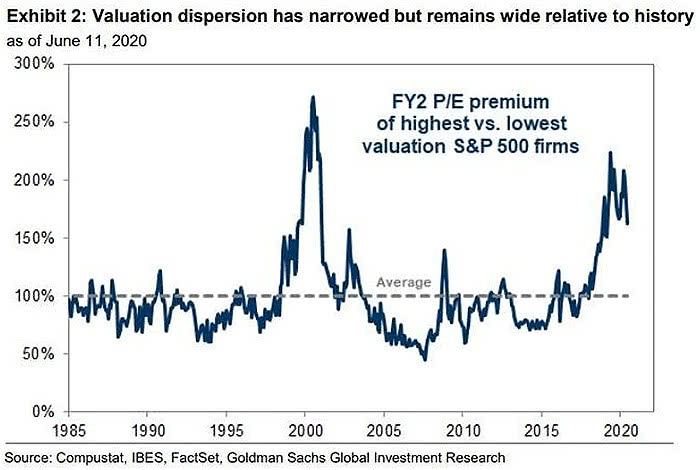
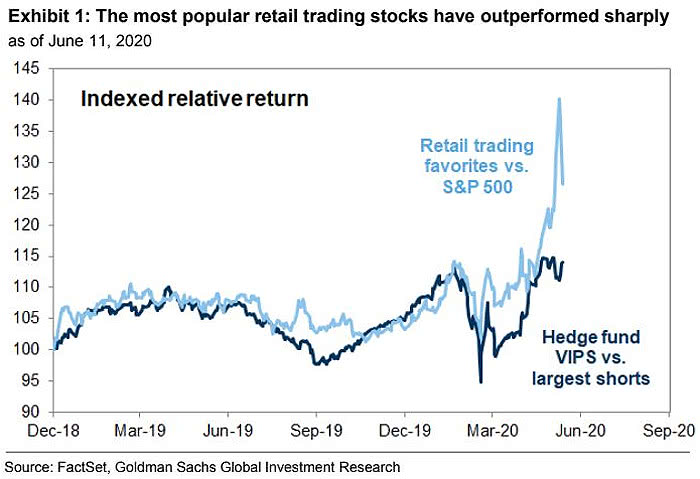
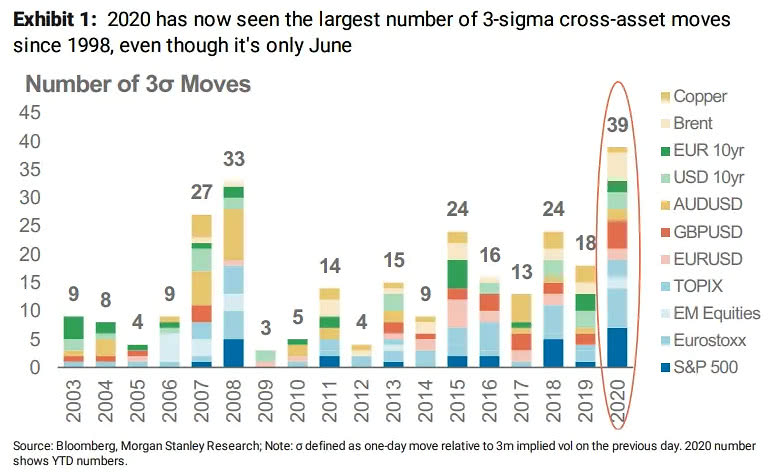
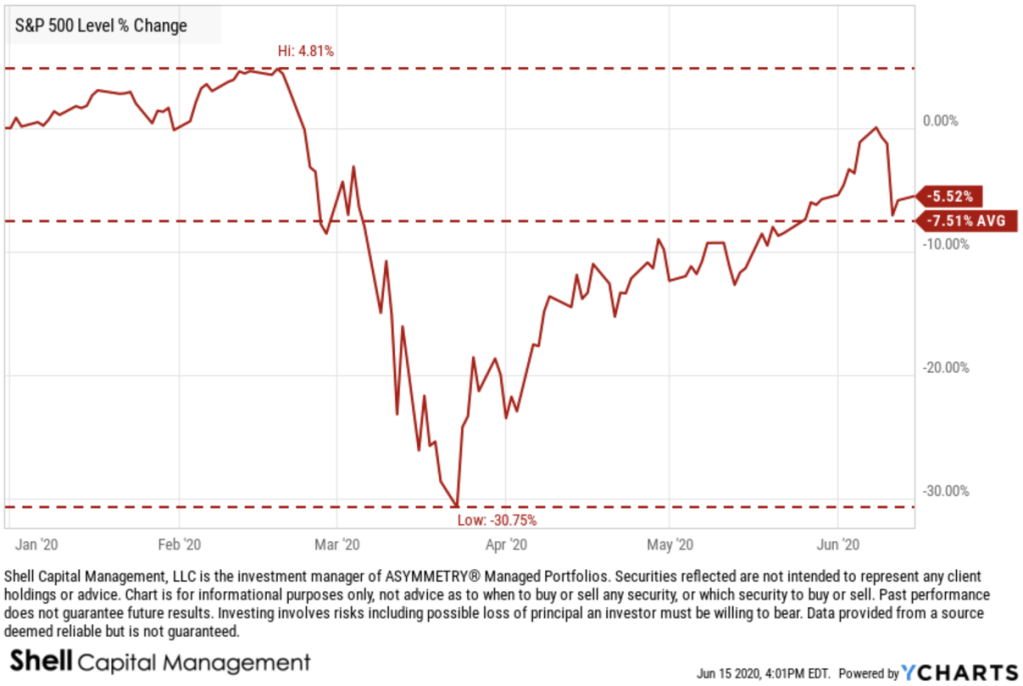
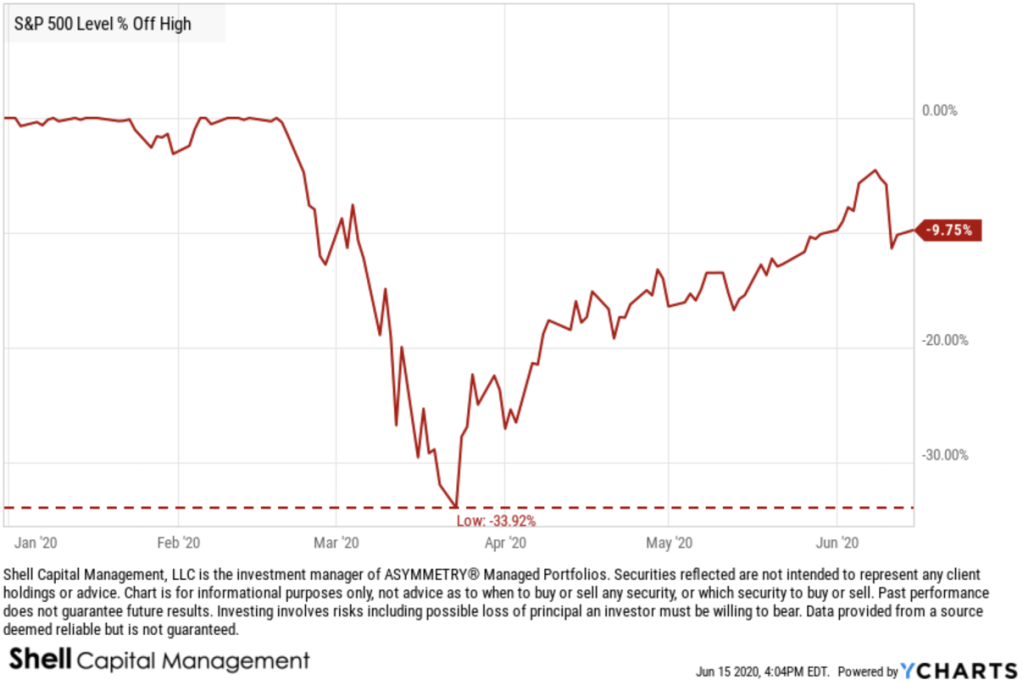
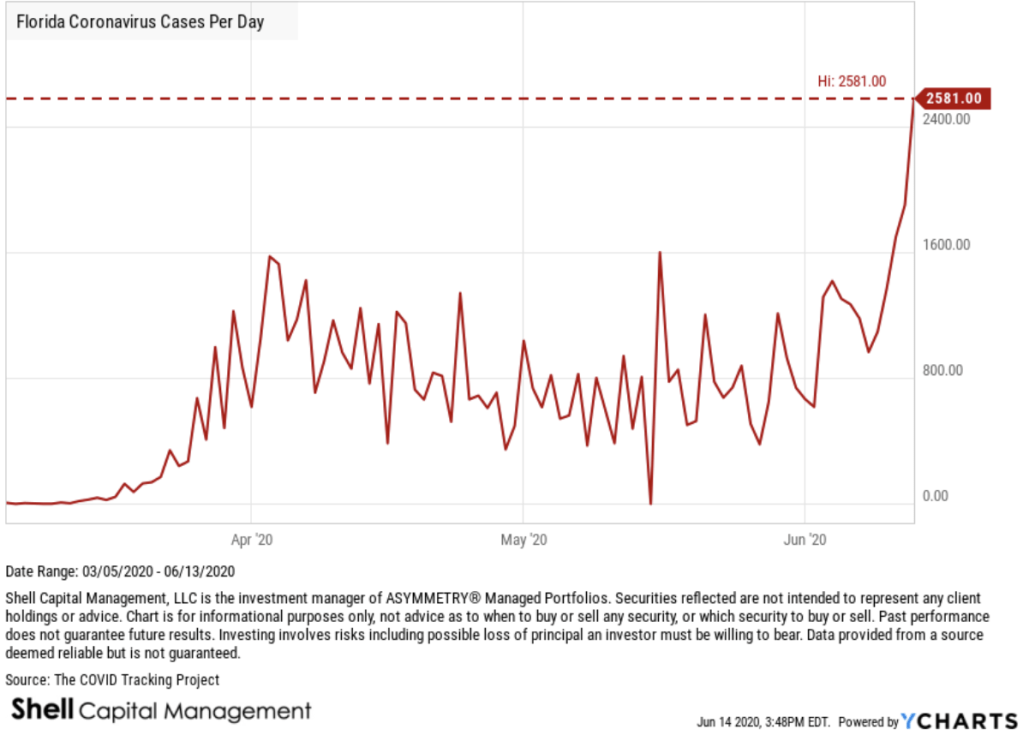
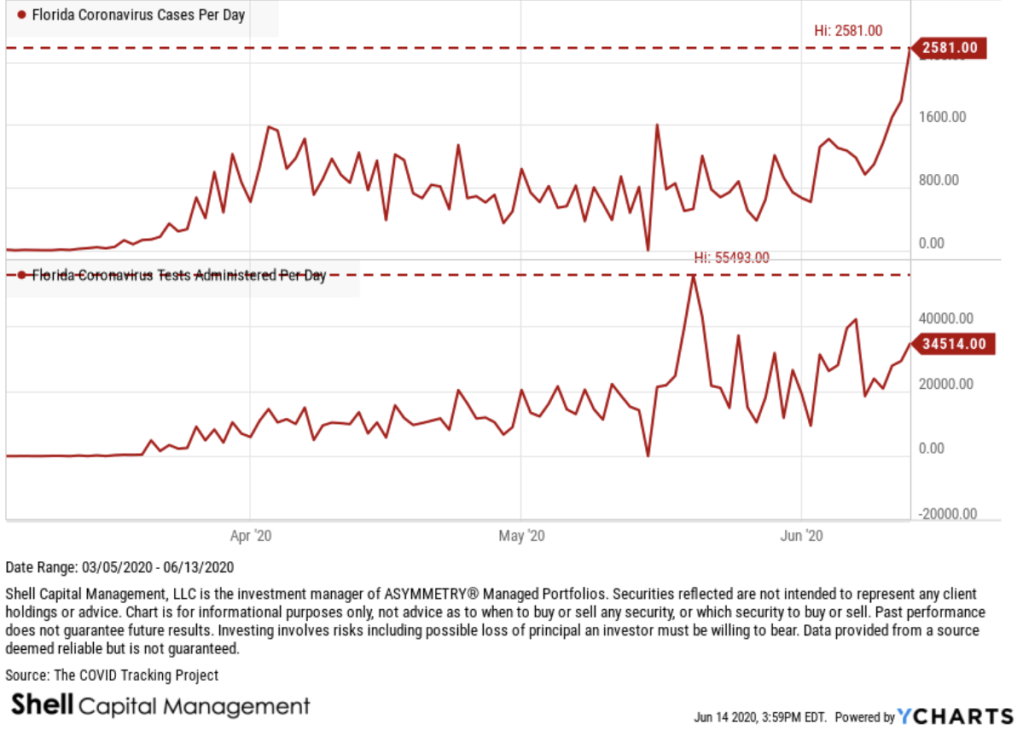
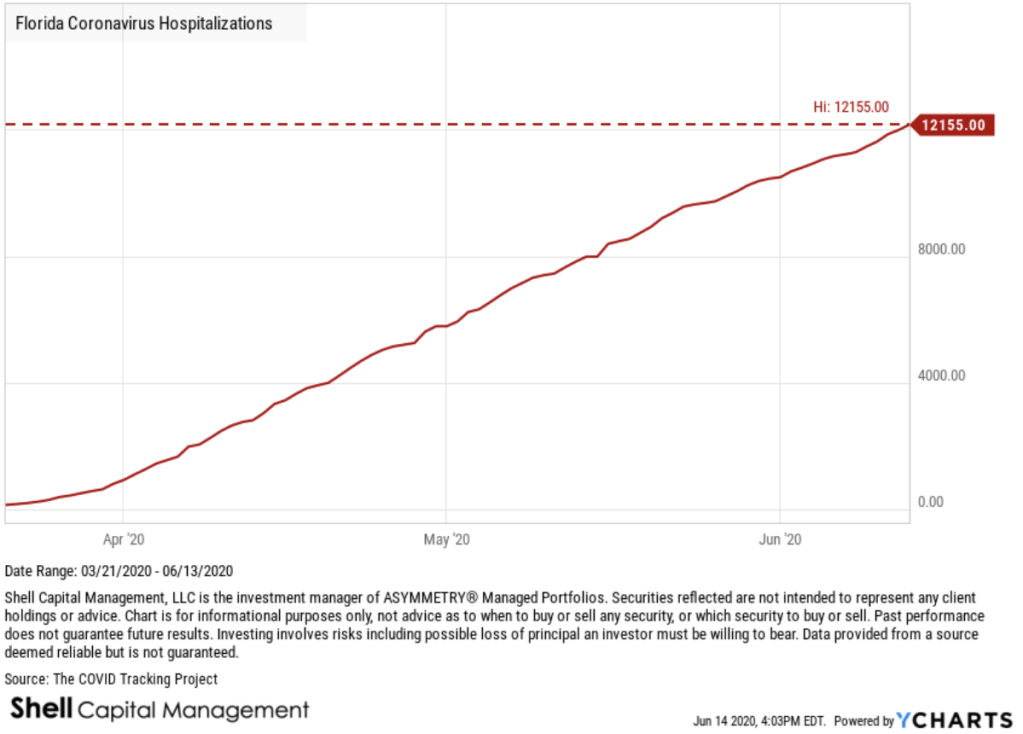
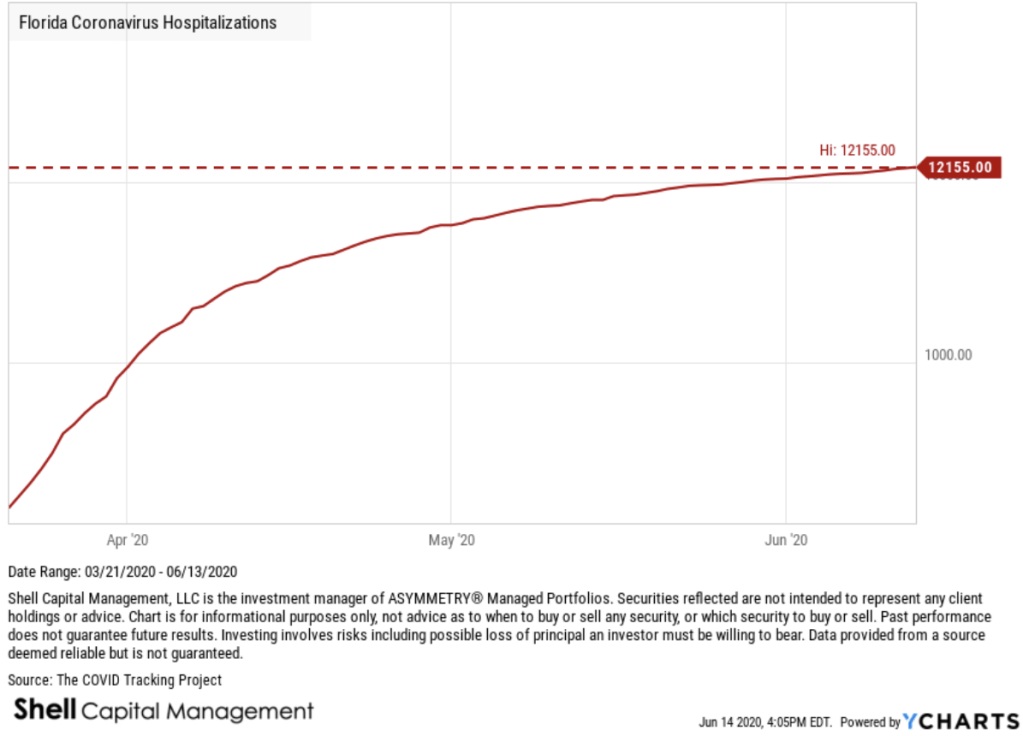
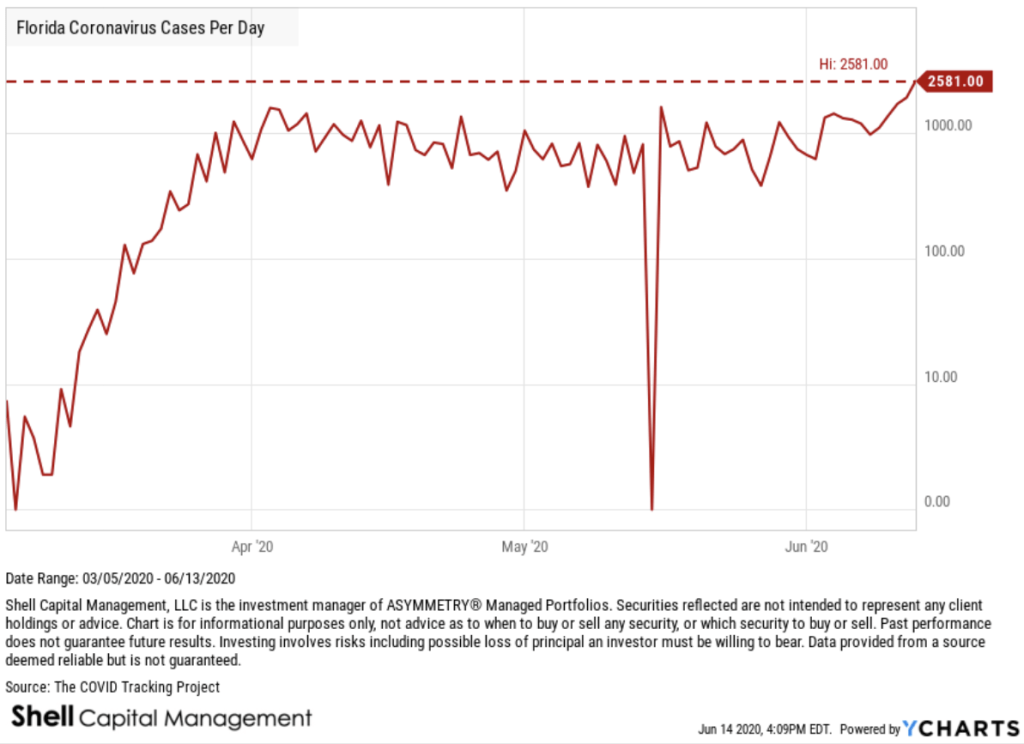
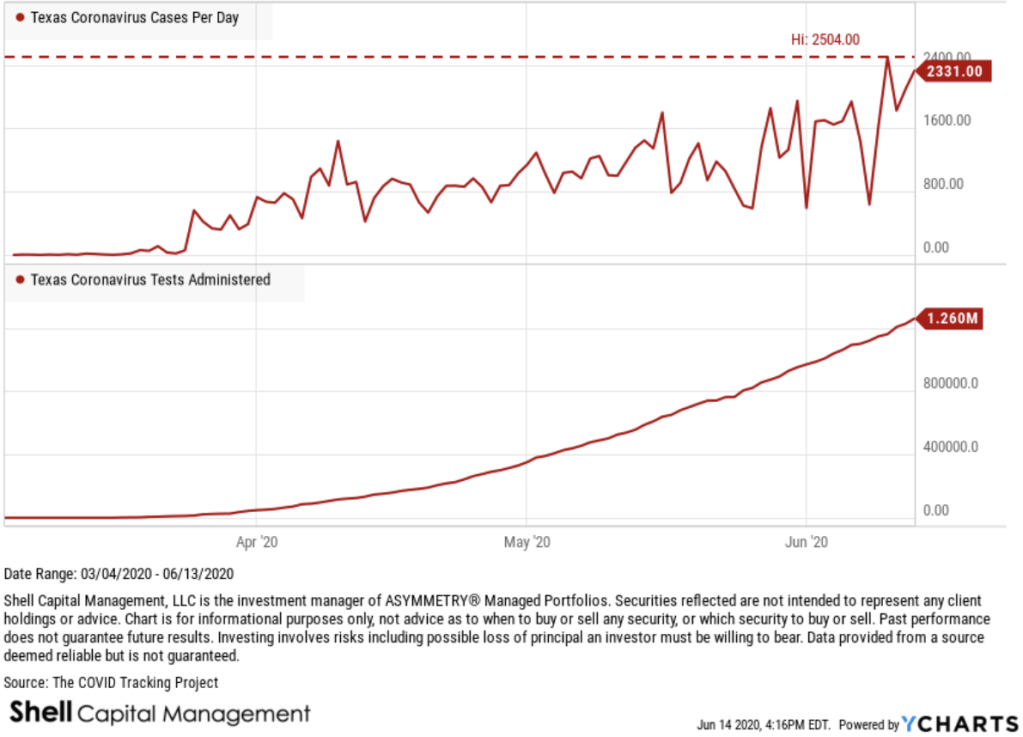
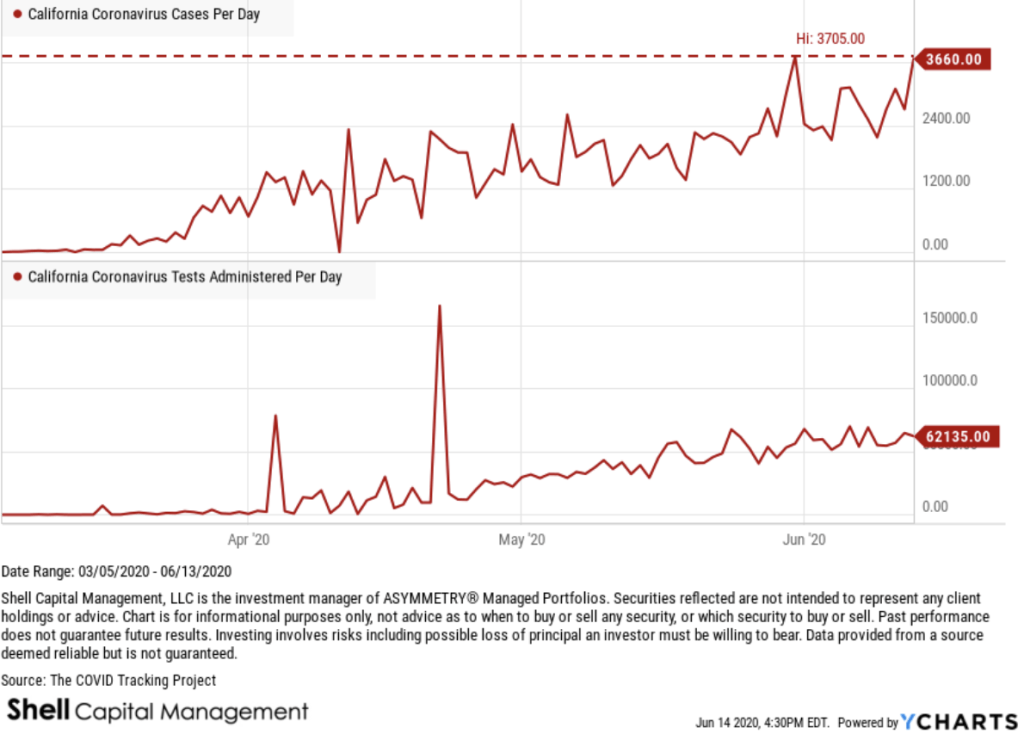
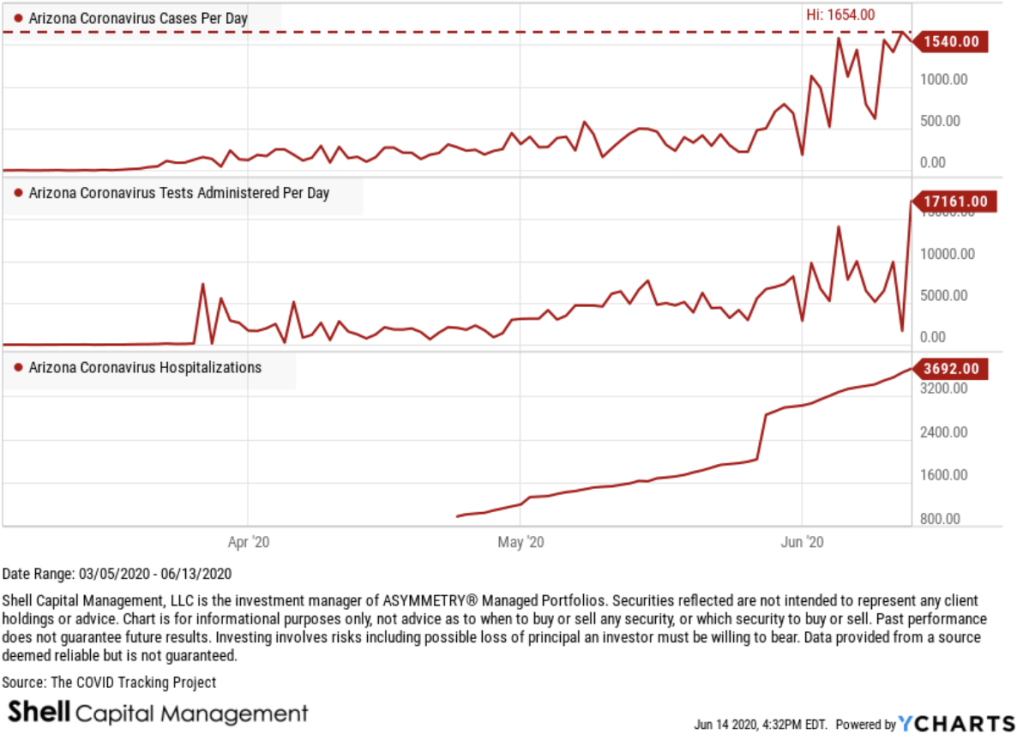
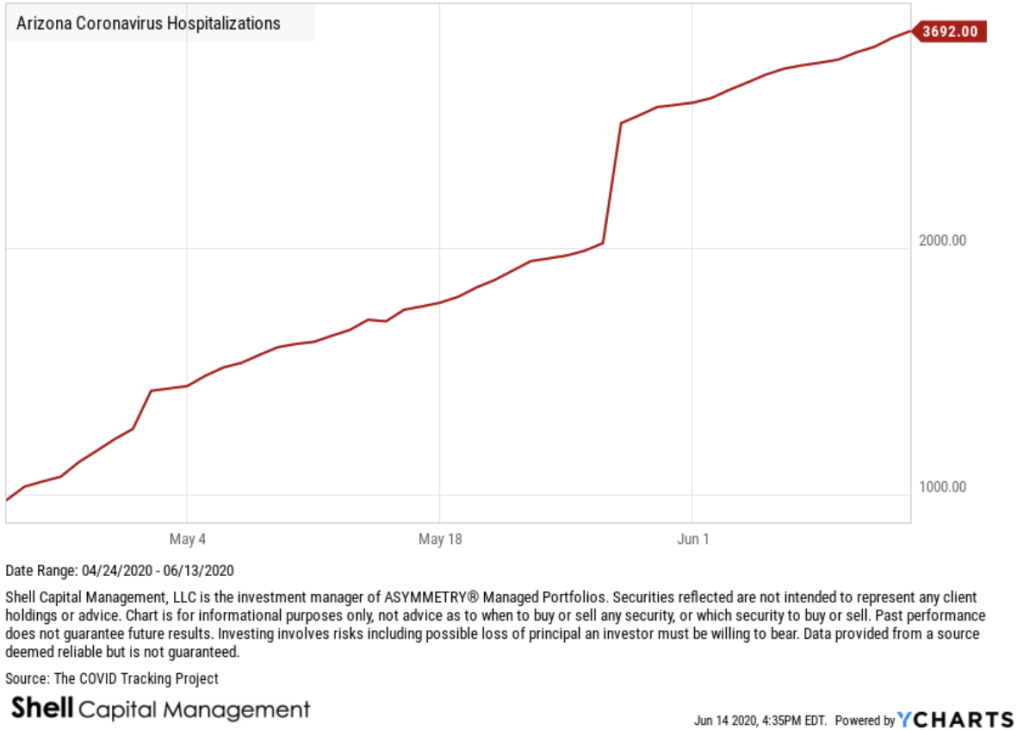
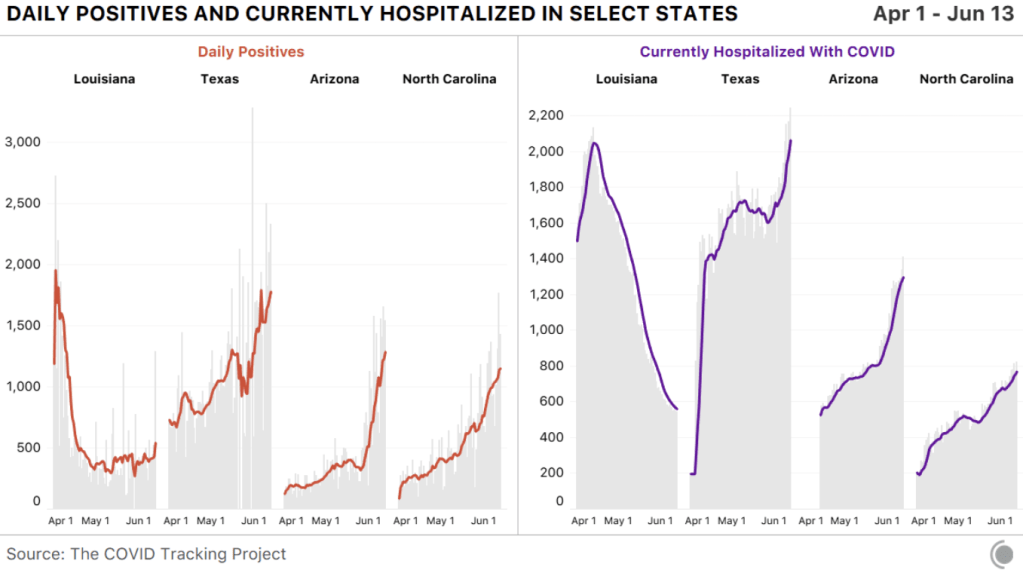
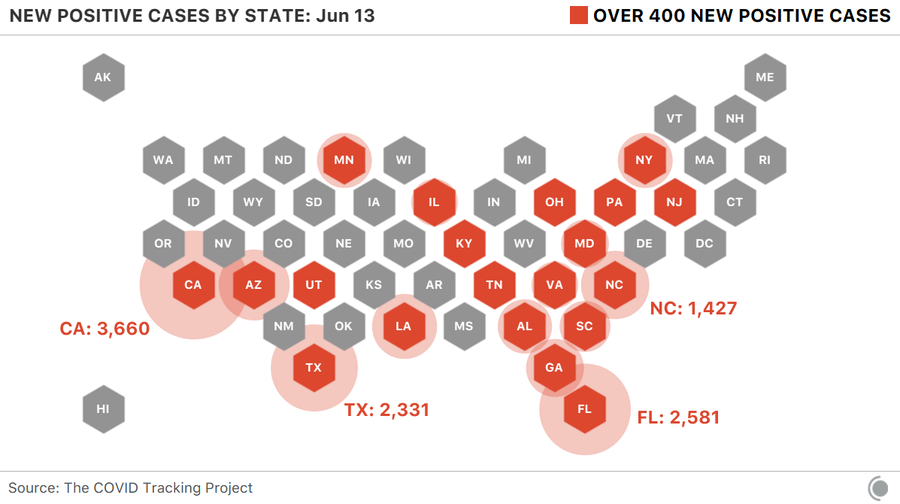
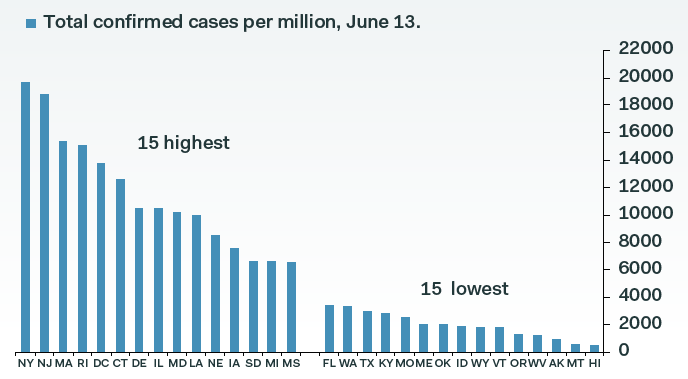
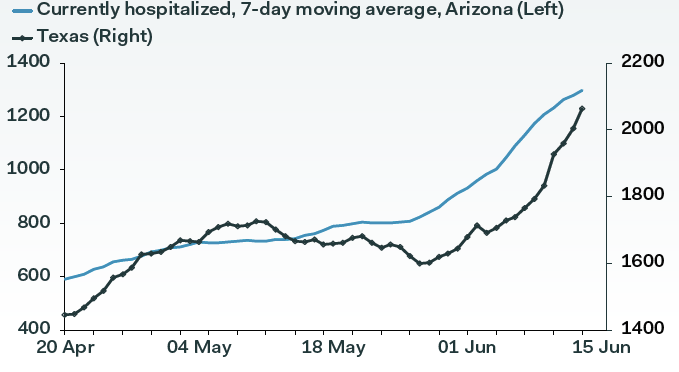
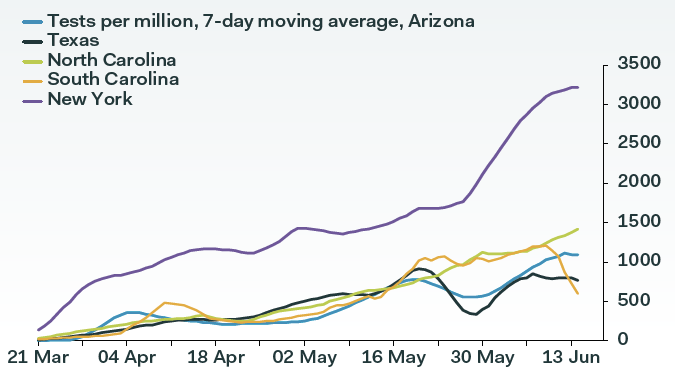
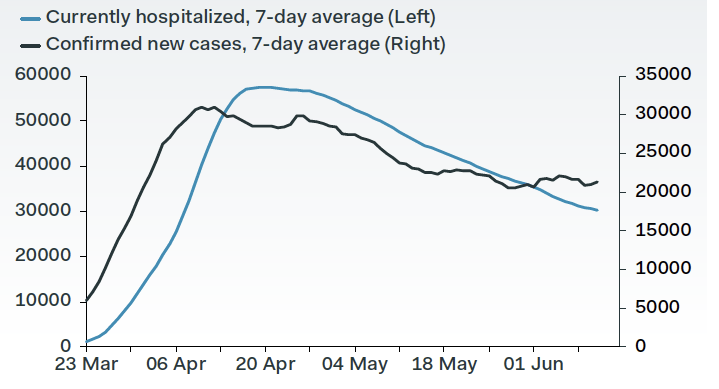

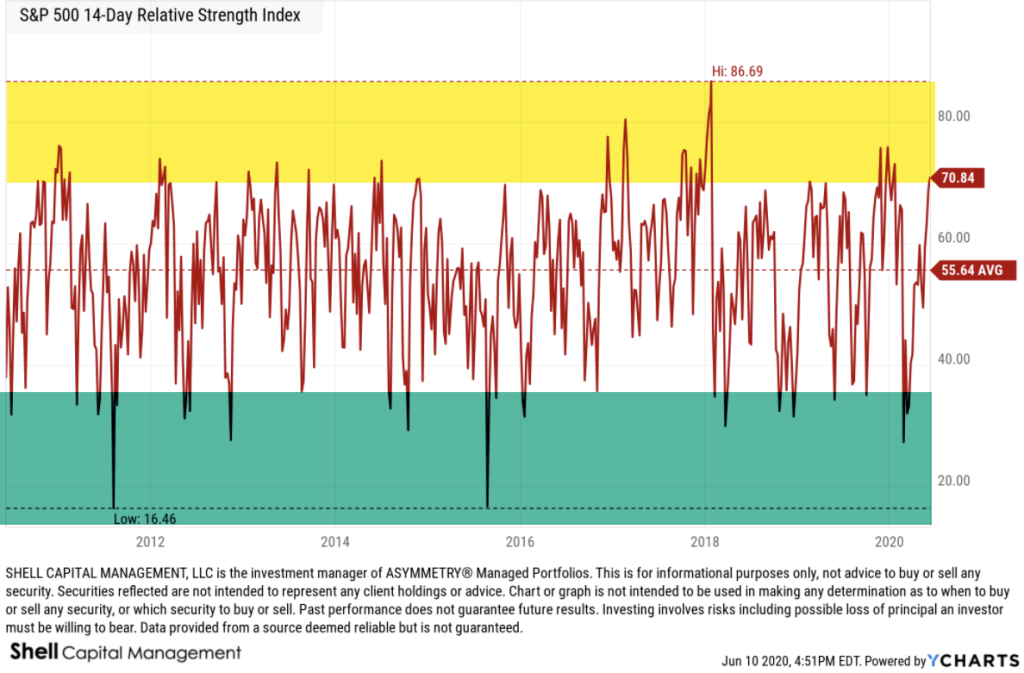
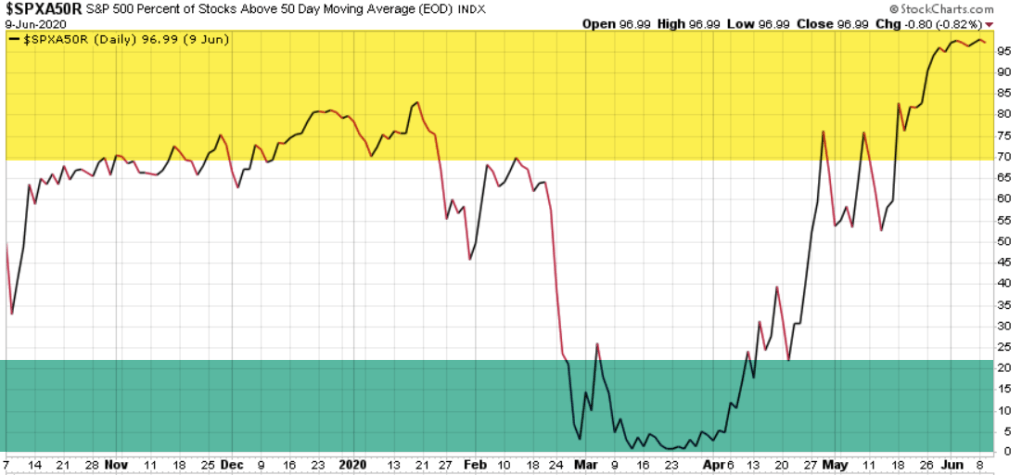
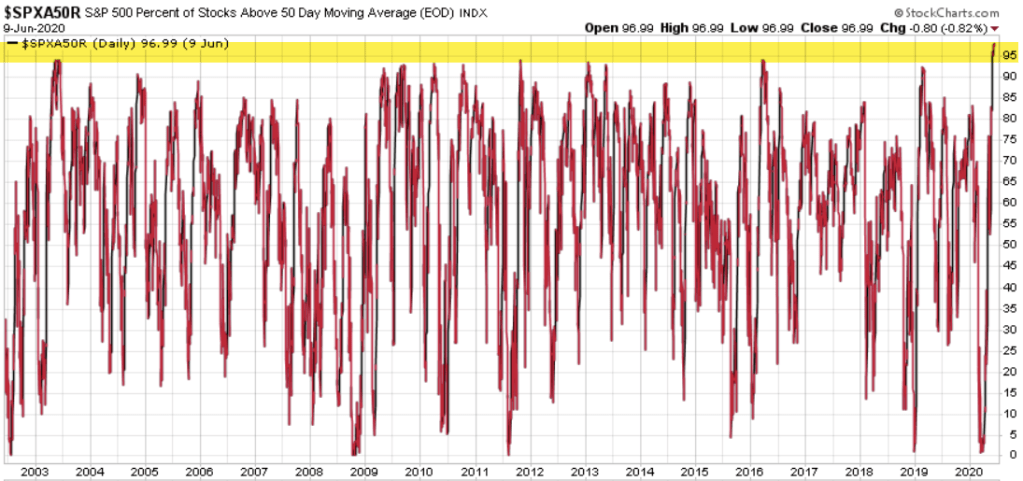
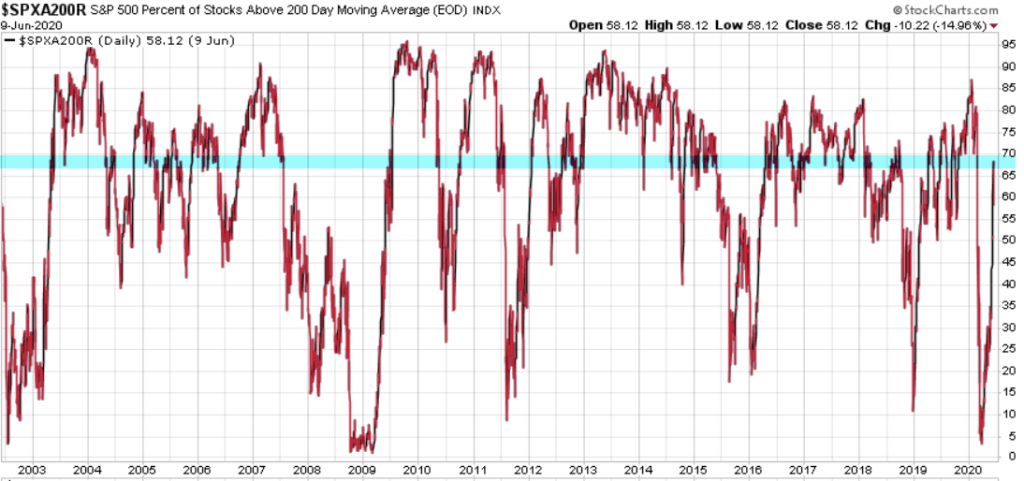
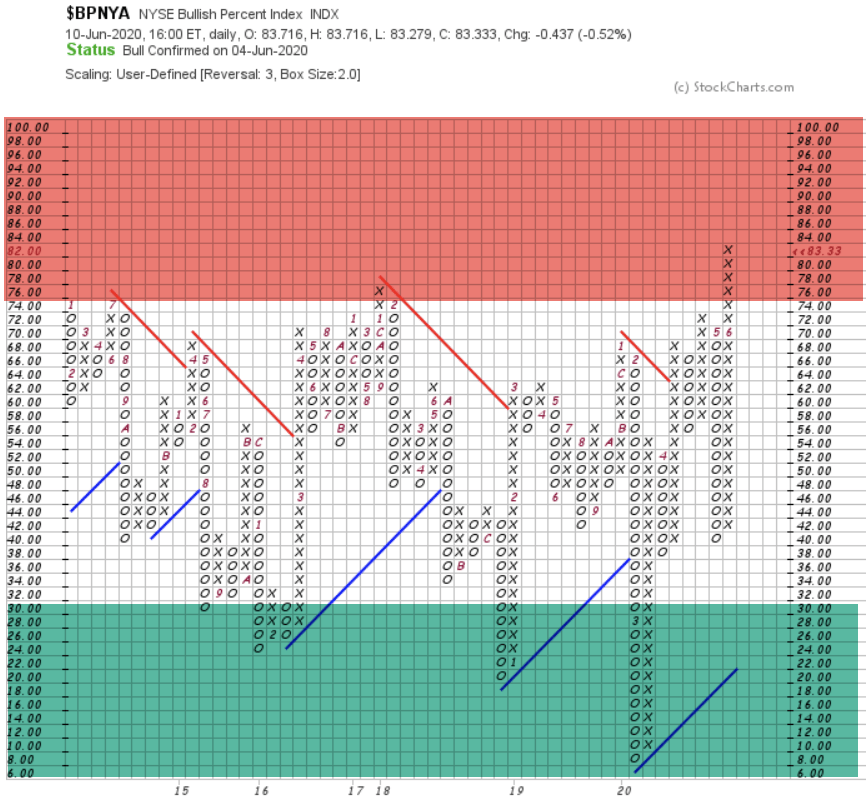
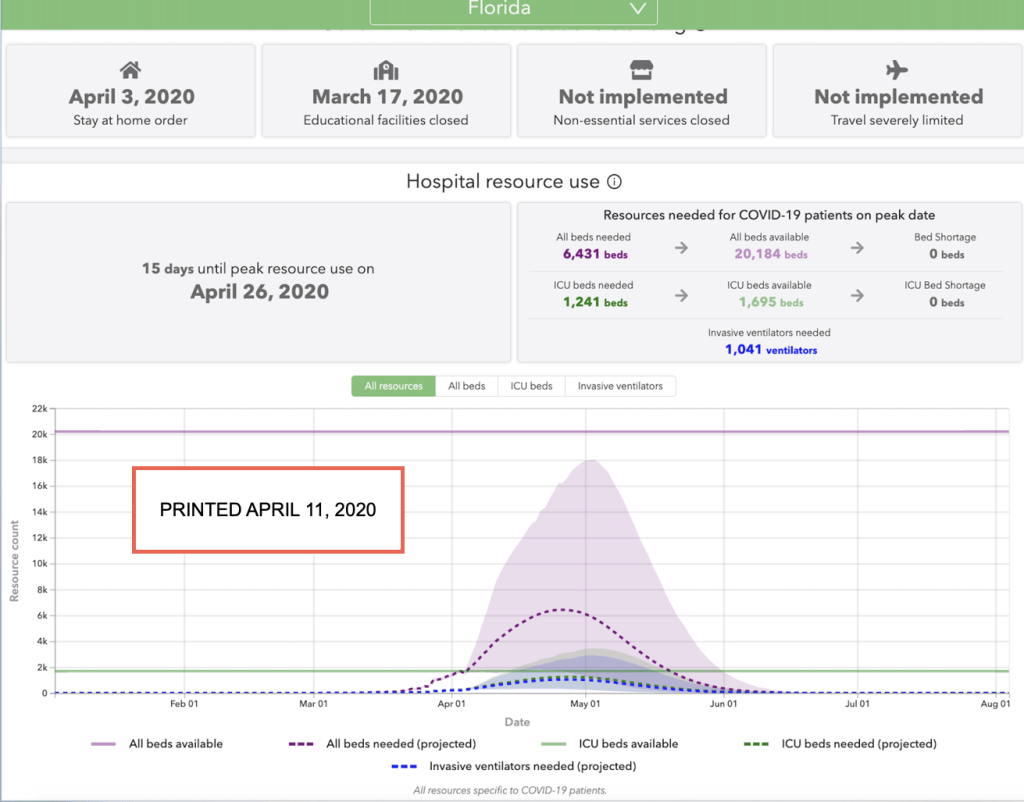
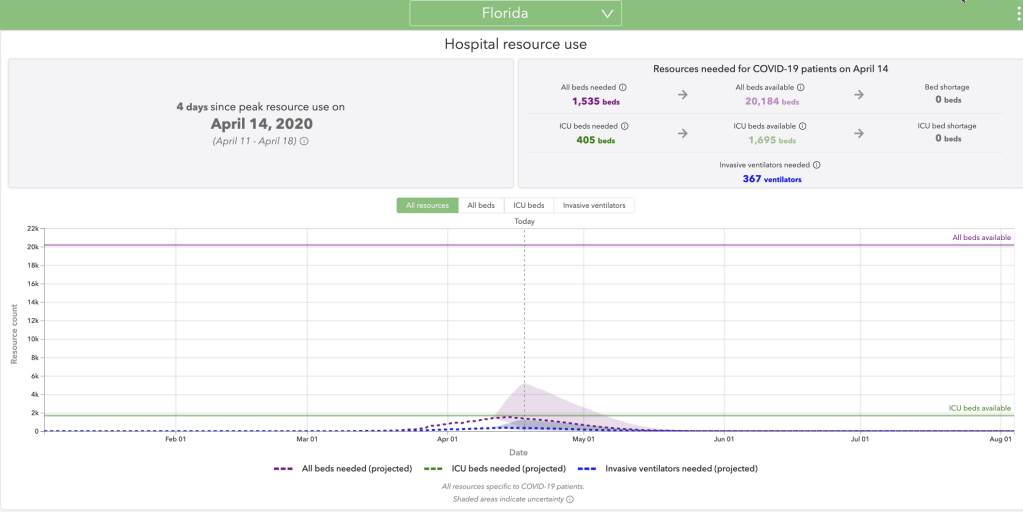
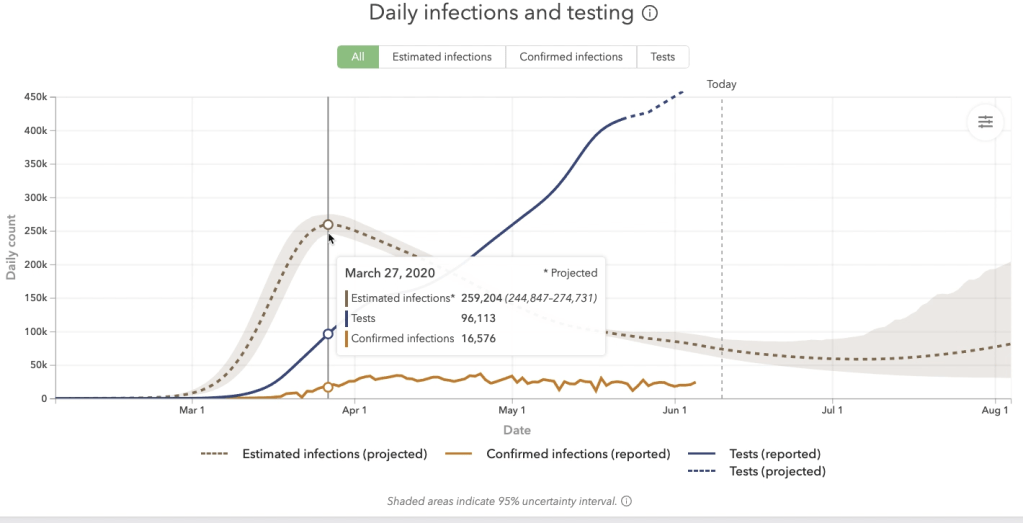
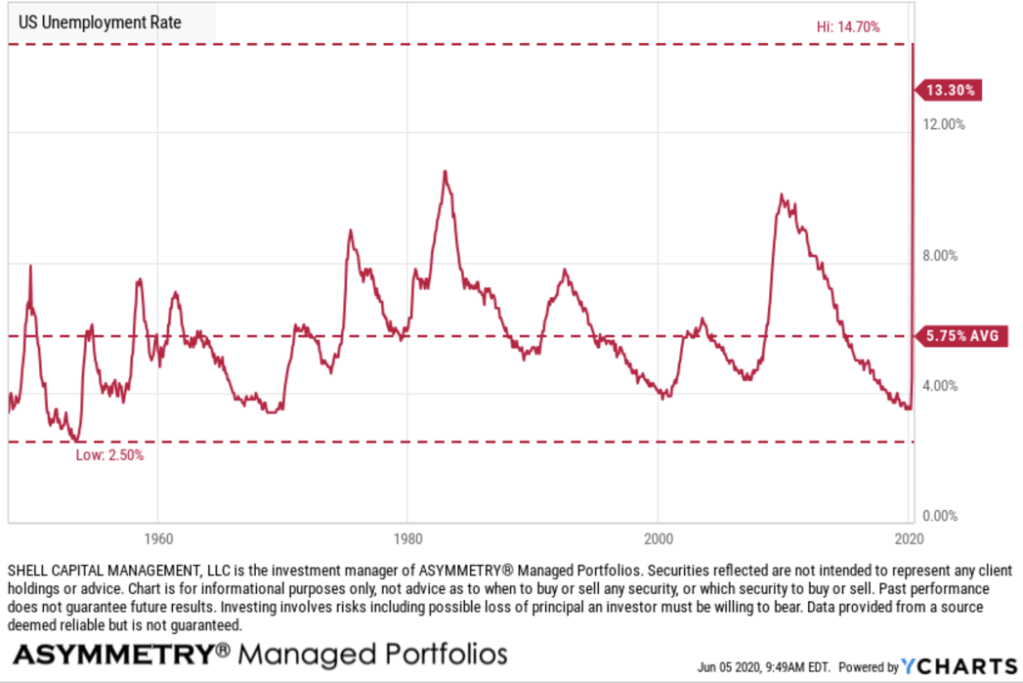
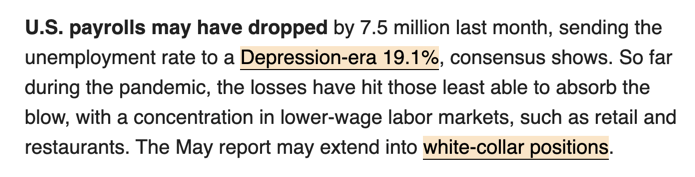
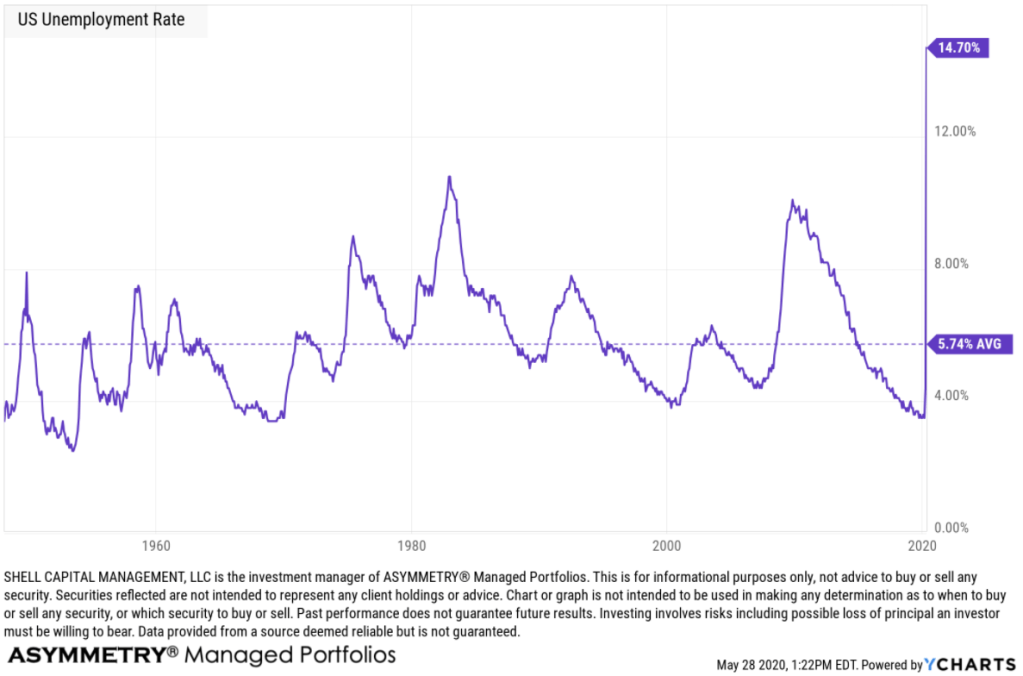
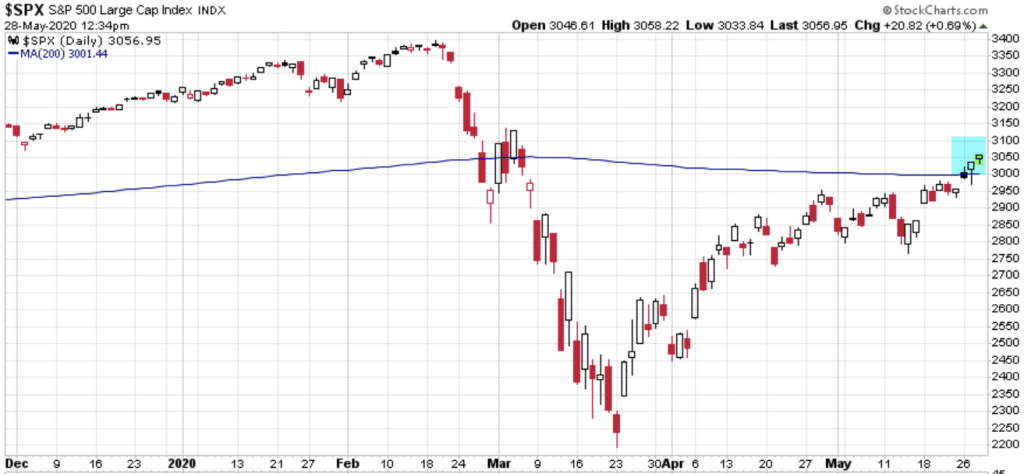
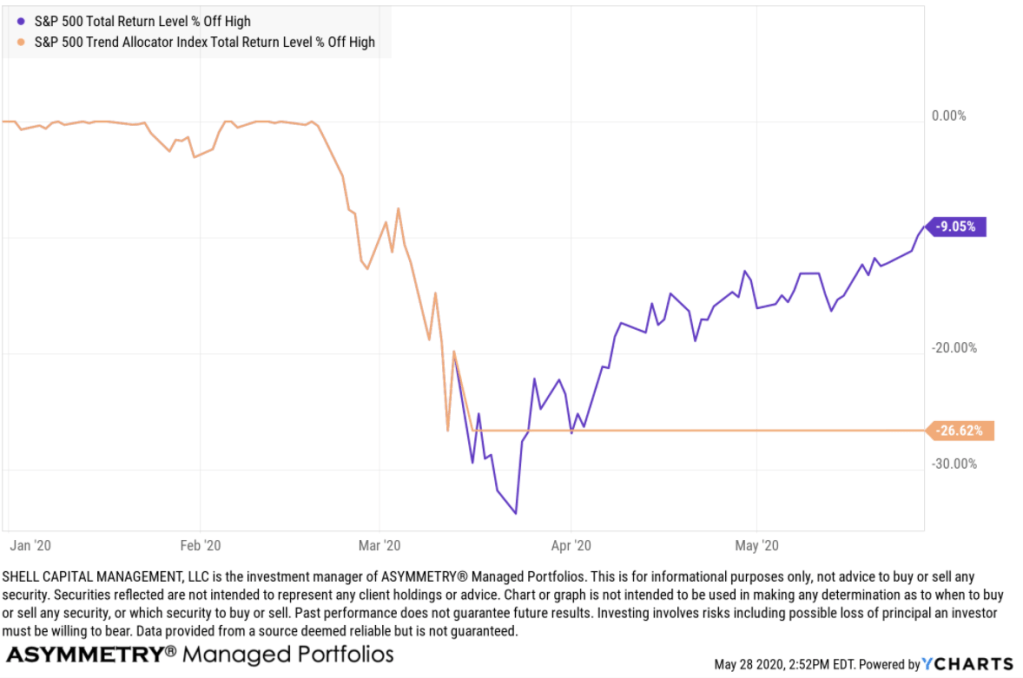
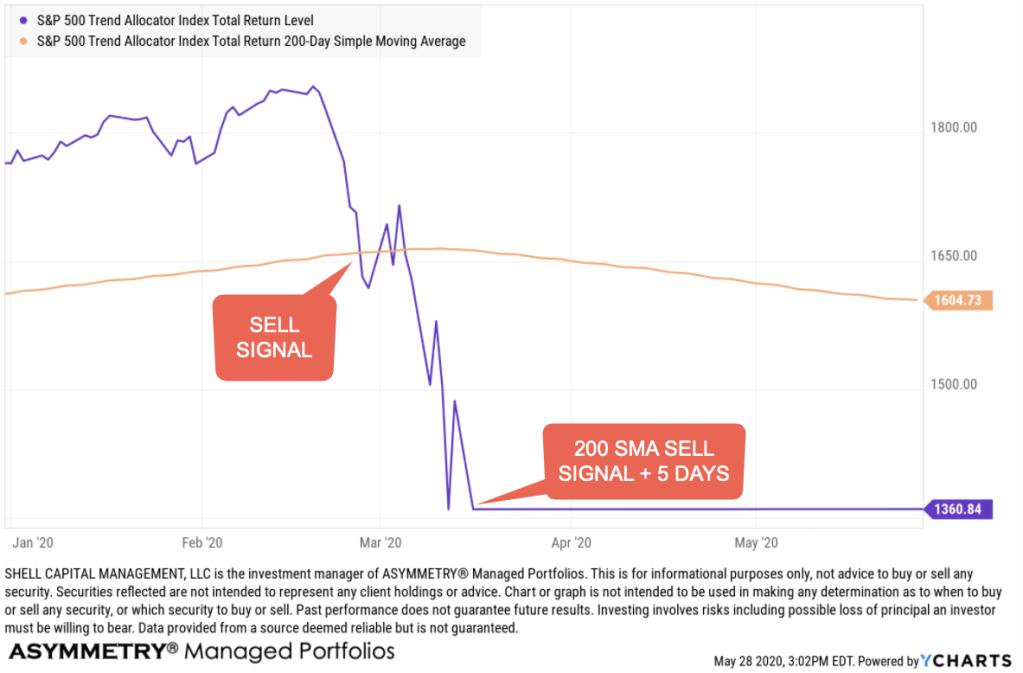
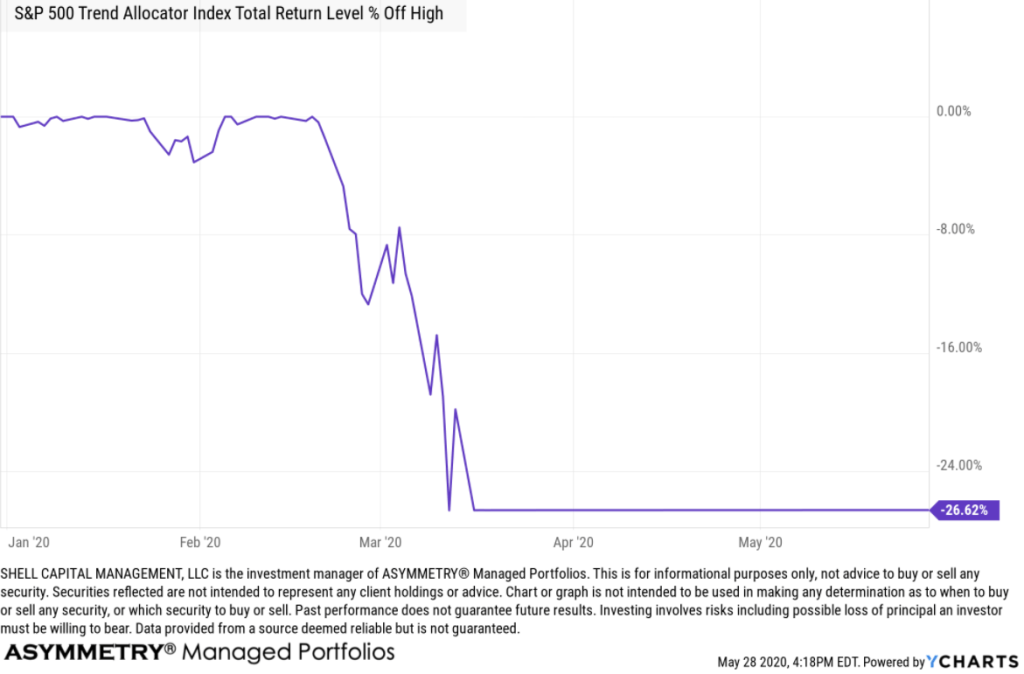
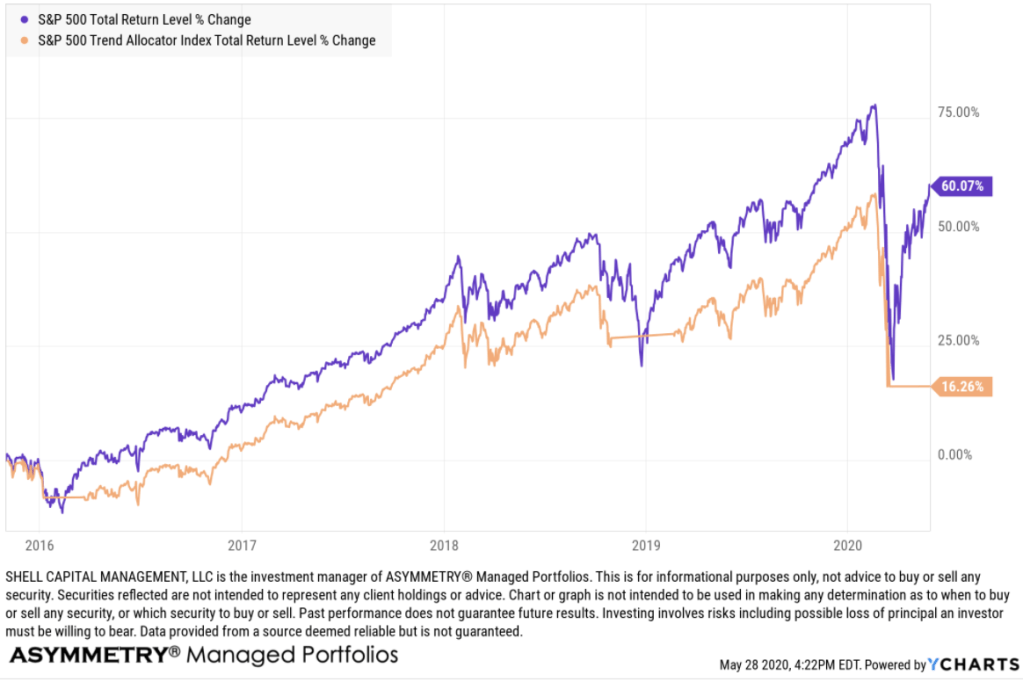
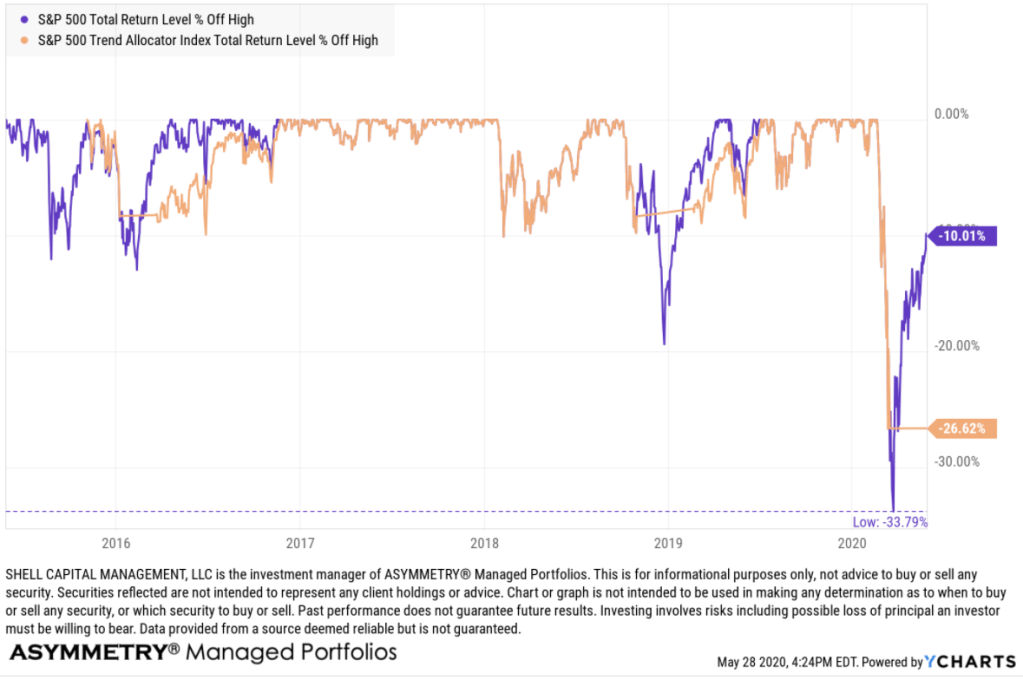
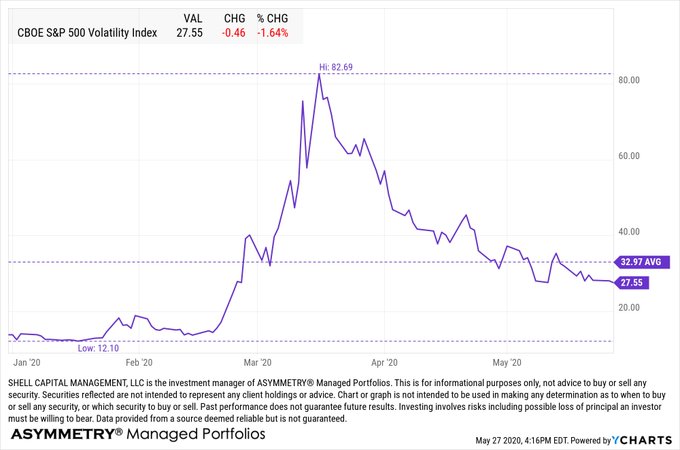
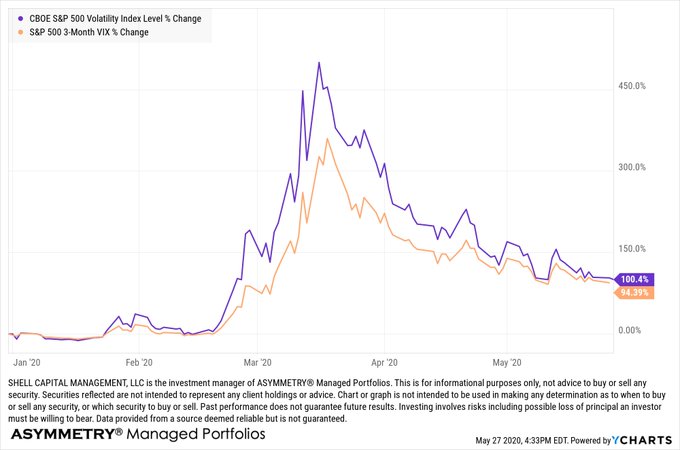
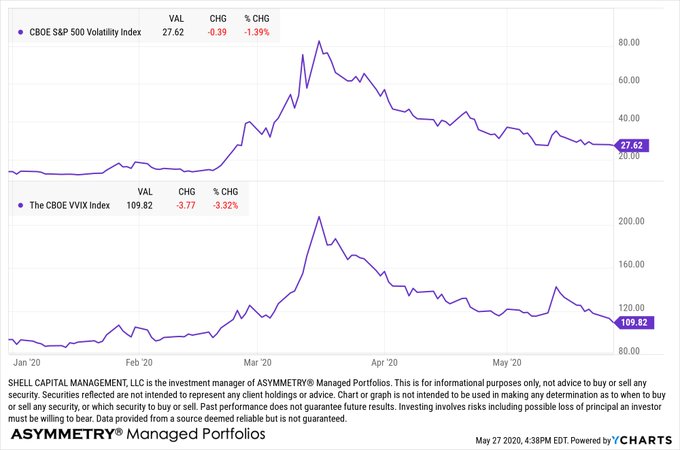
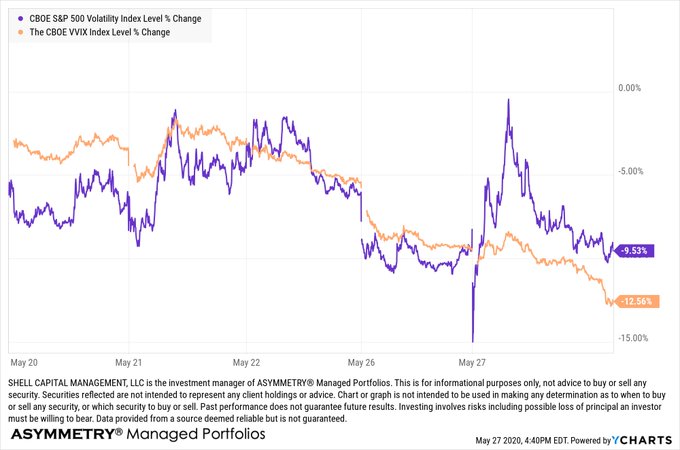
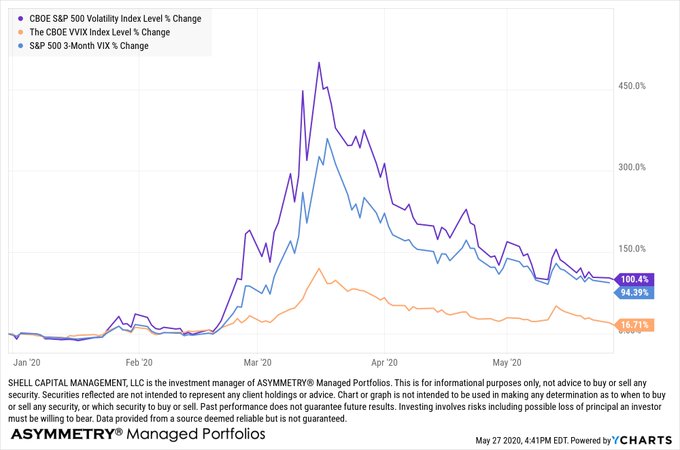
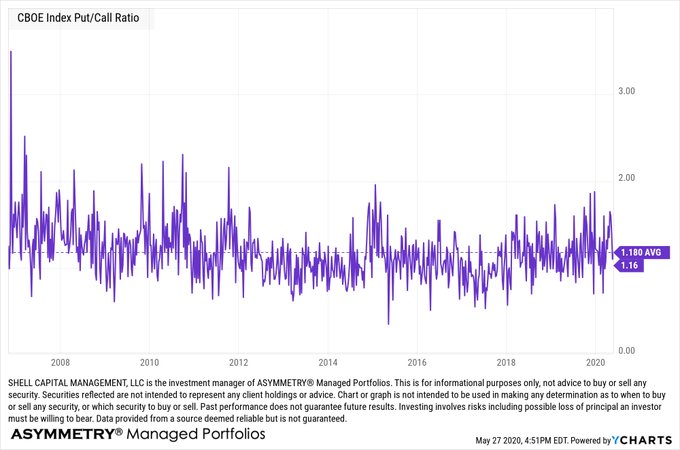
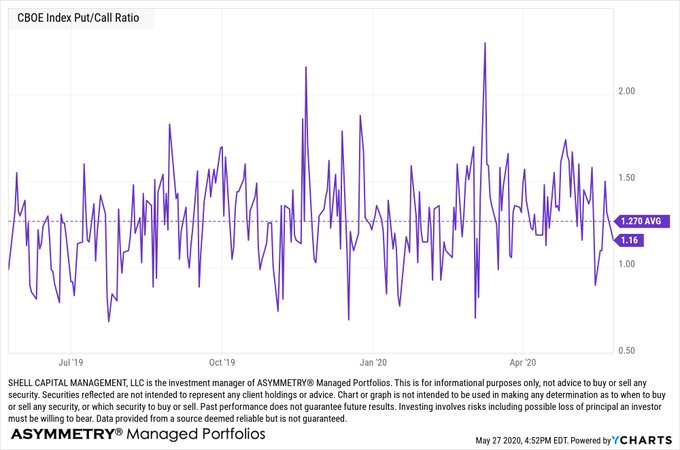
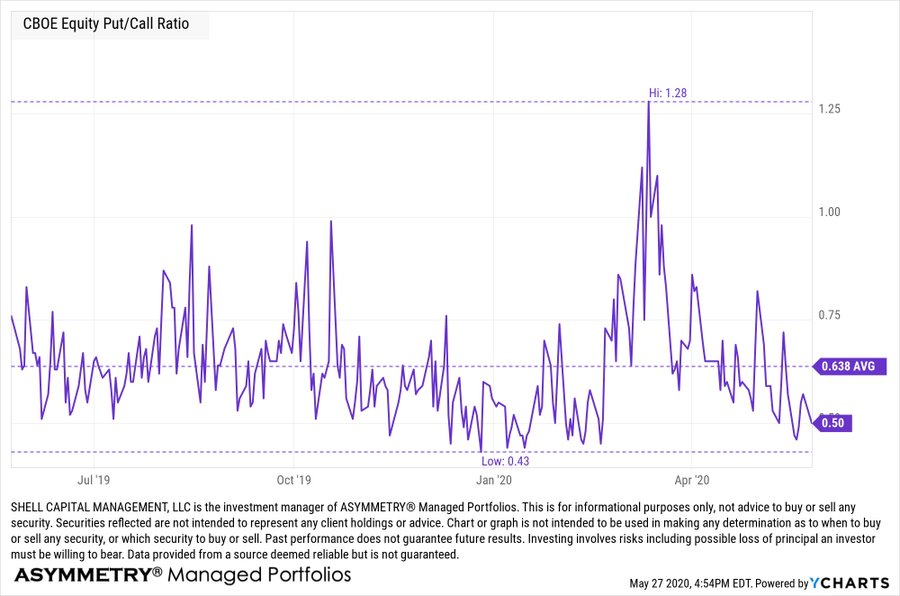
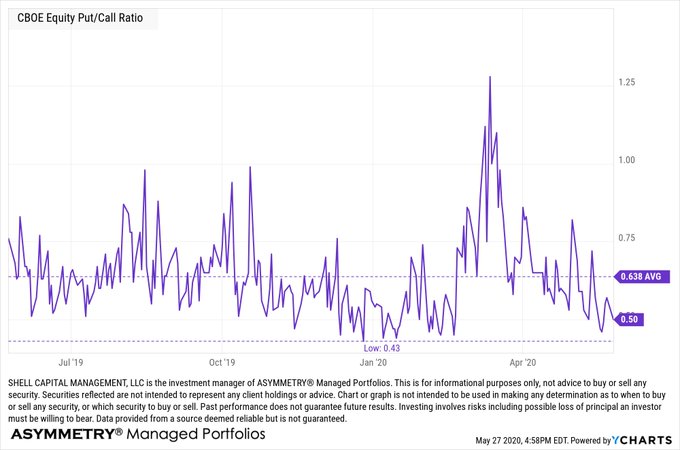
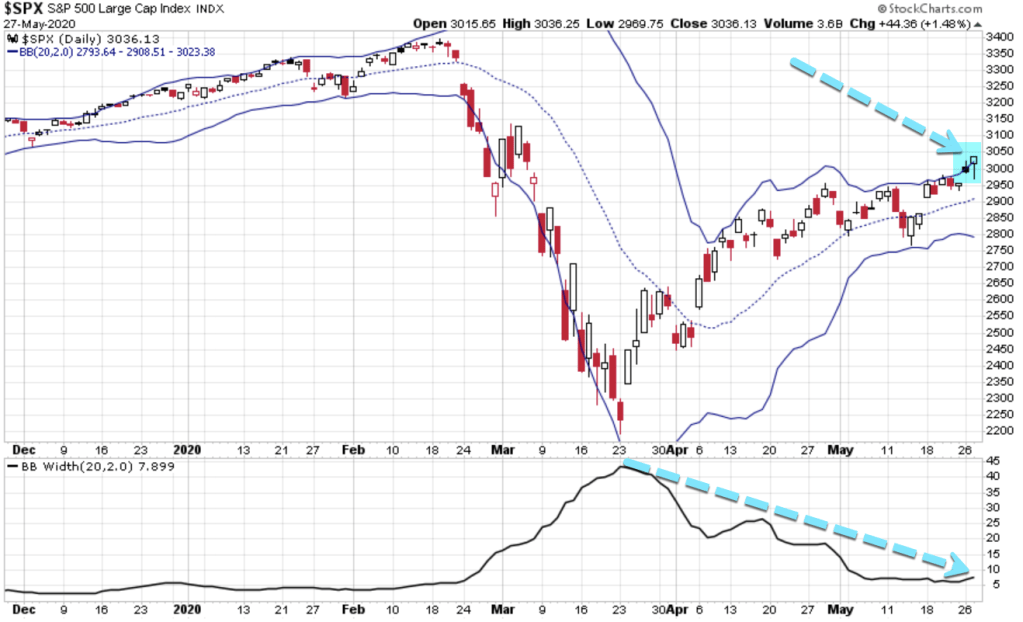

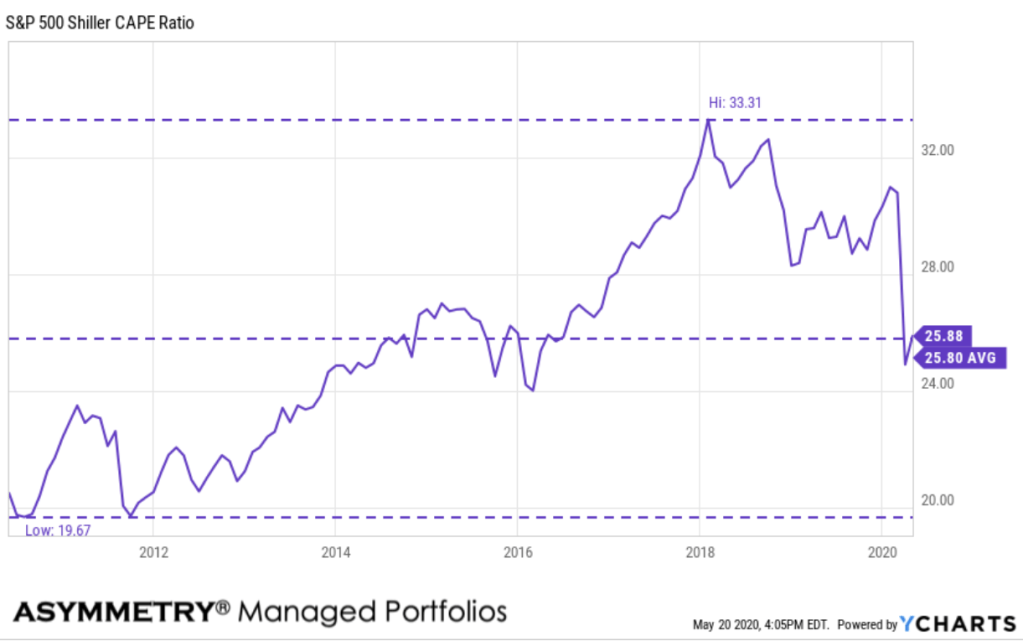

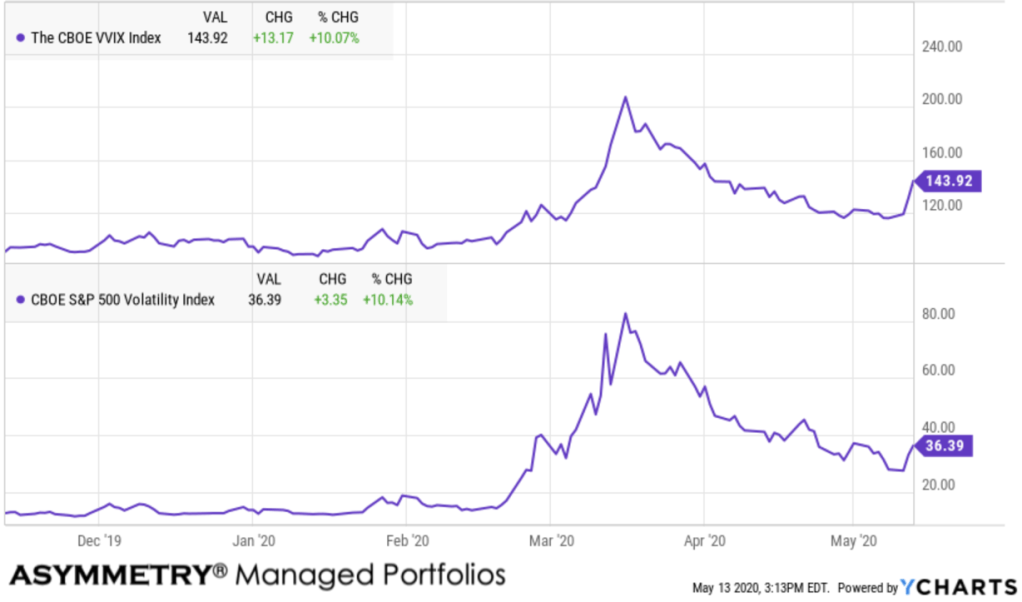
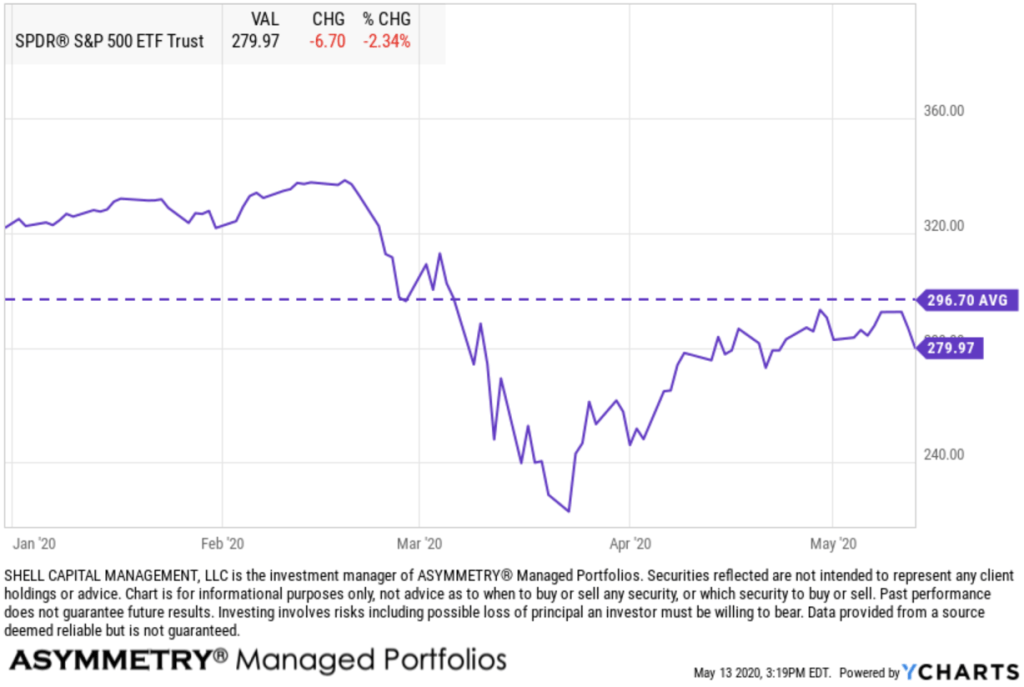
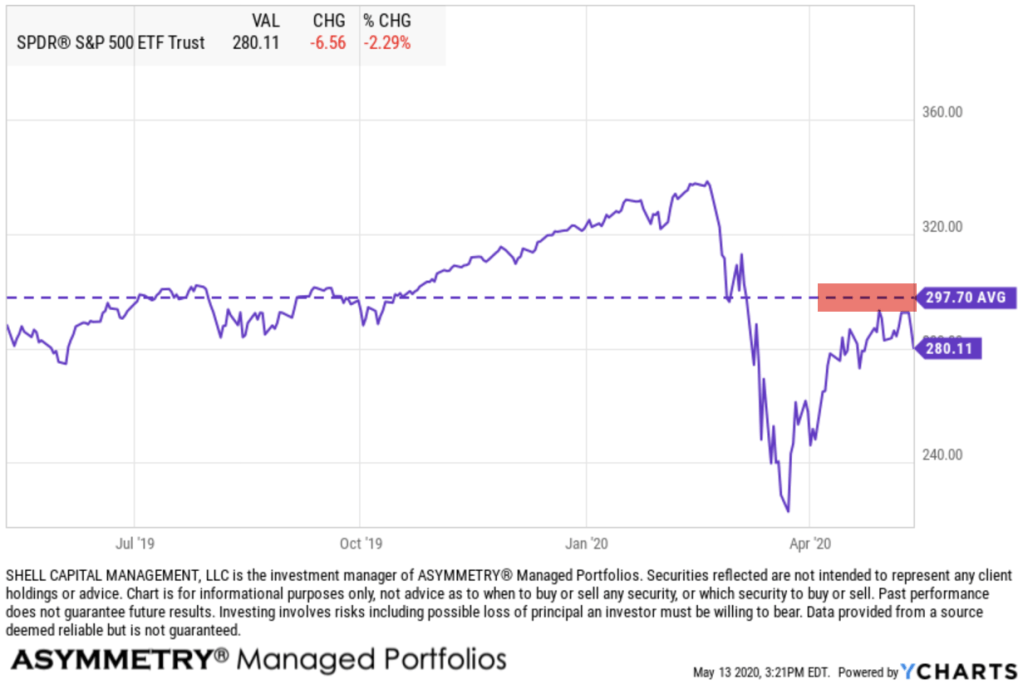
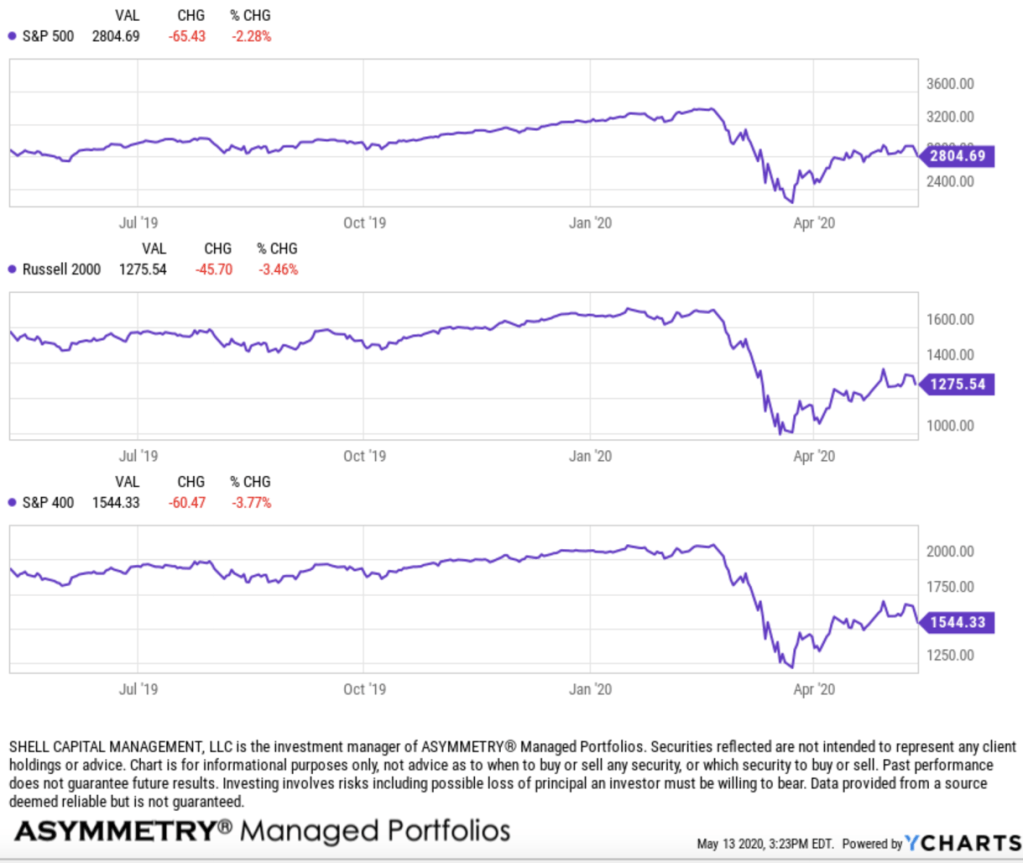
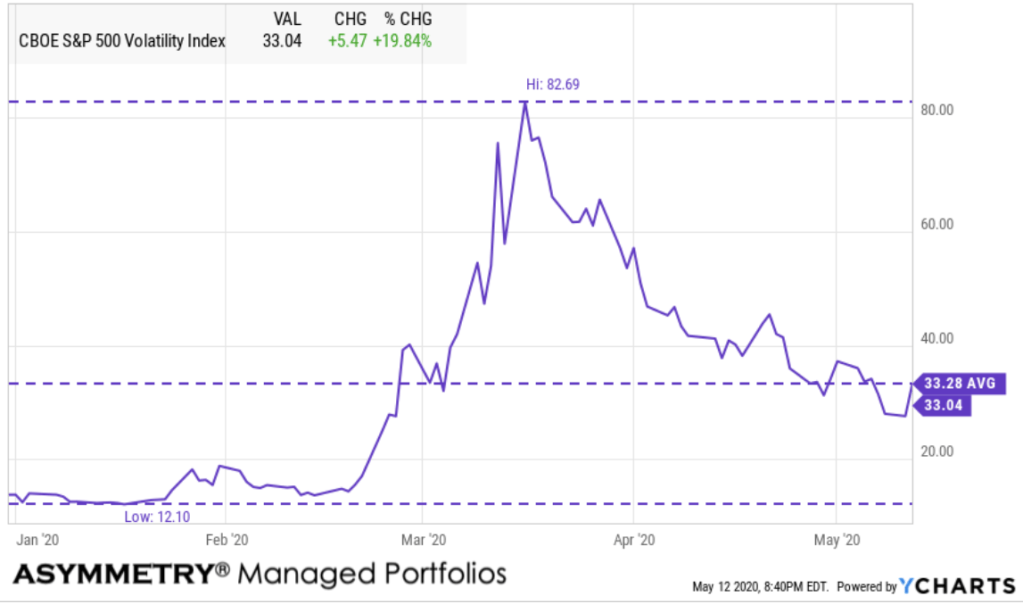
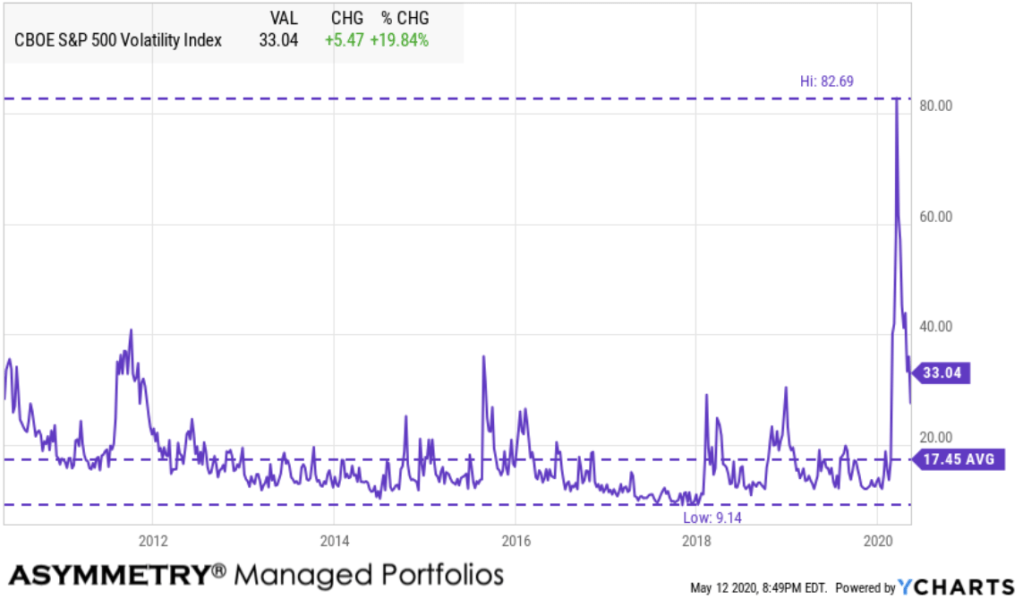
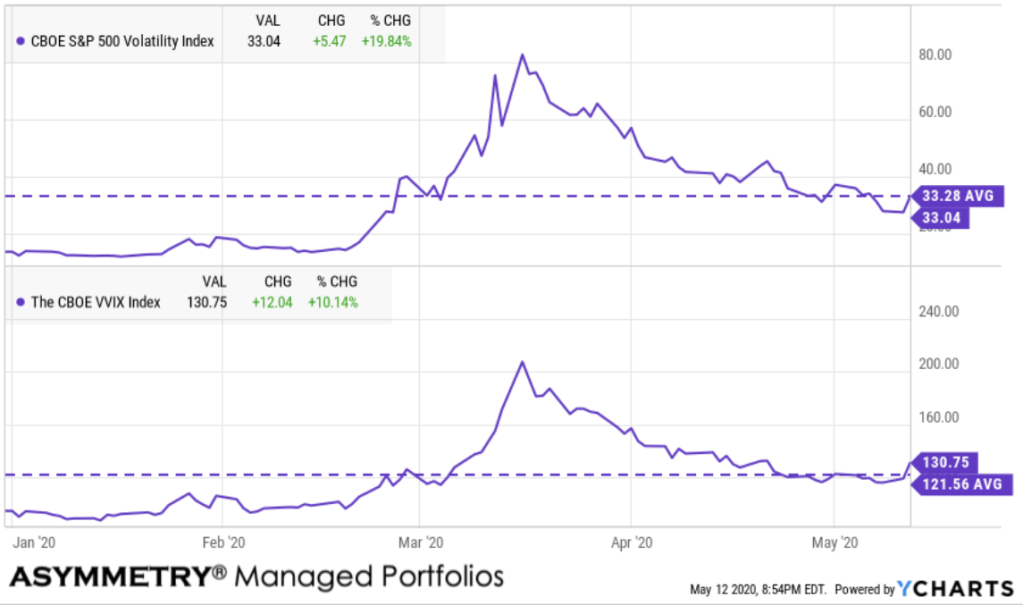
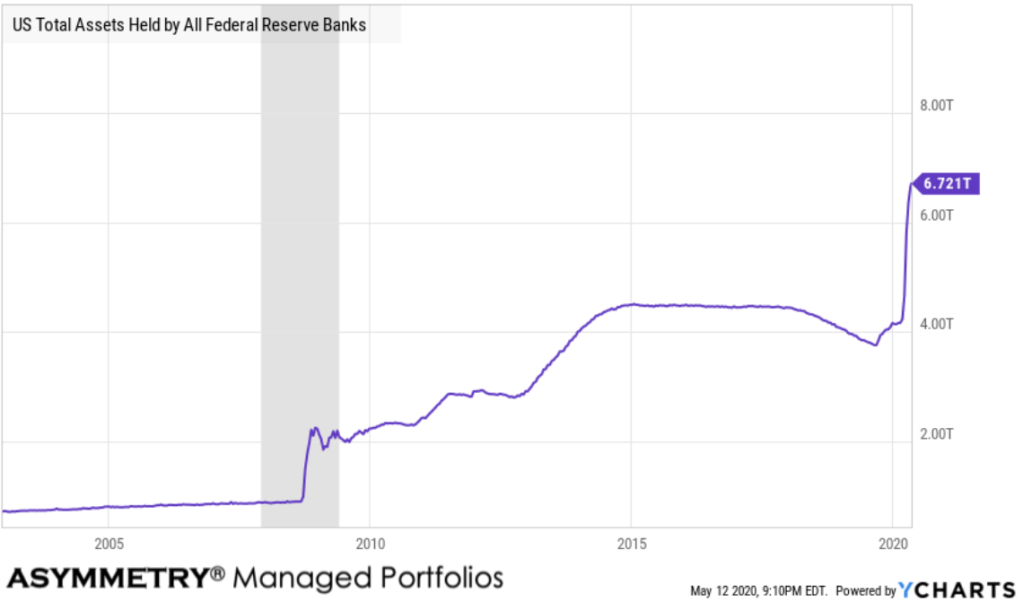
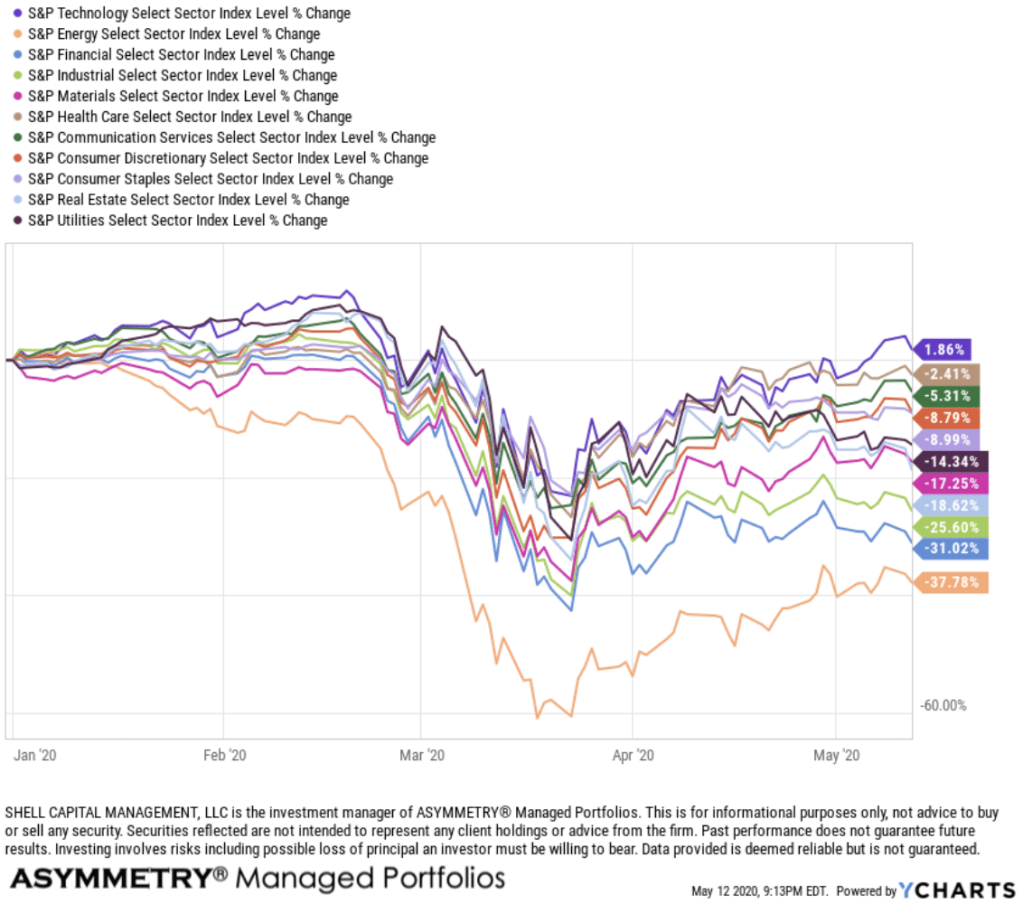
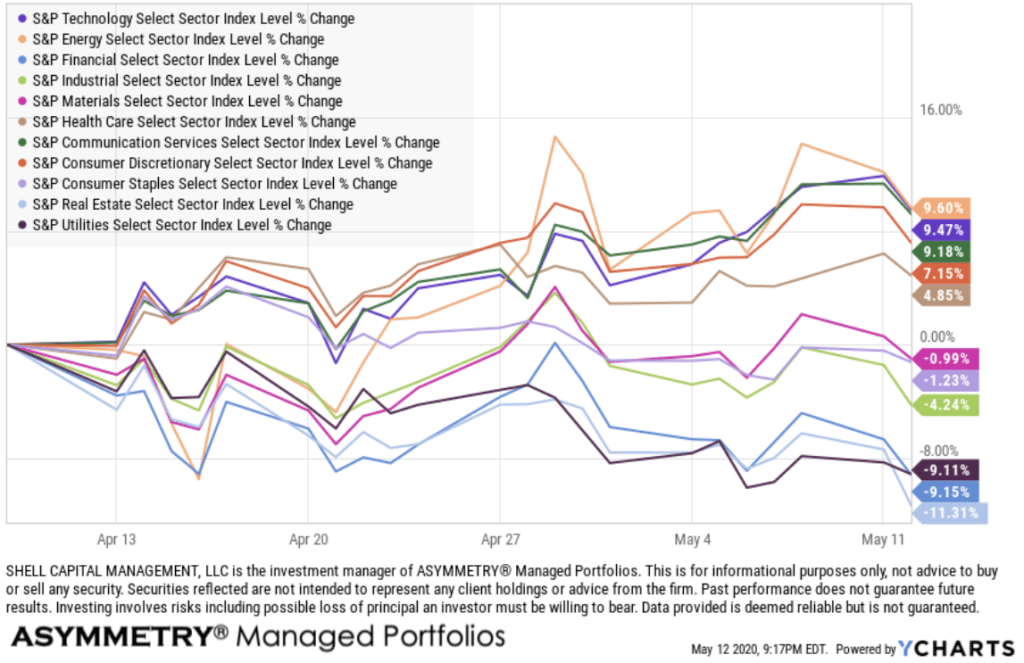
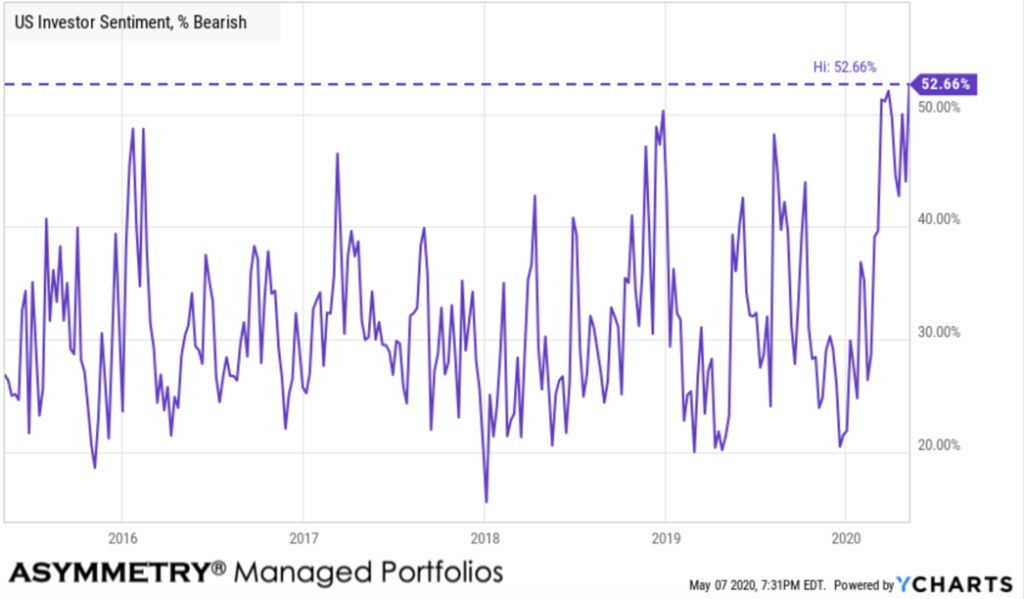
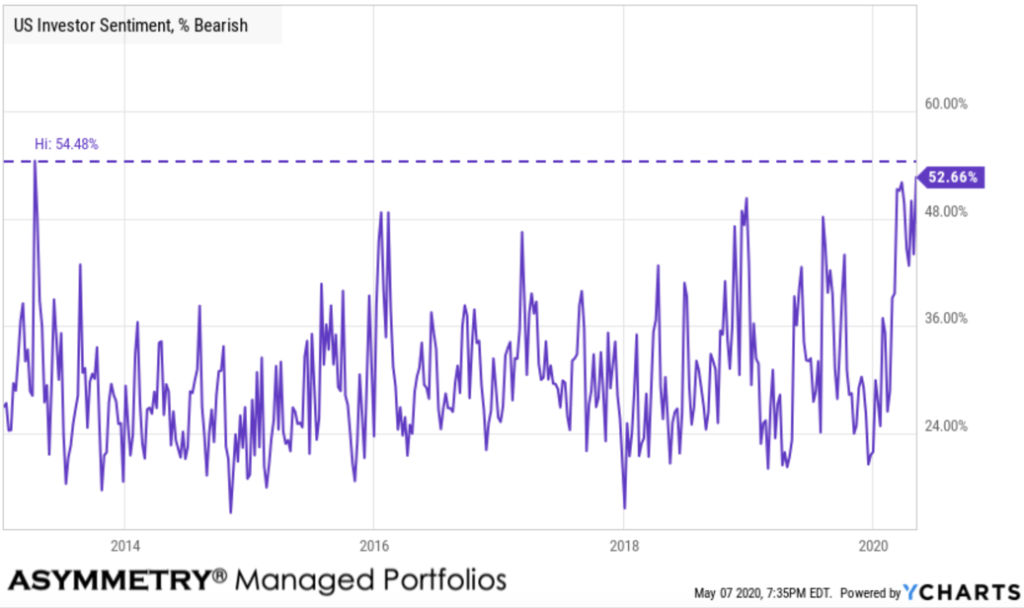
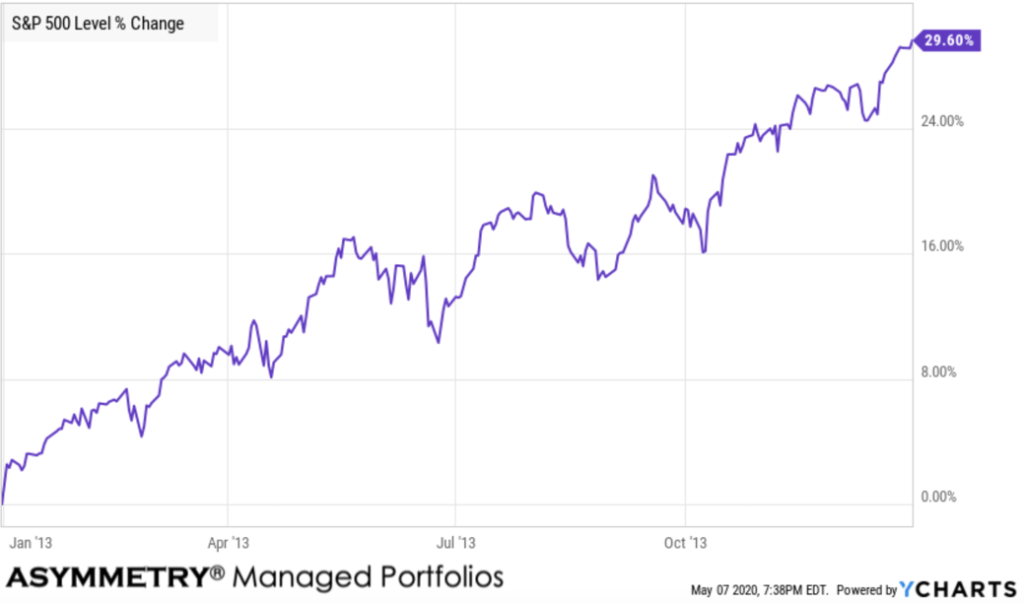
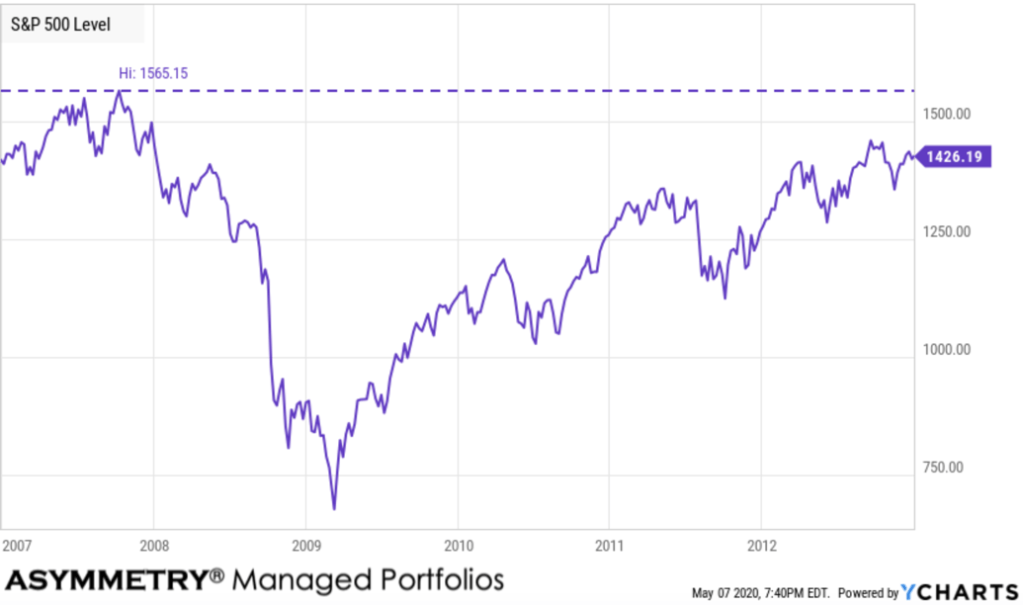
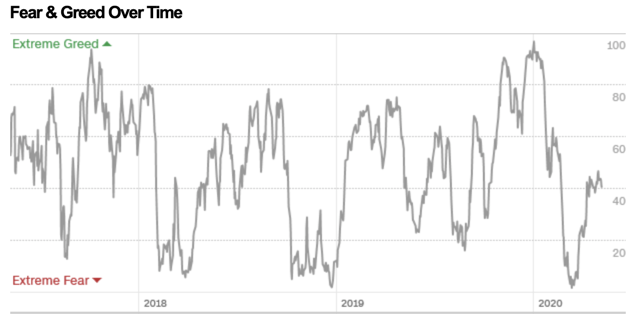
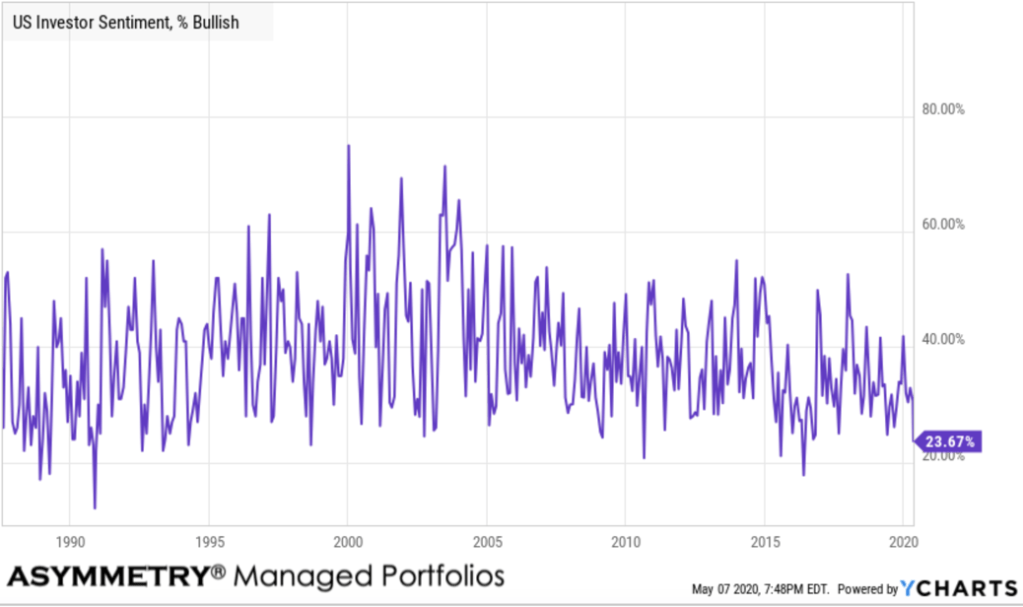
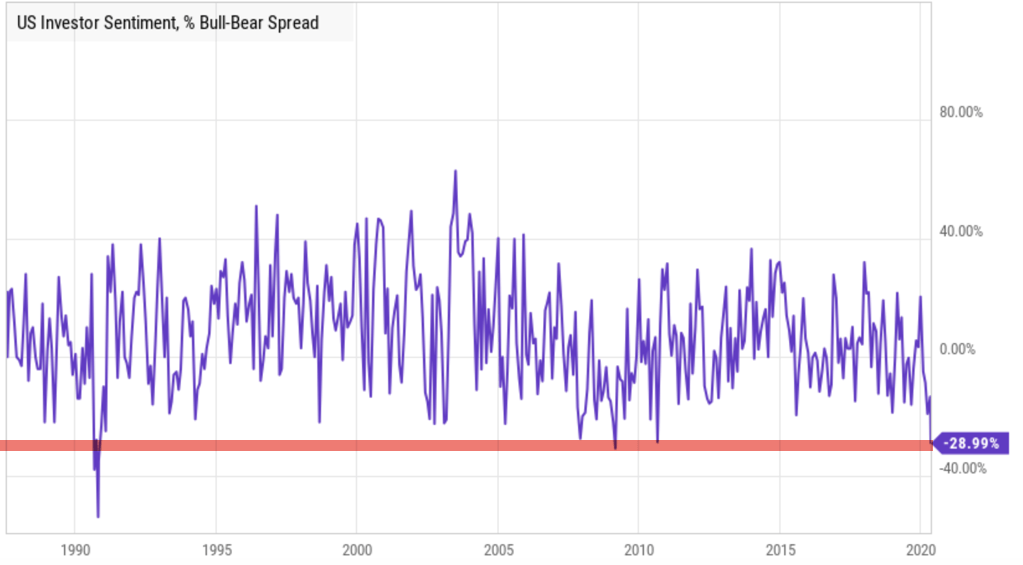
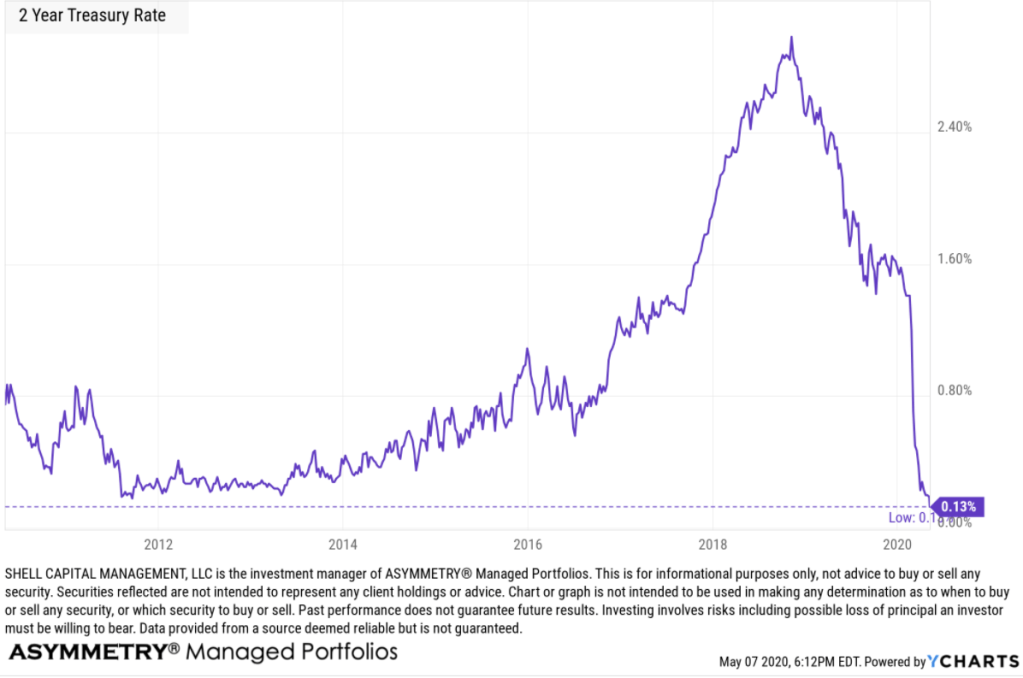

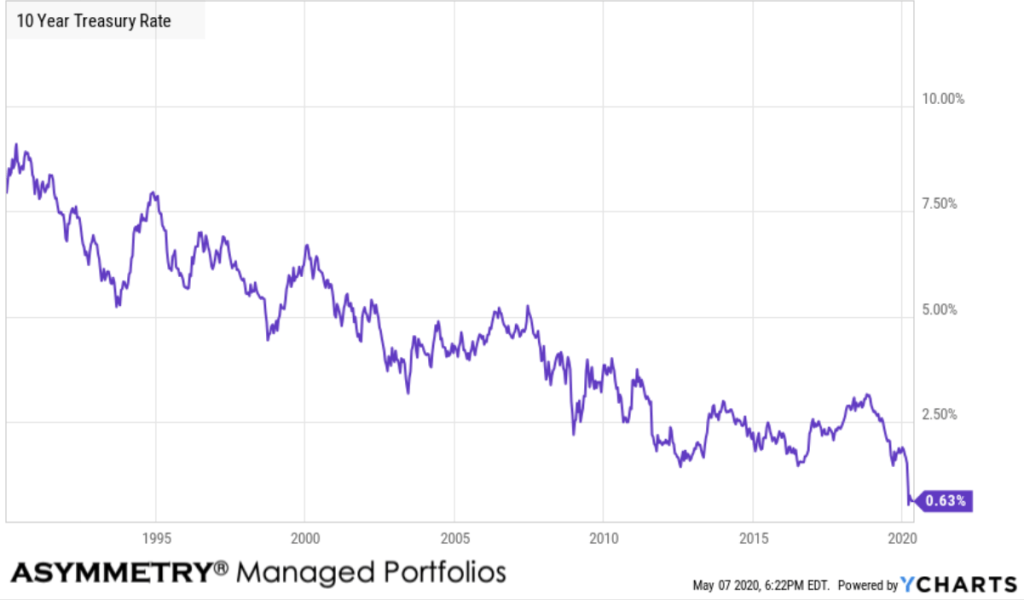
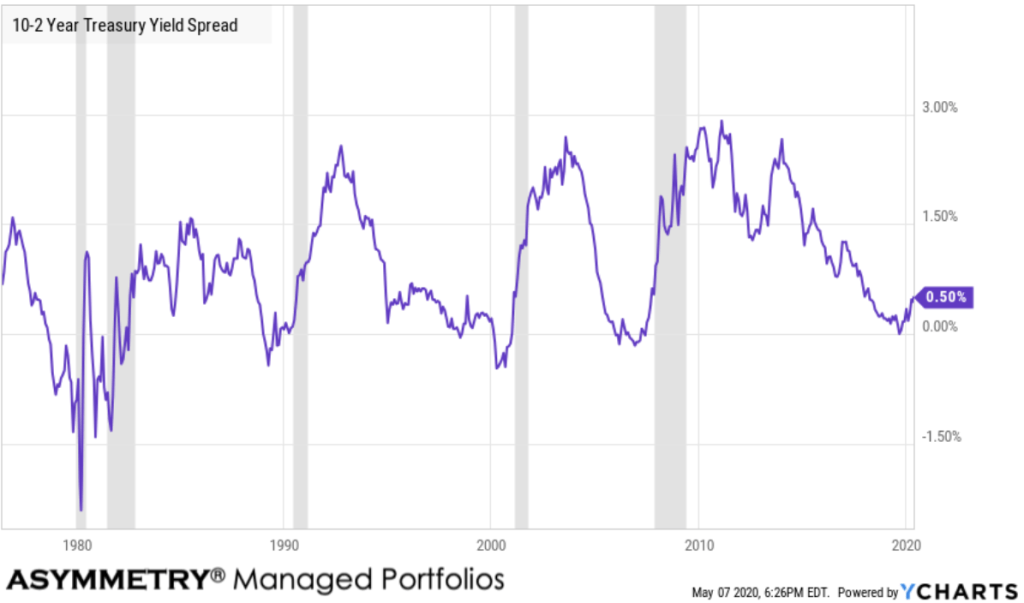
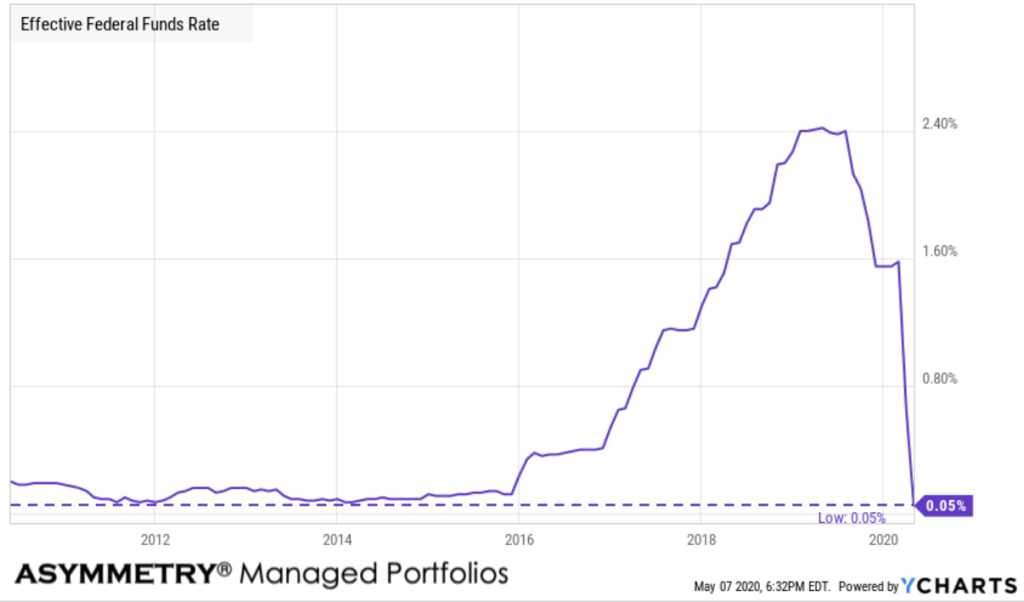
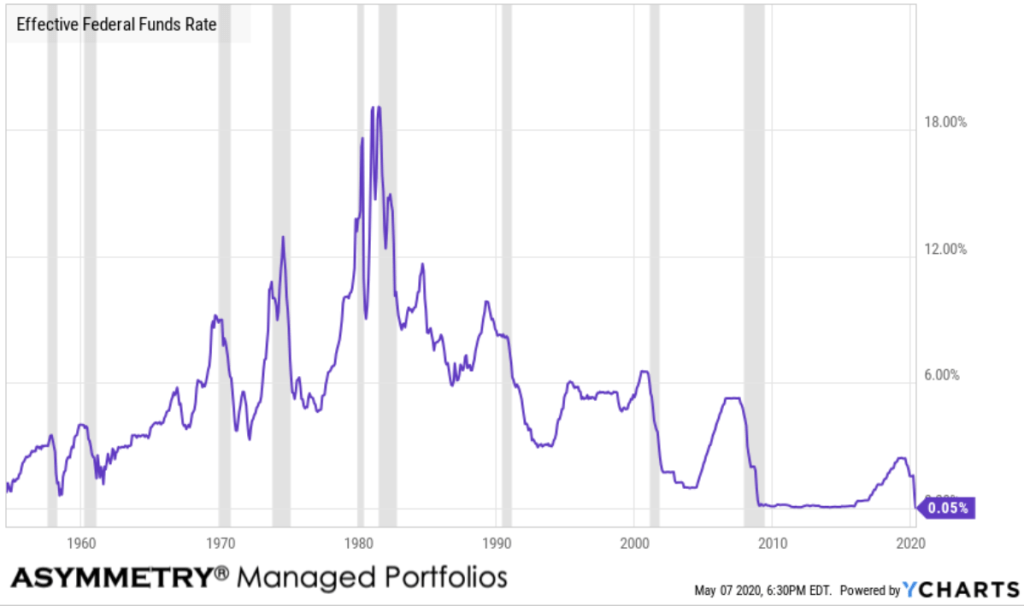

:max_bytes(150000):strip_icc():format(webp)/what-is-a-cognitive-bias-2794963_V1-a96938160eea438cb3b5e2ed9f20cee0.png)
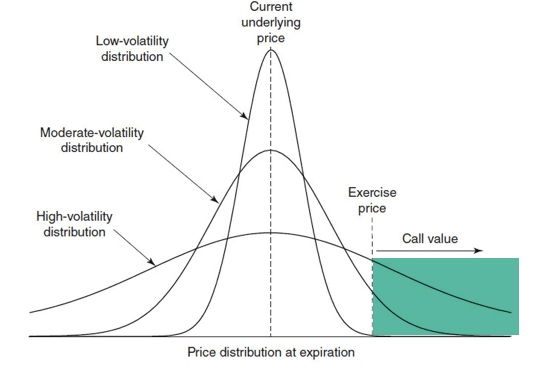
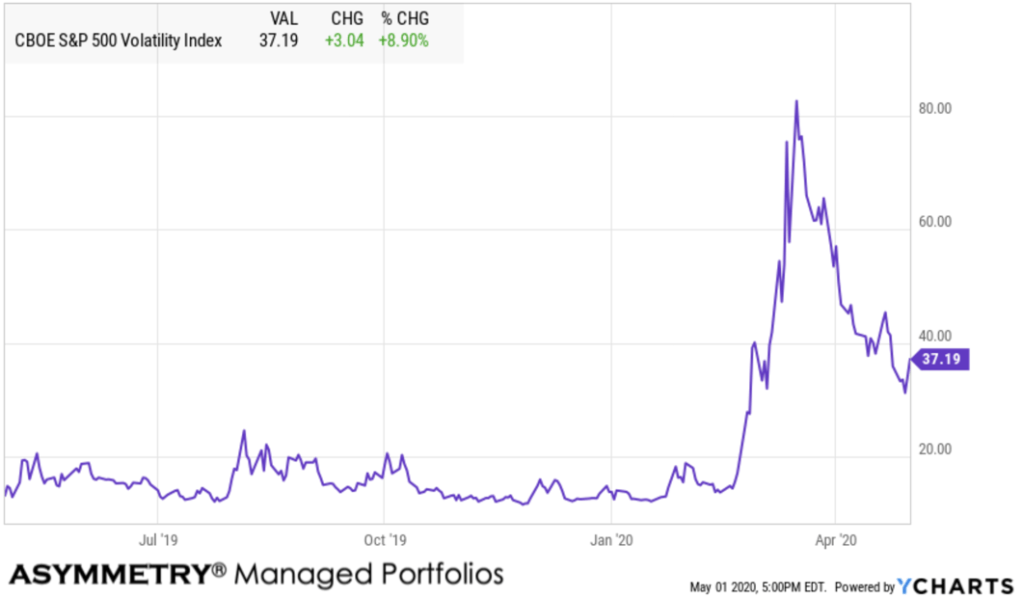
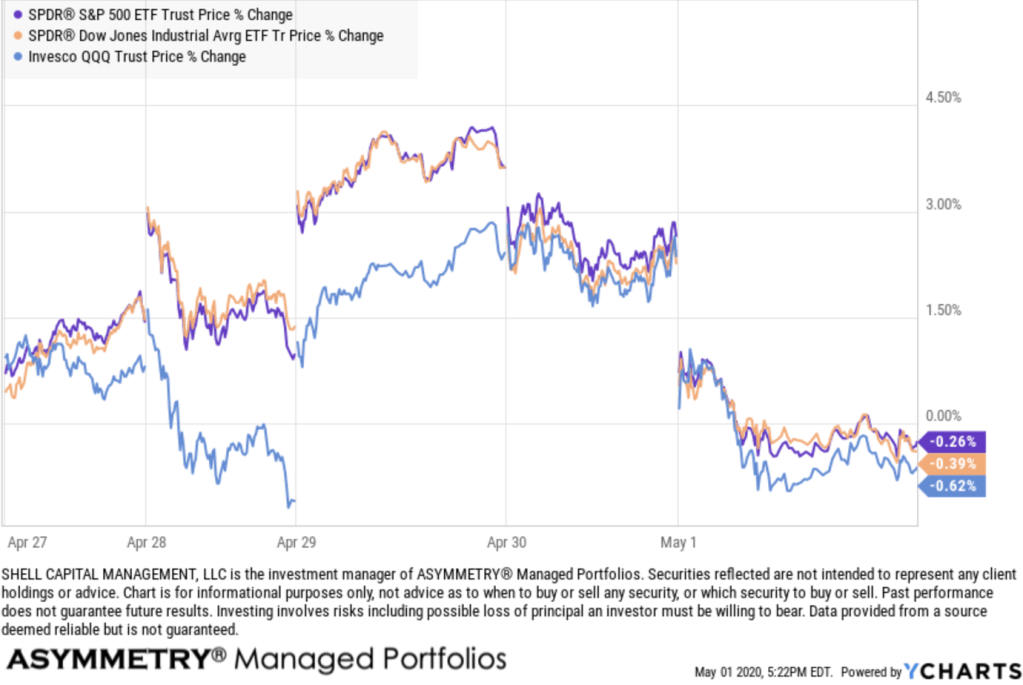

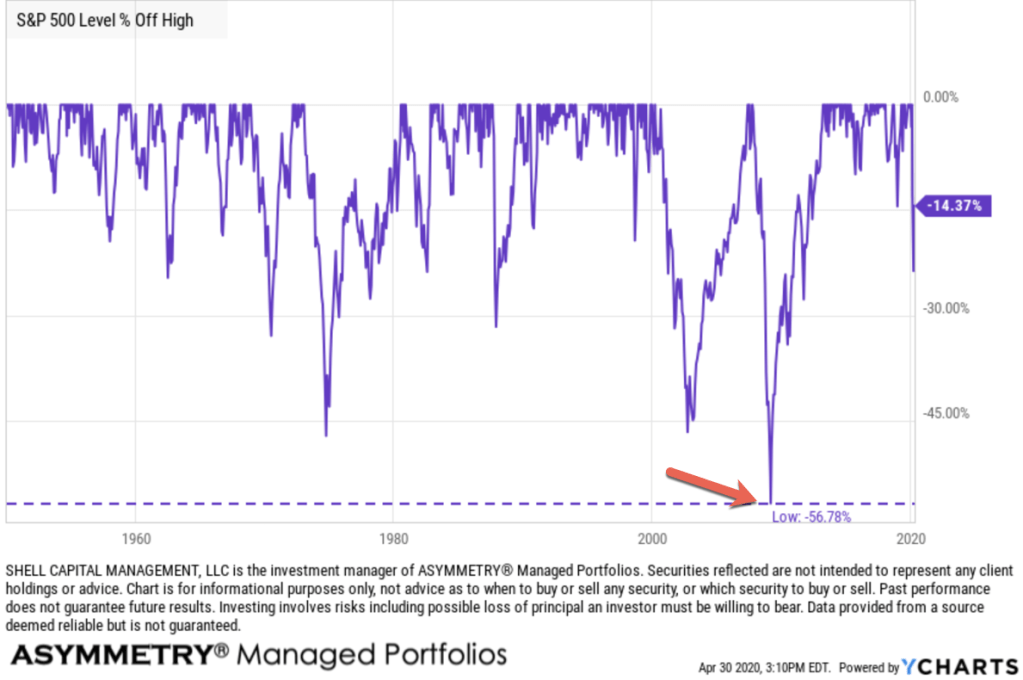
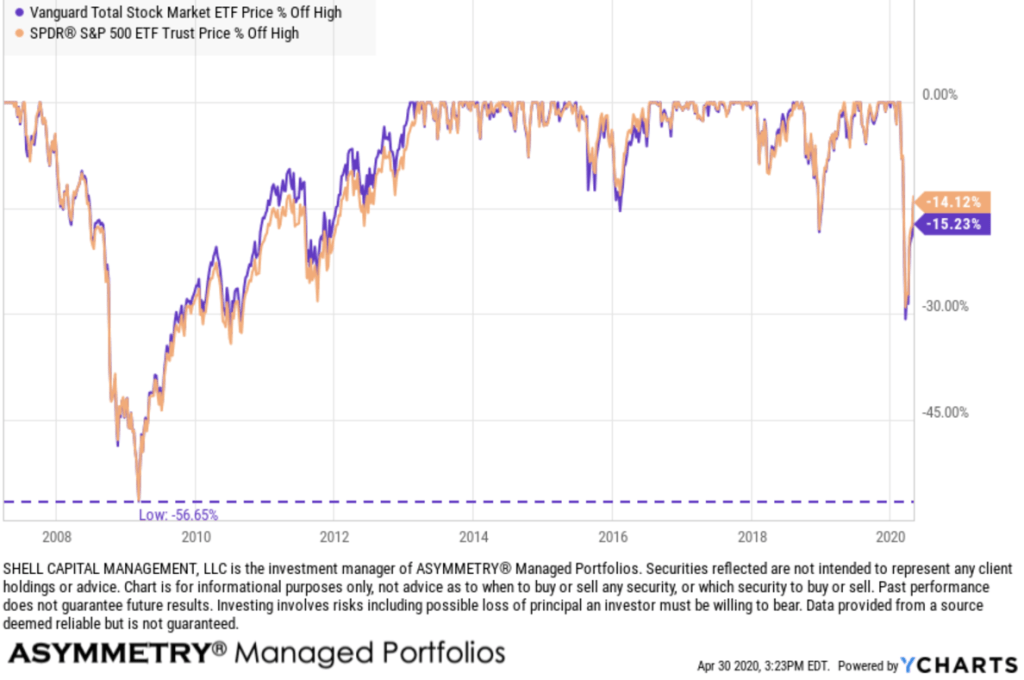
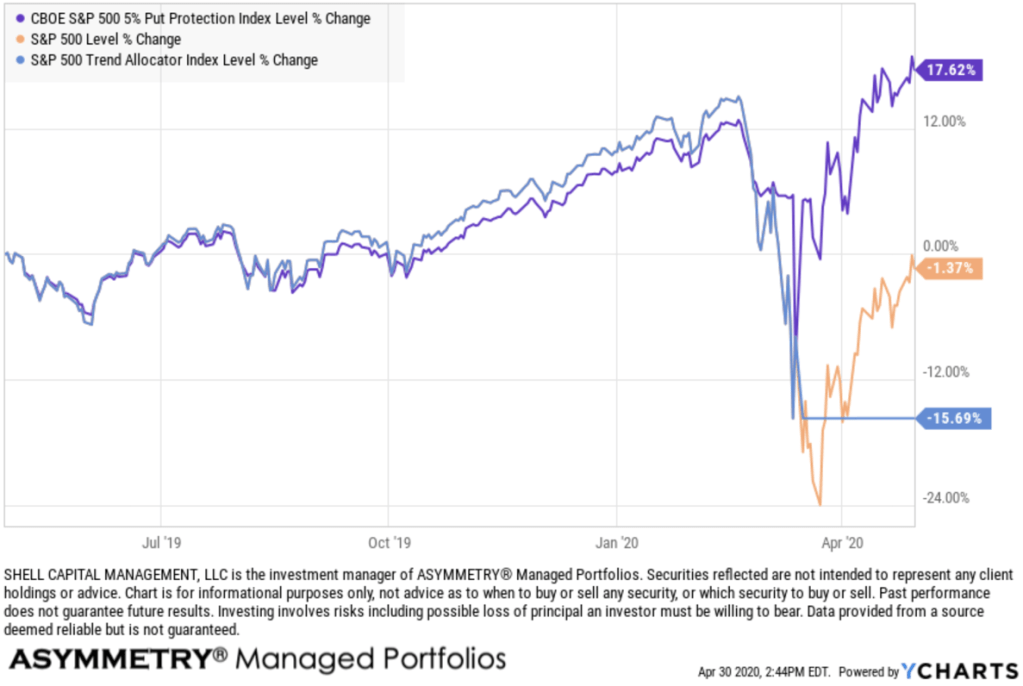
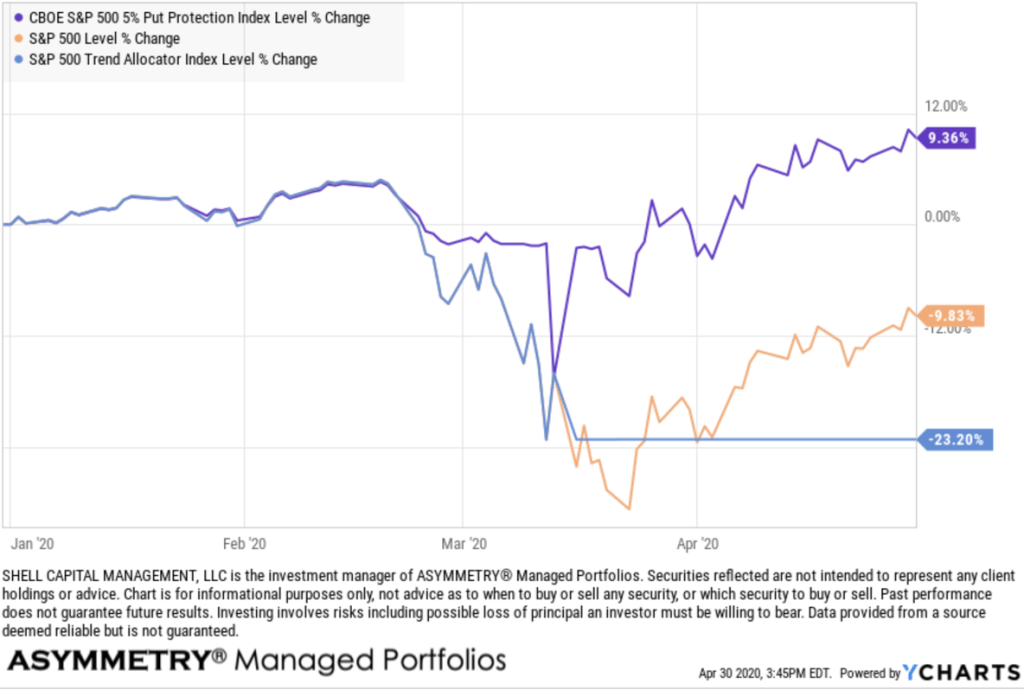
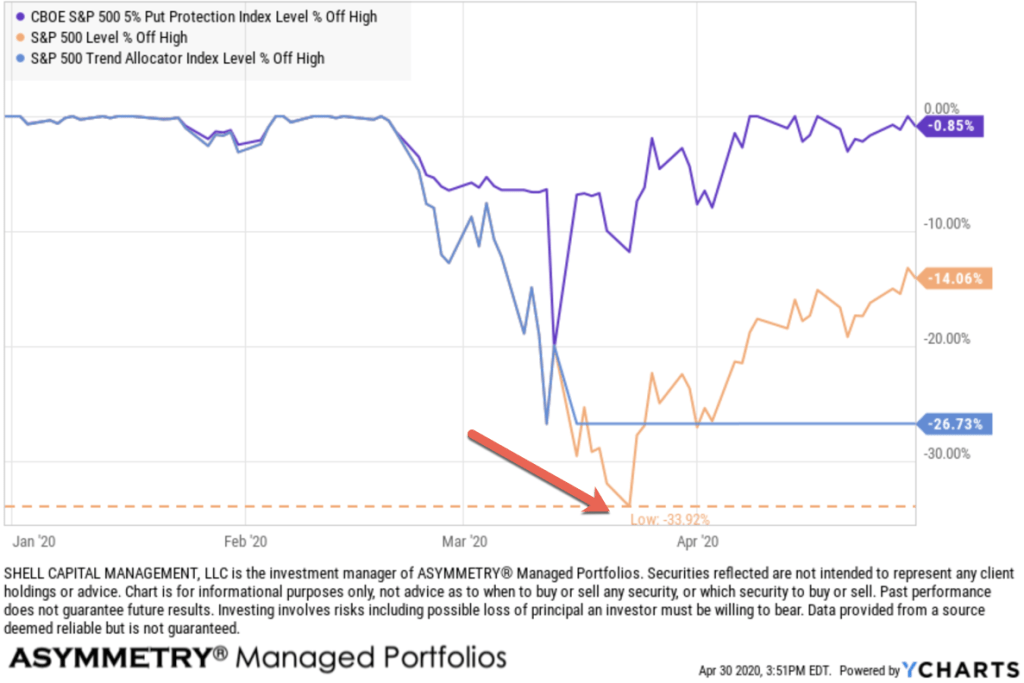
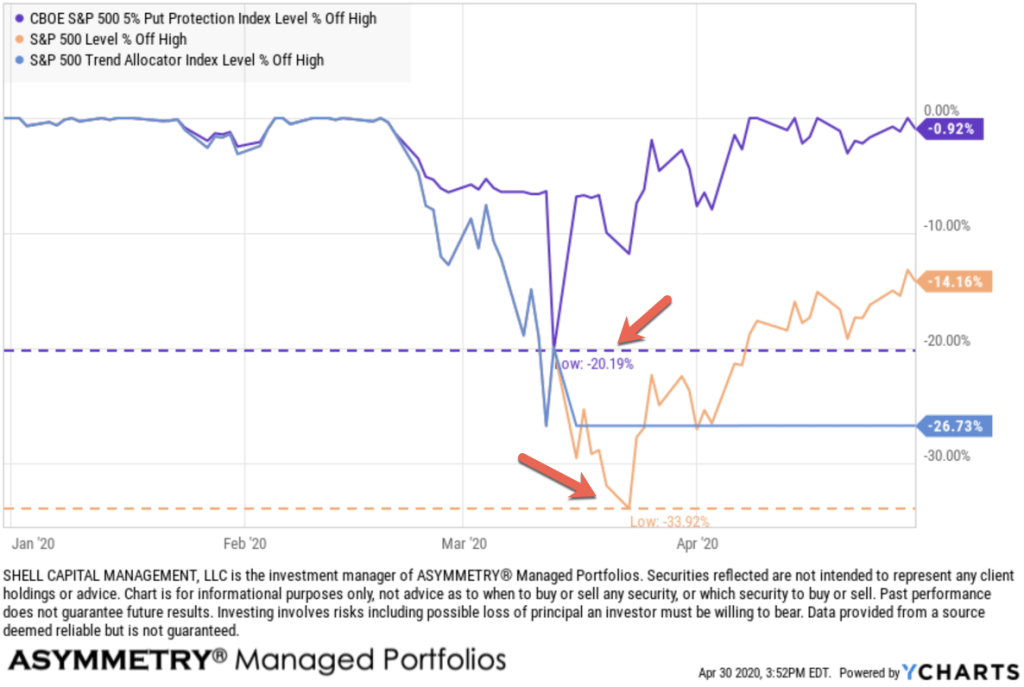
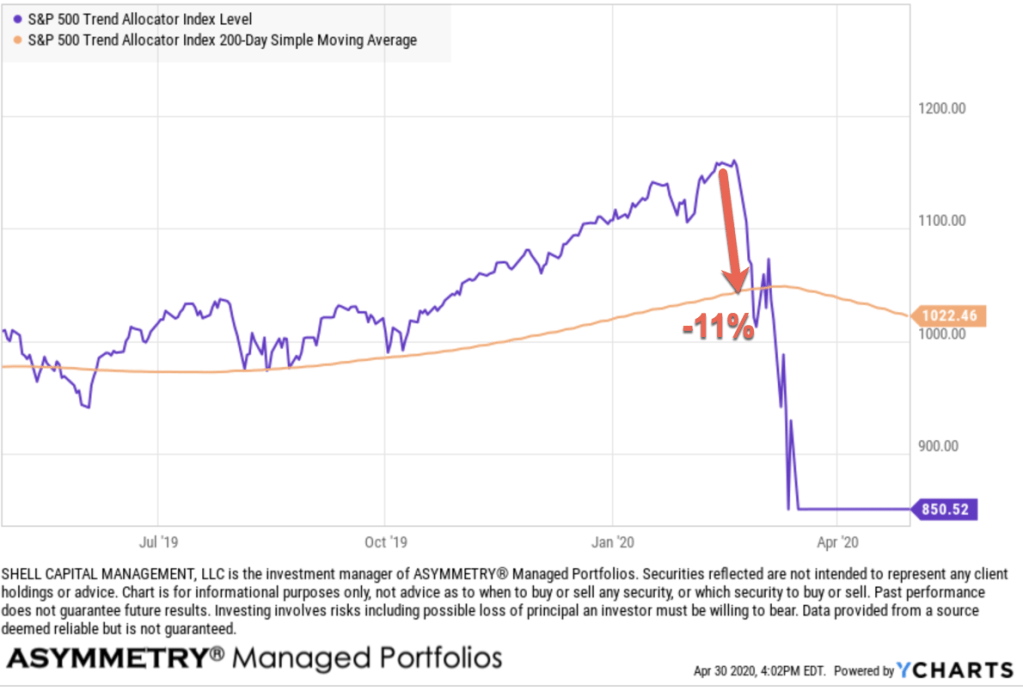
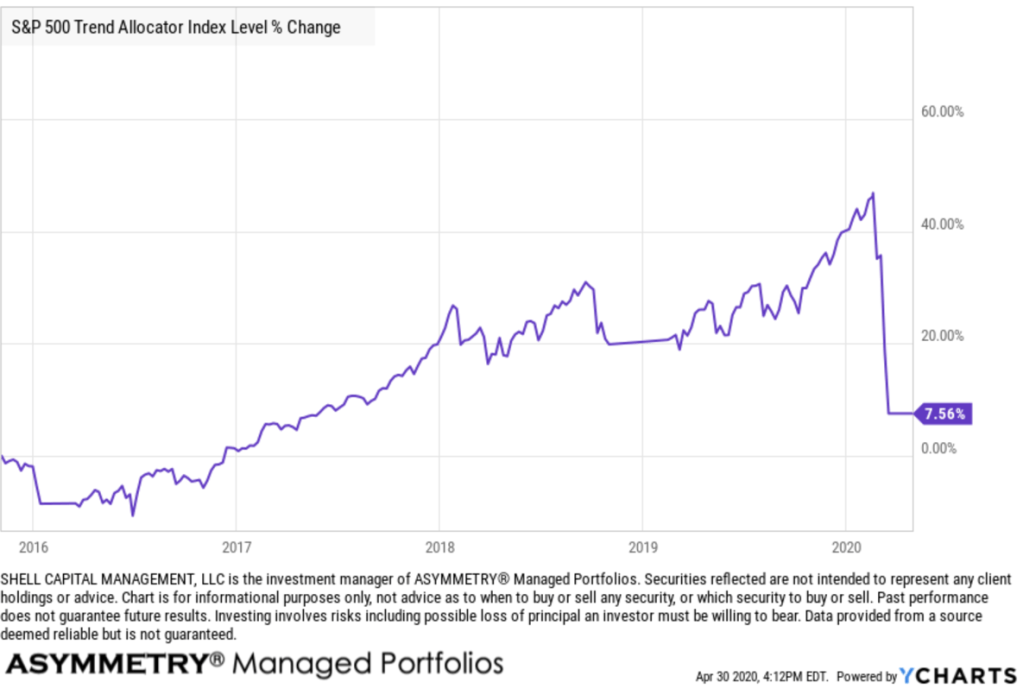
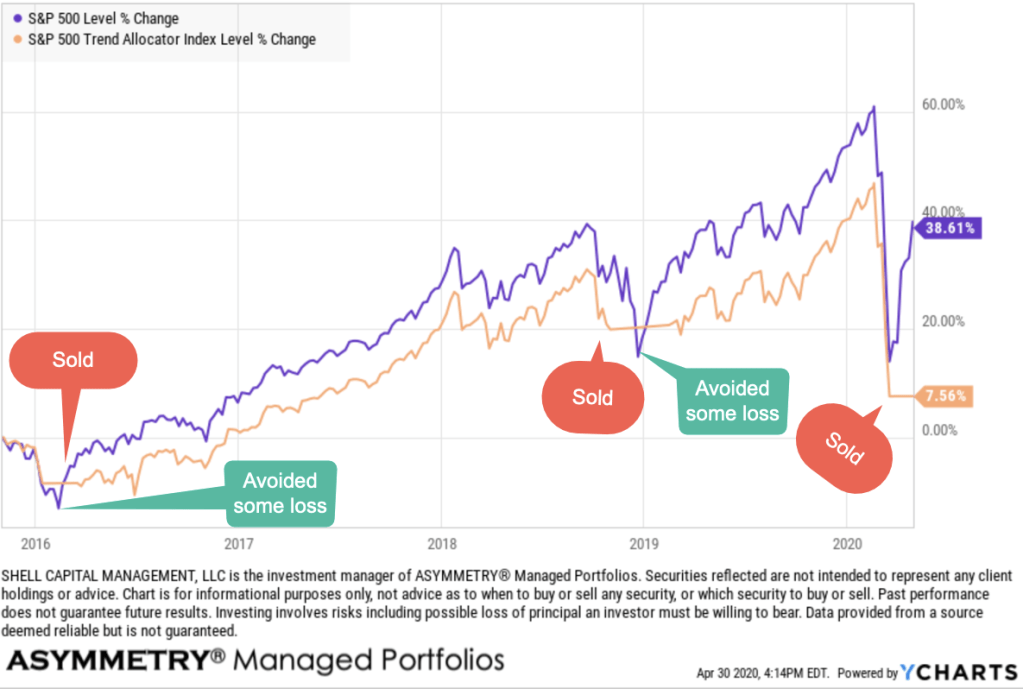
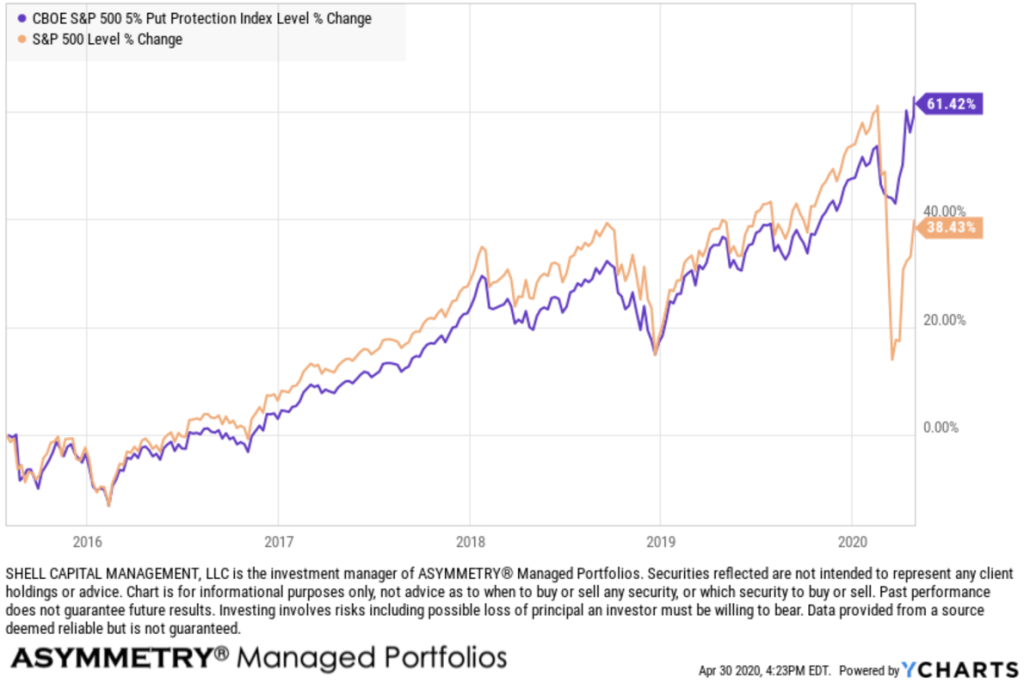

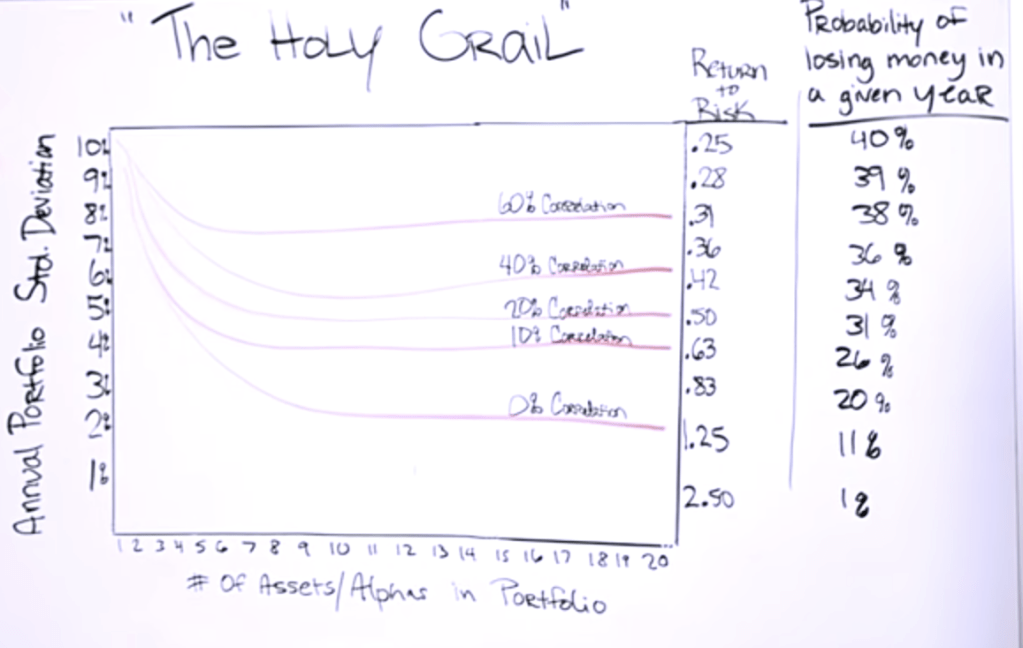
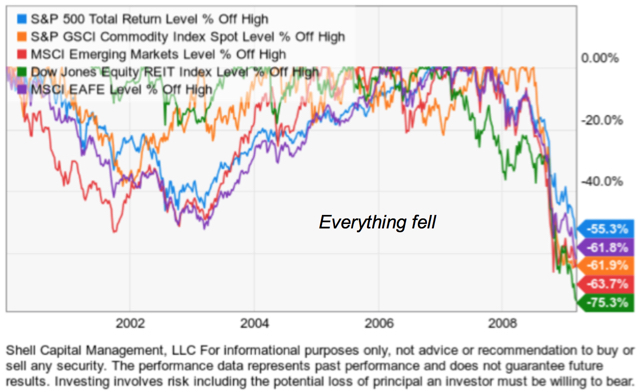
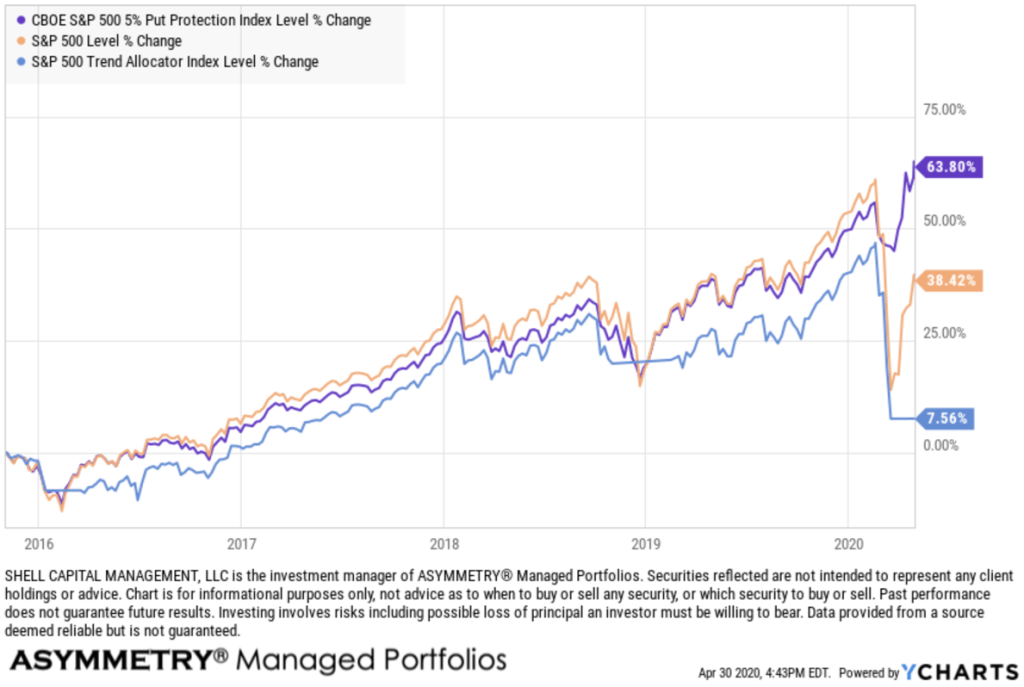
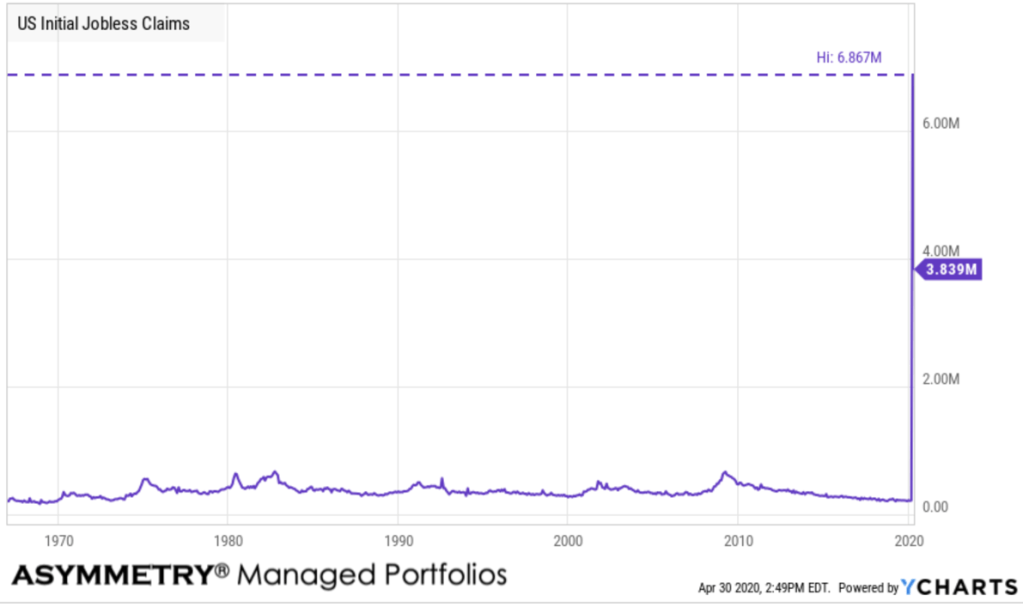
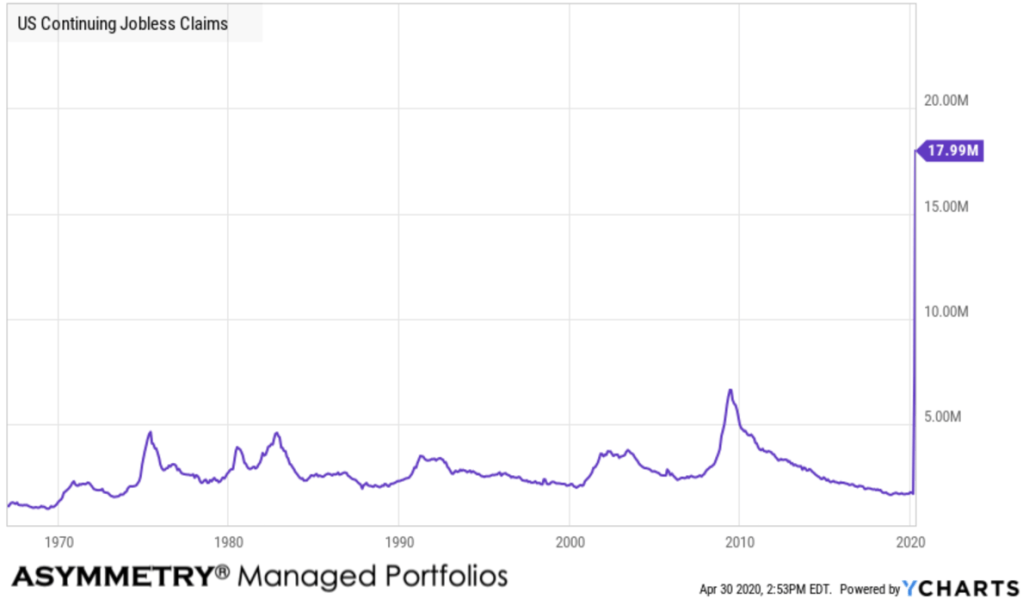

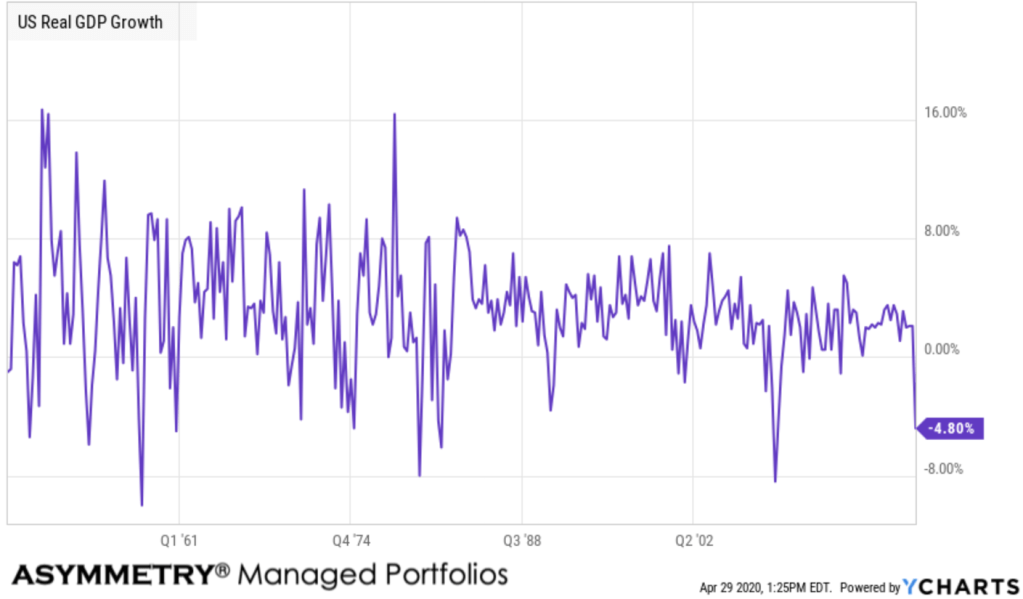

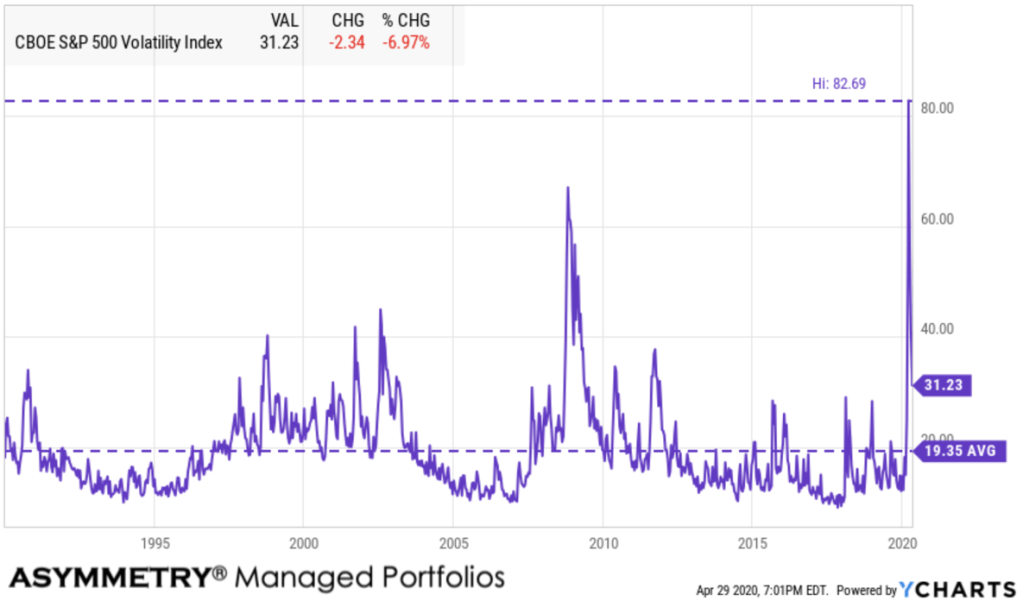
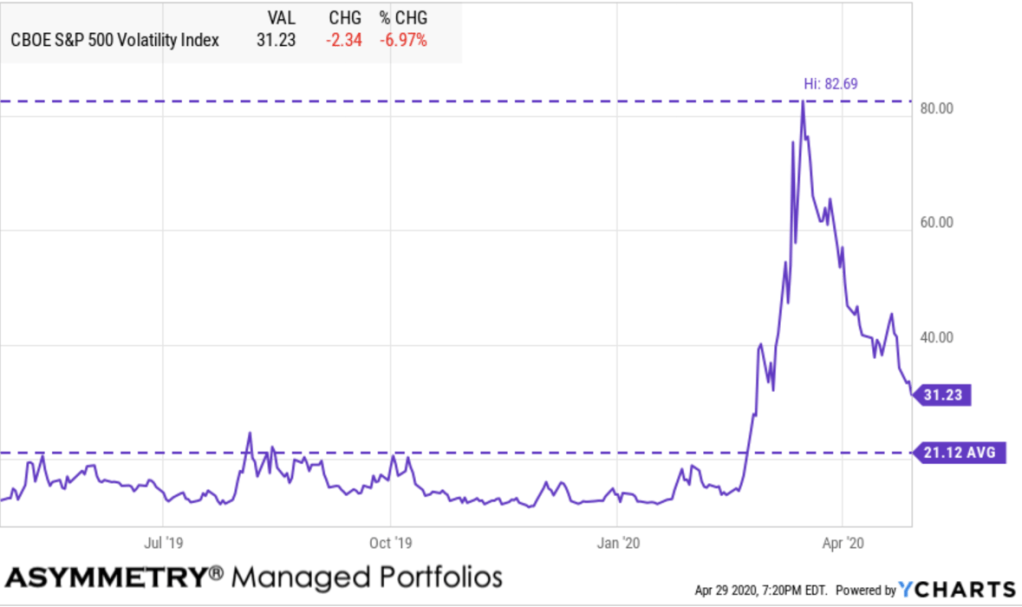
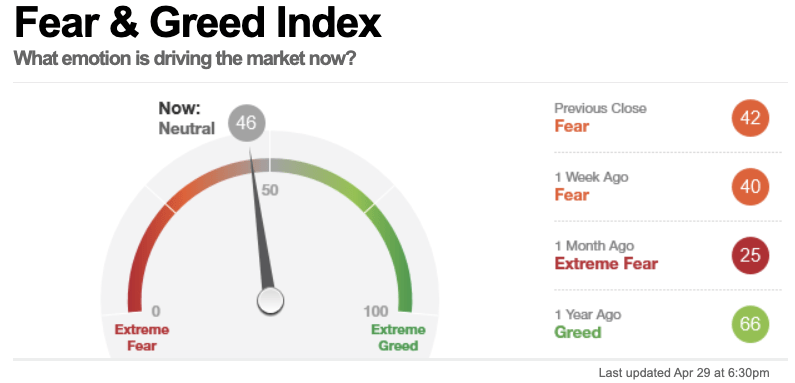


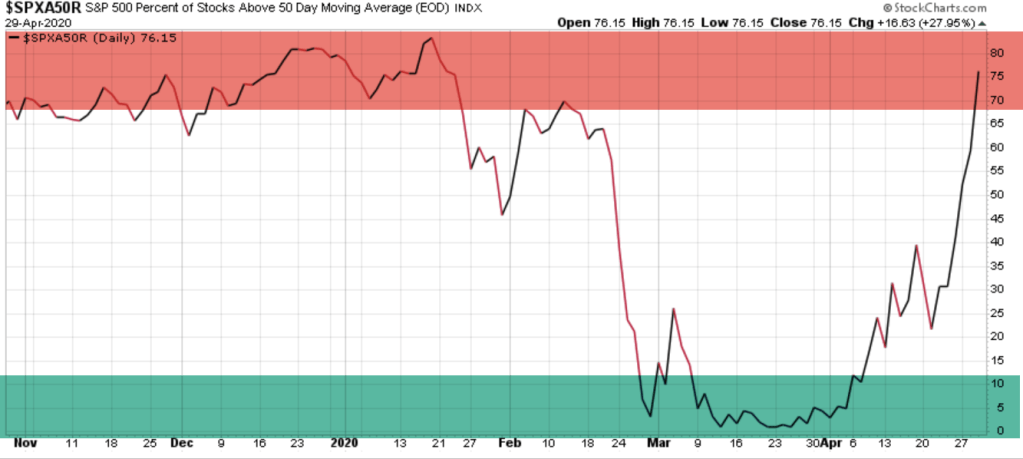
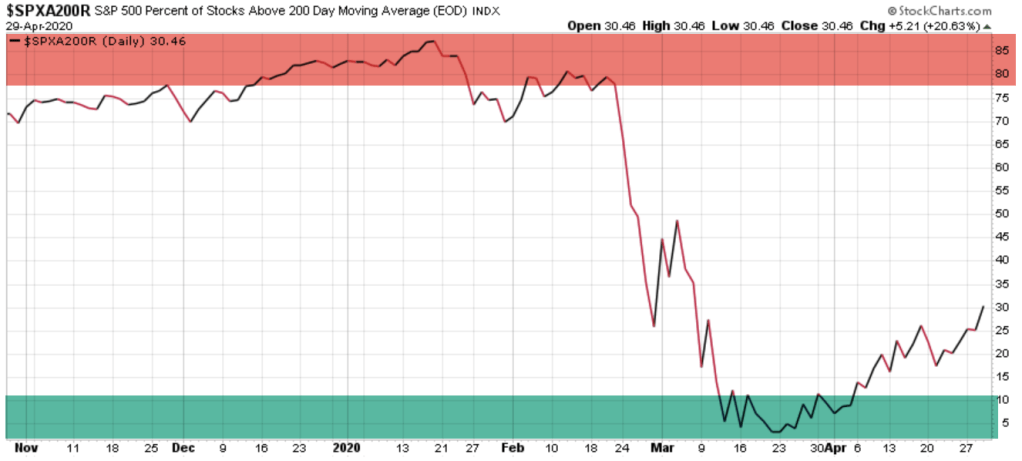
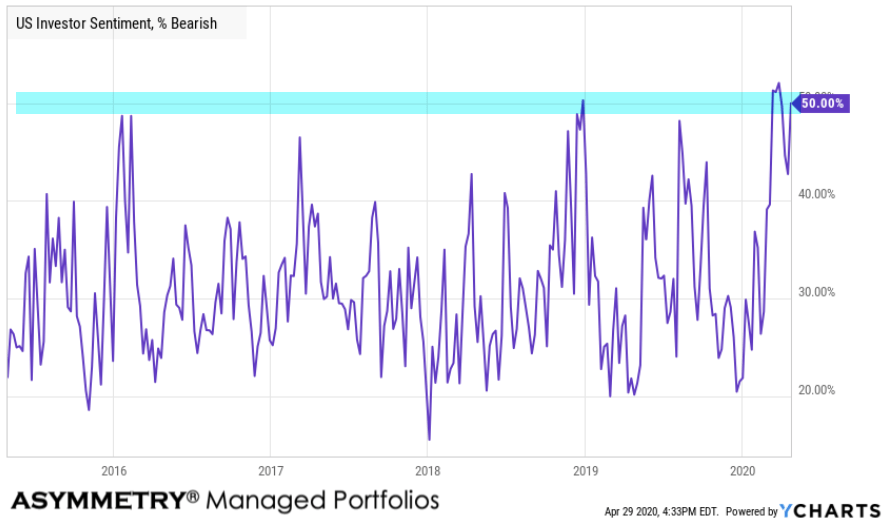
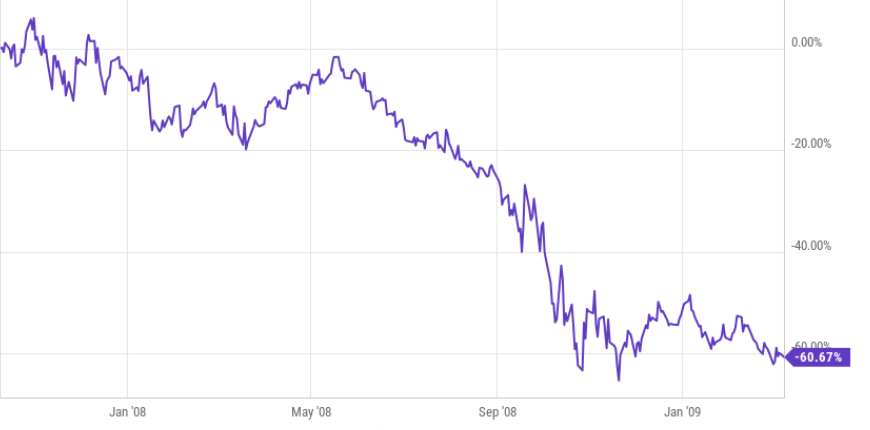
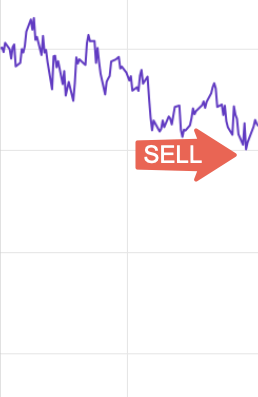
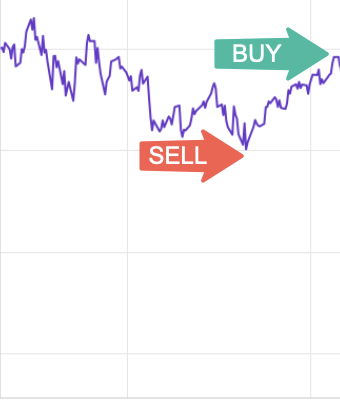
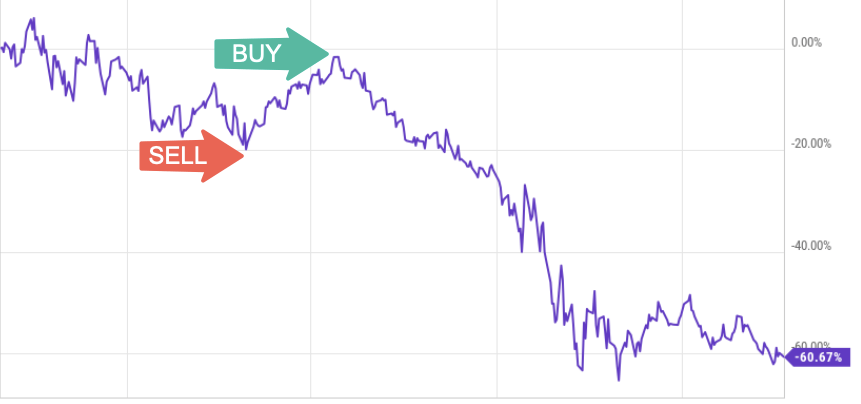
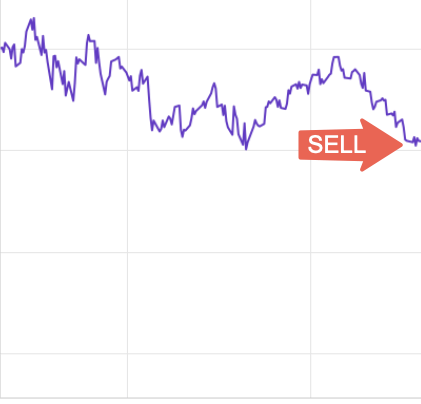
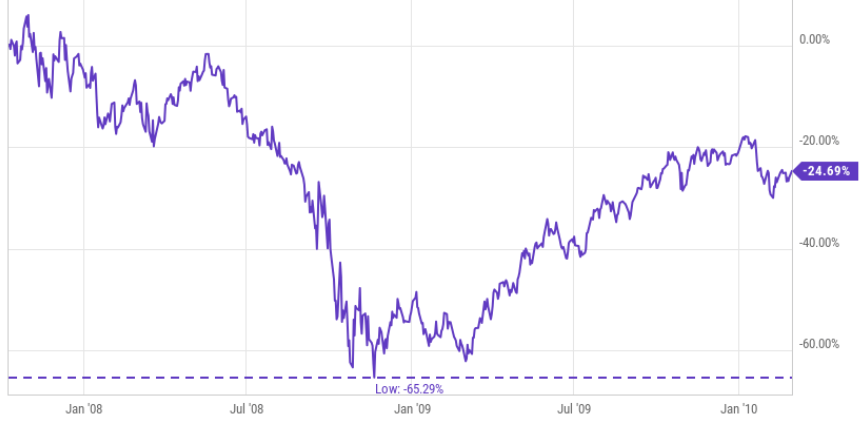
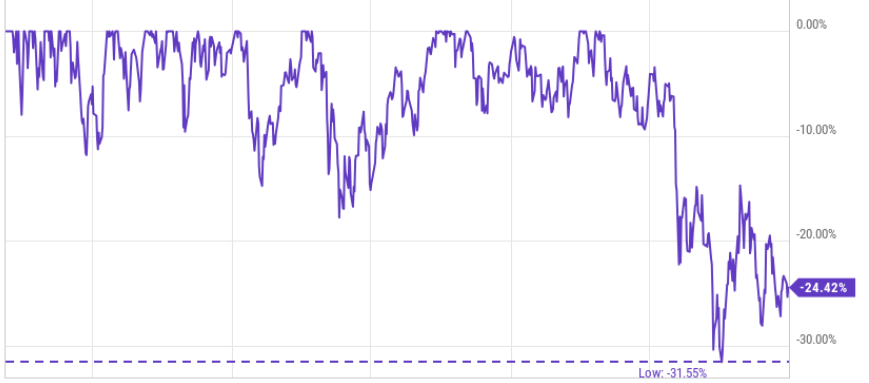
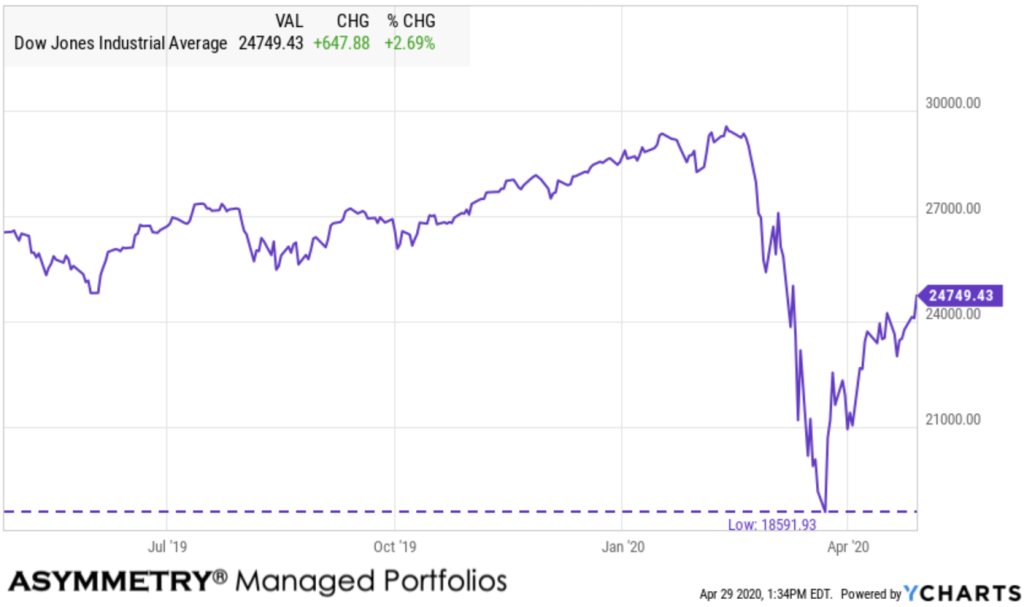
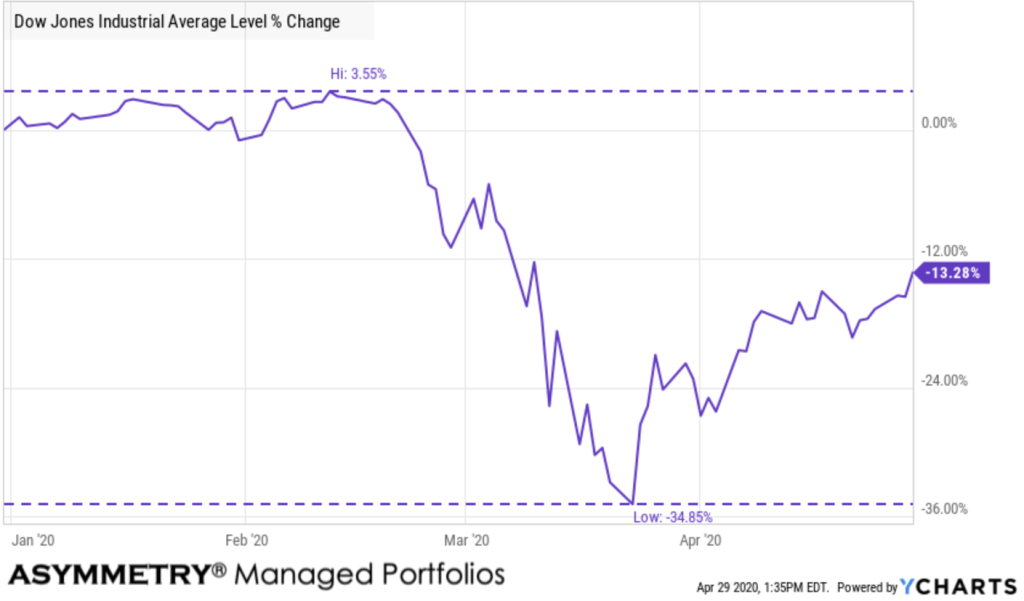
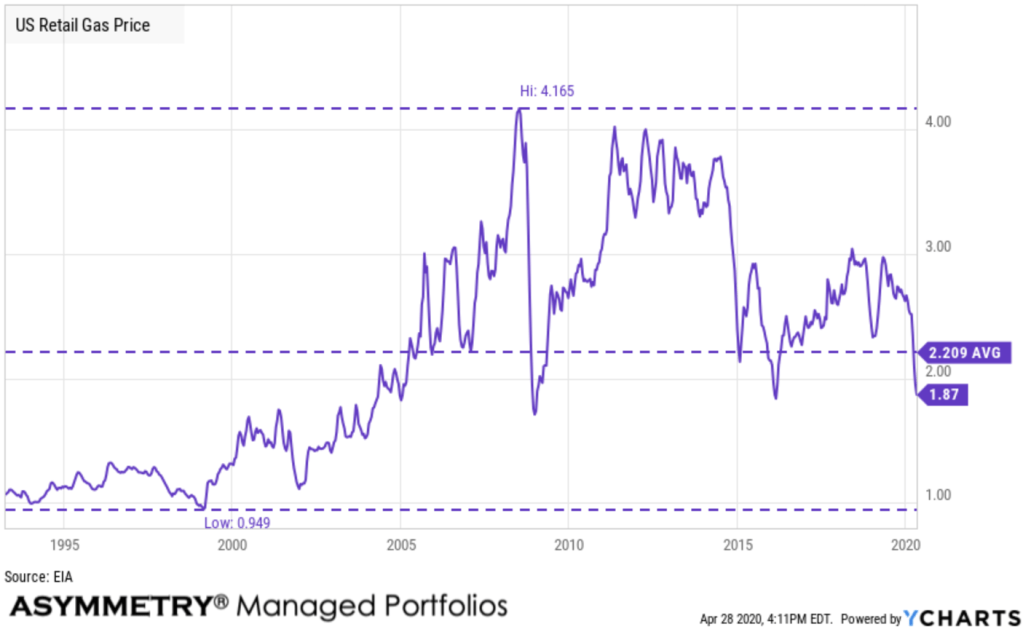
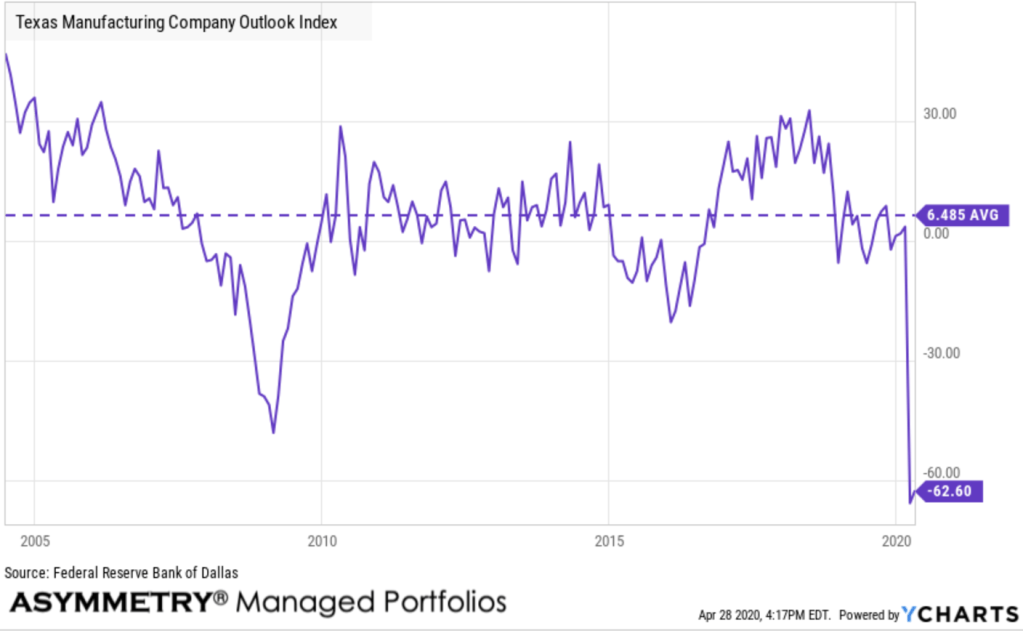
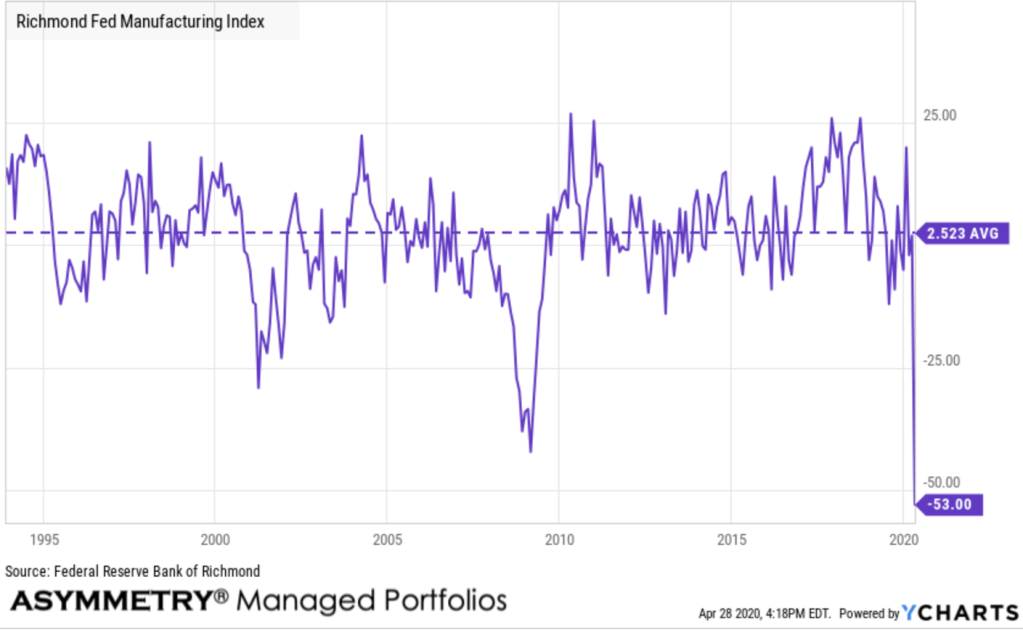
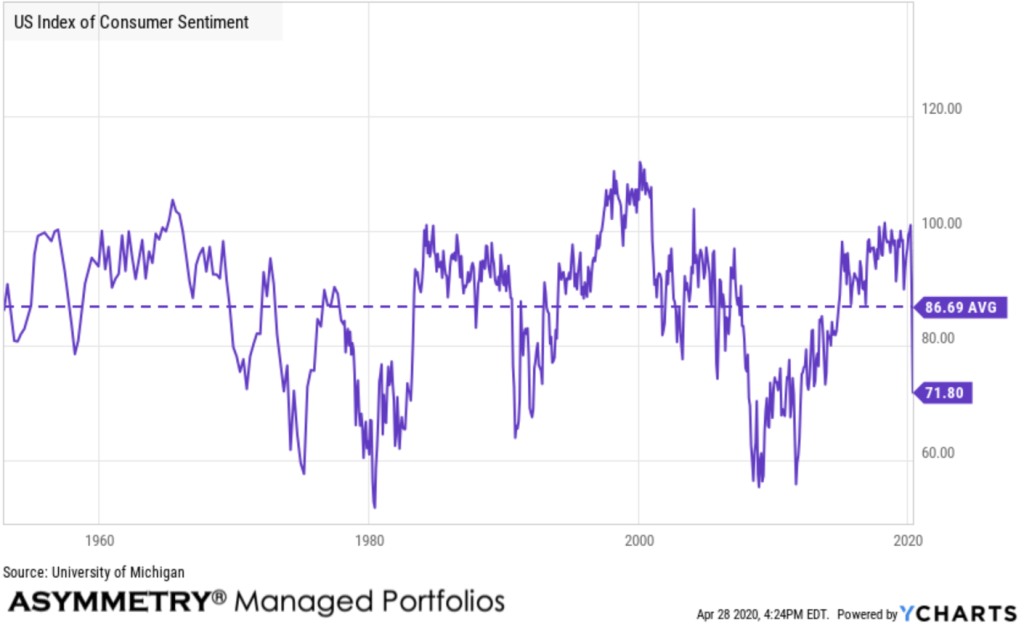
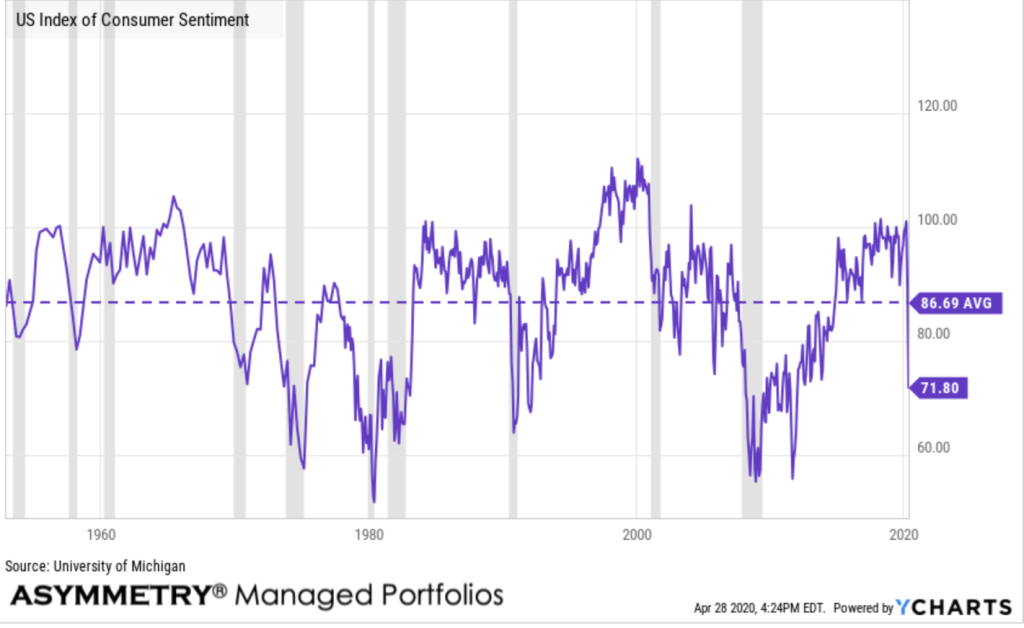
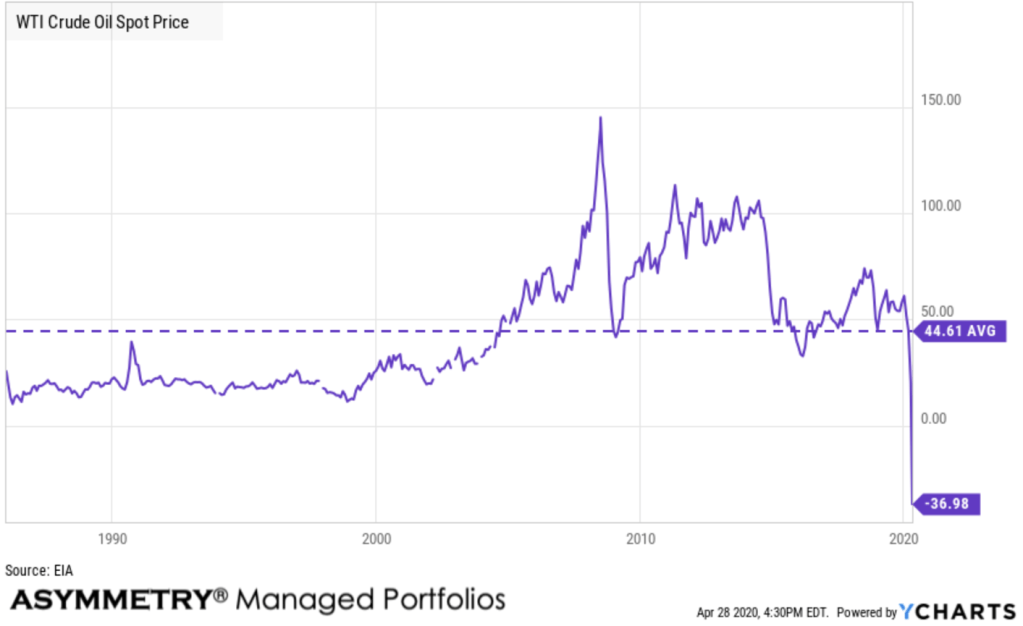
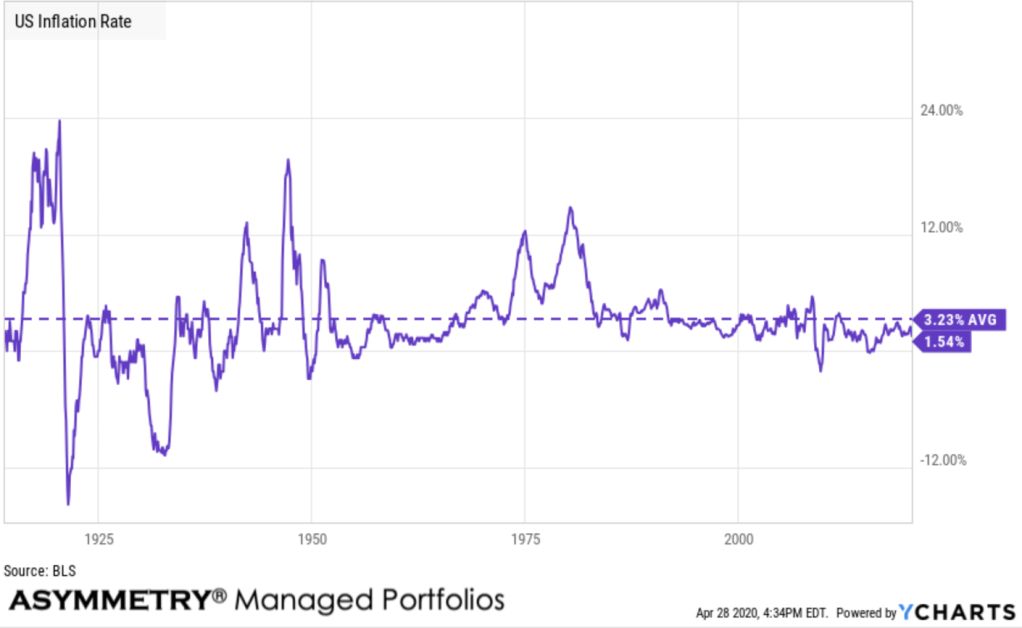
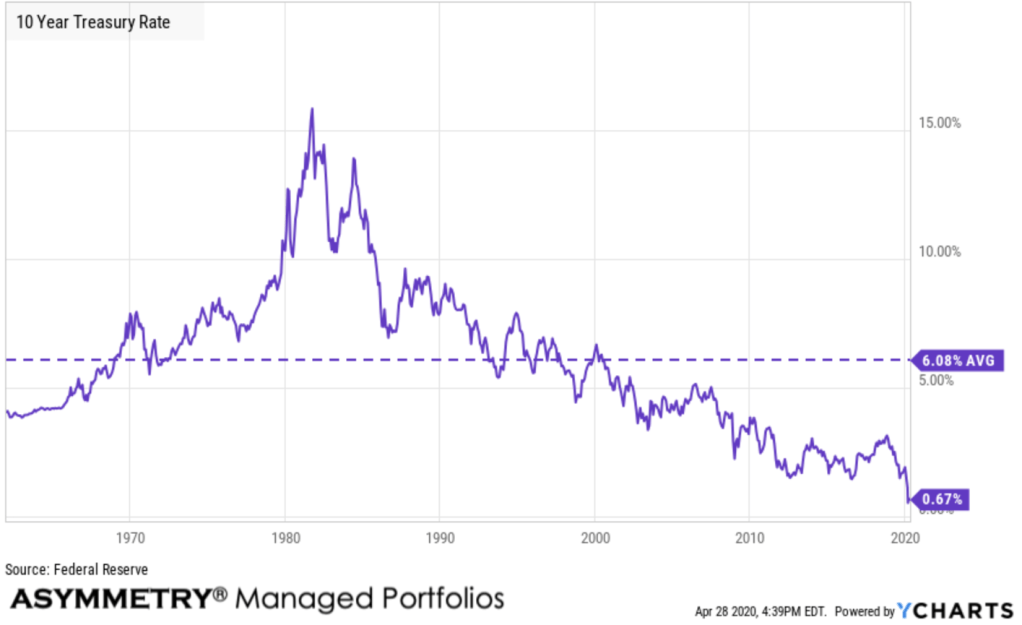
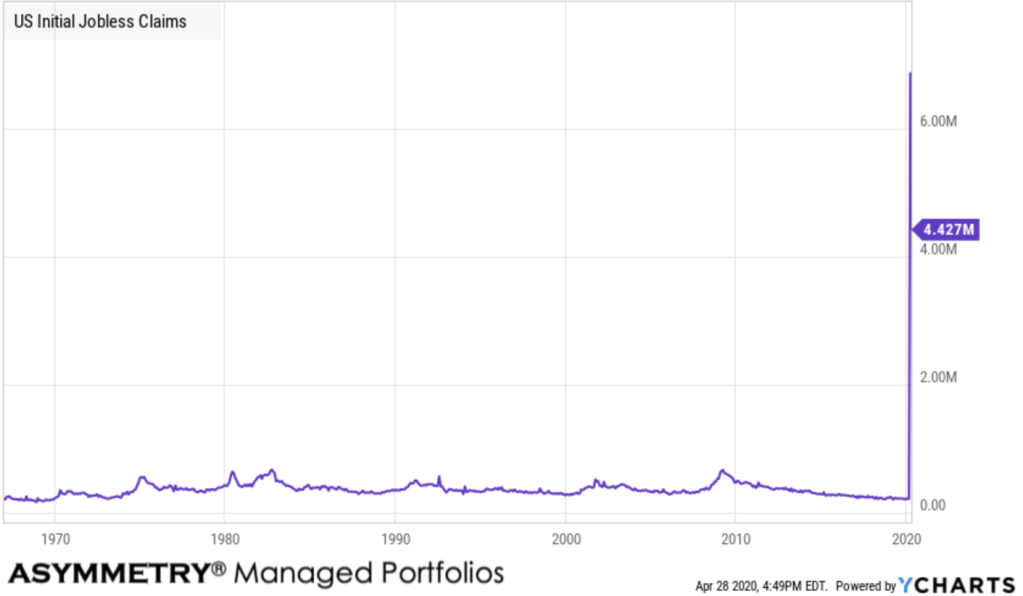
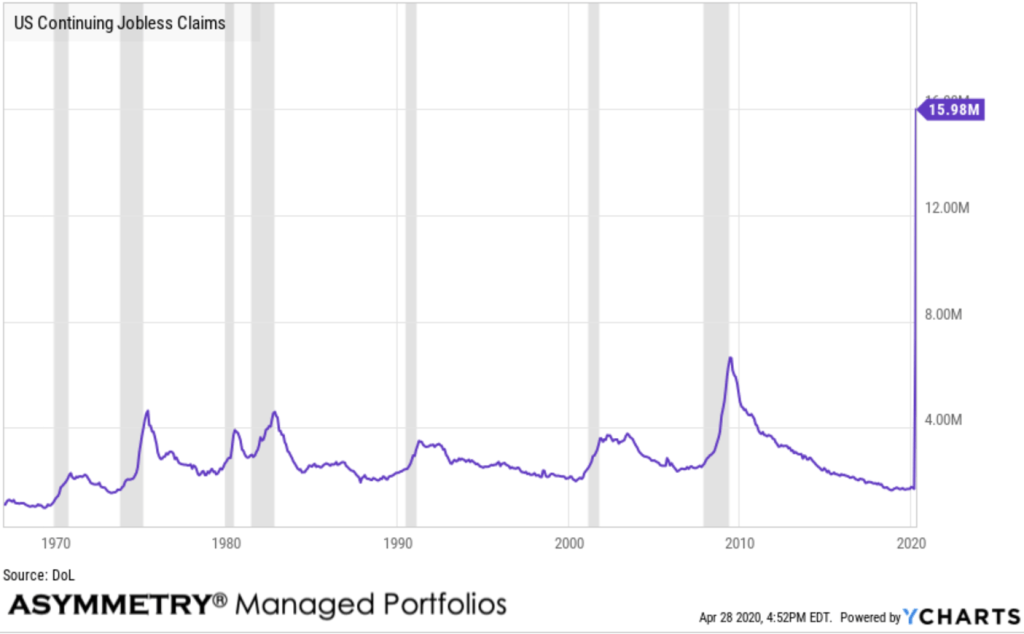
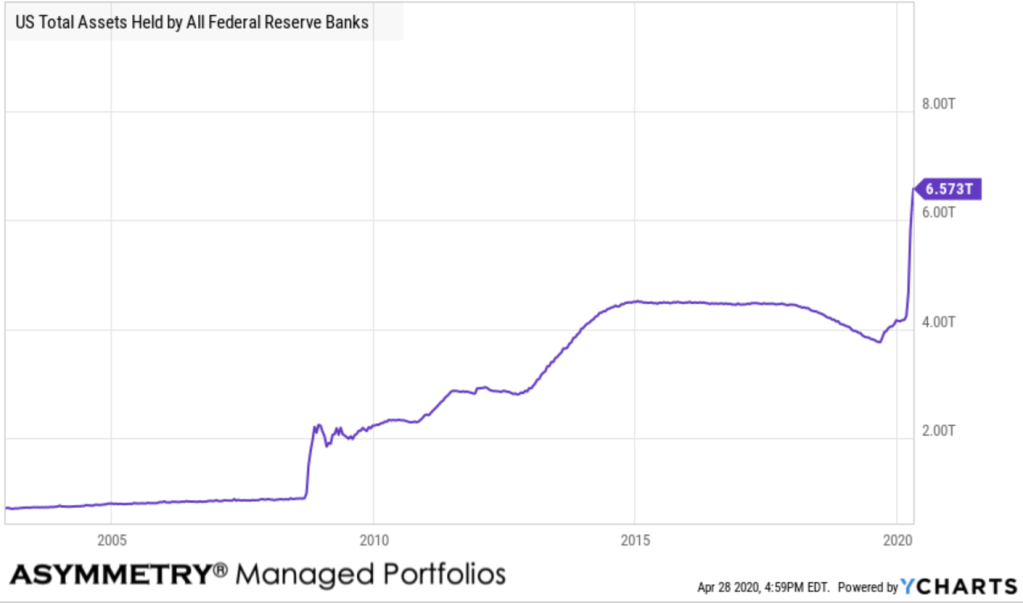
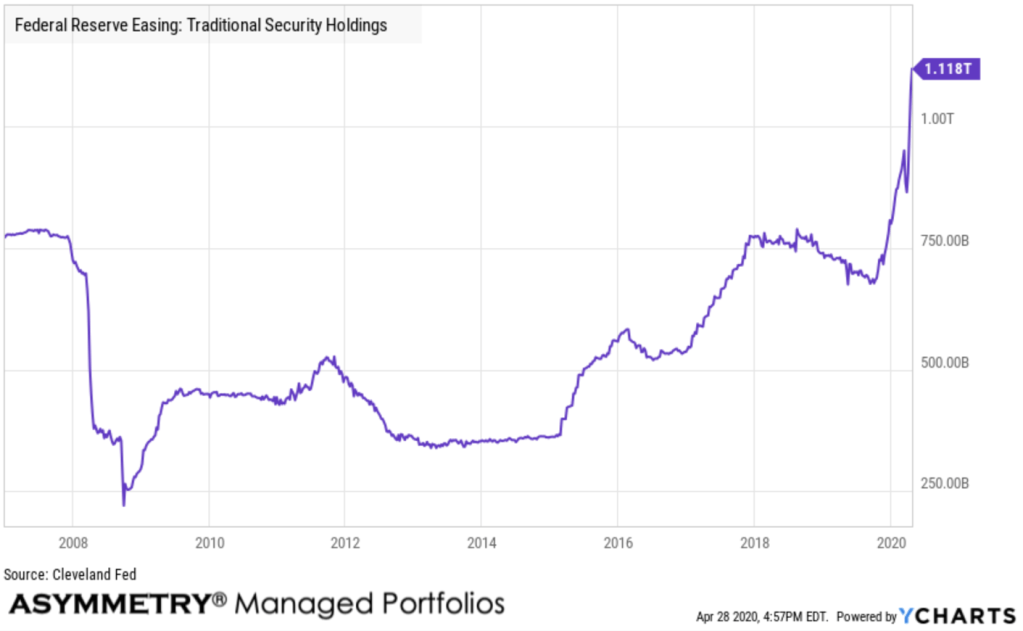
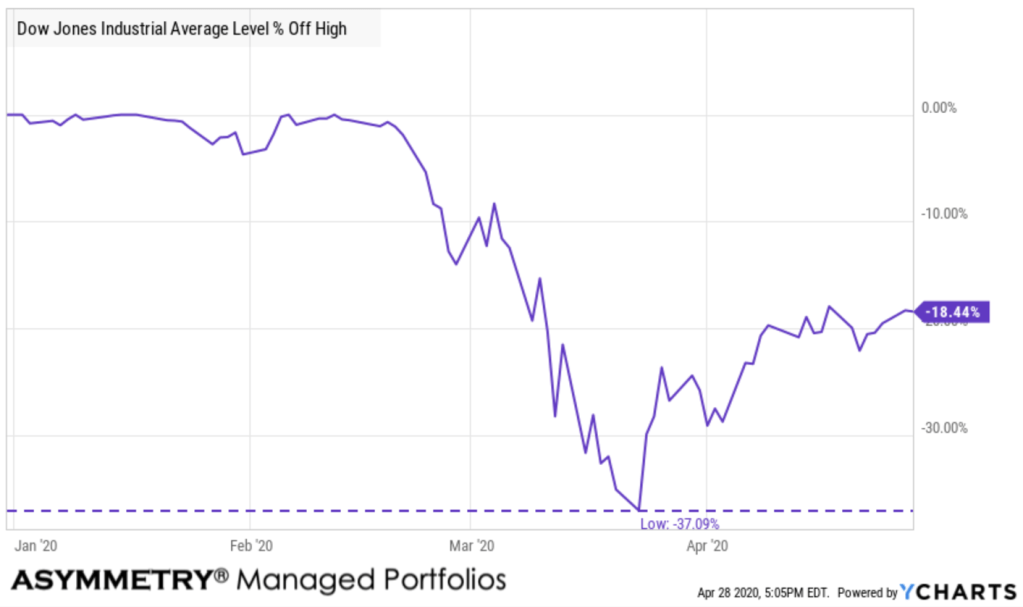
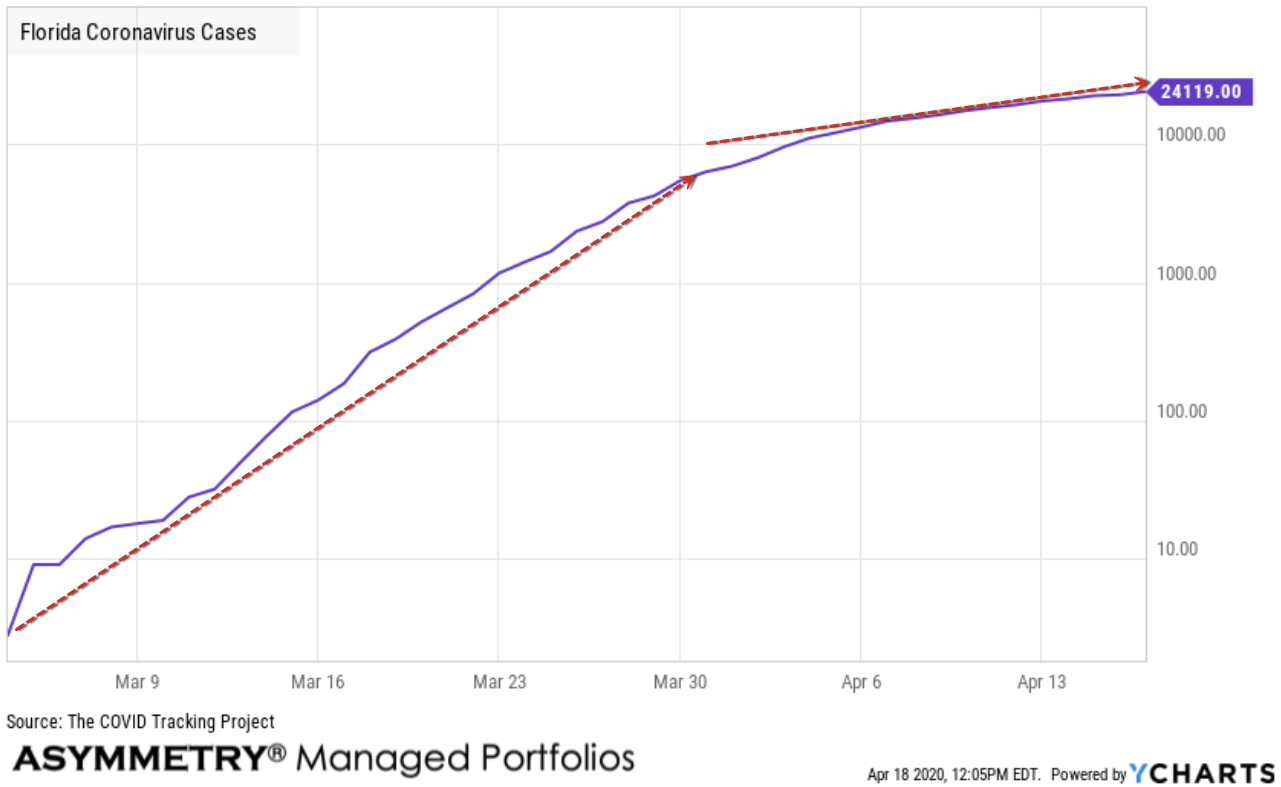
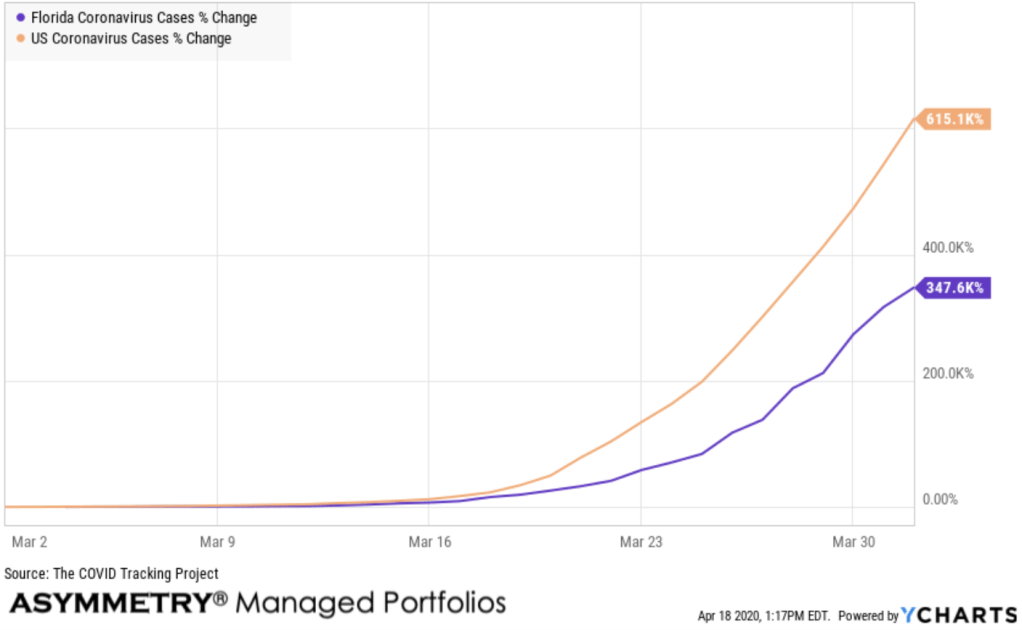
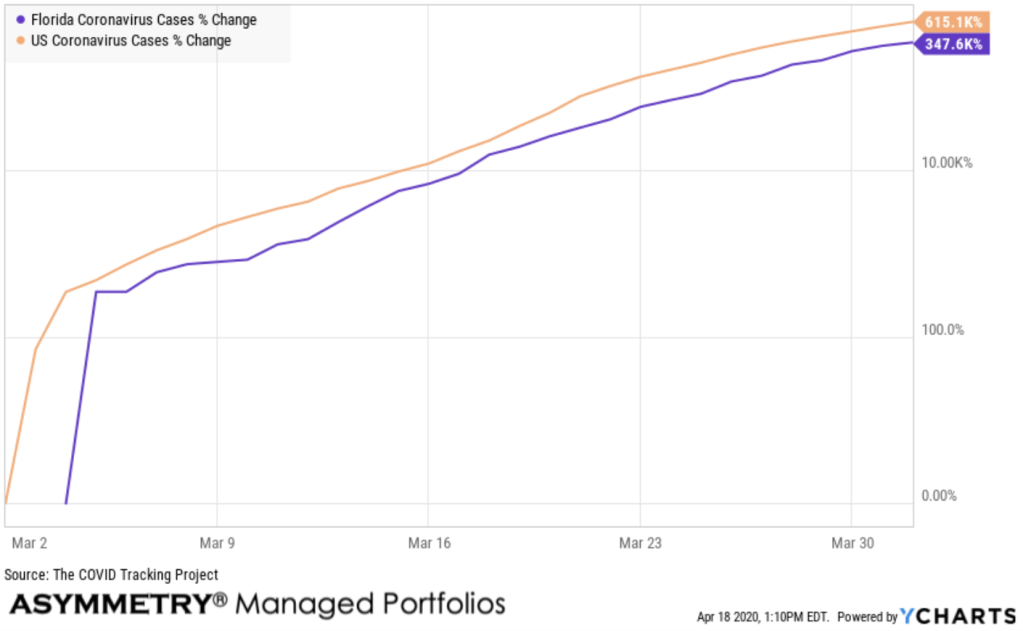
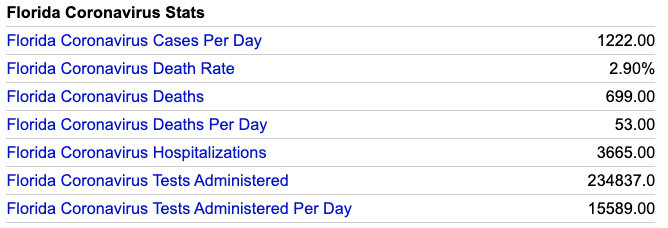
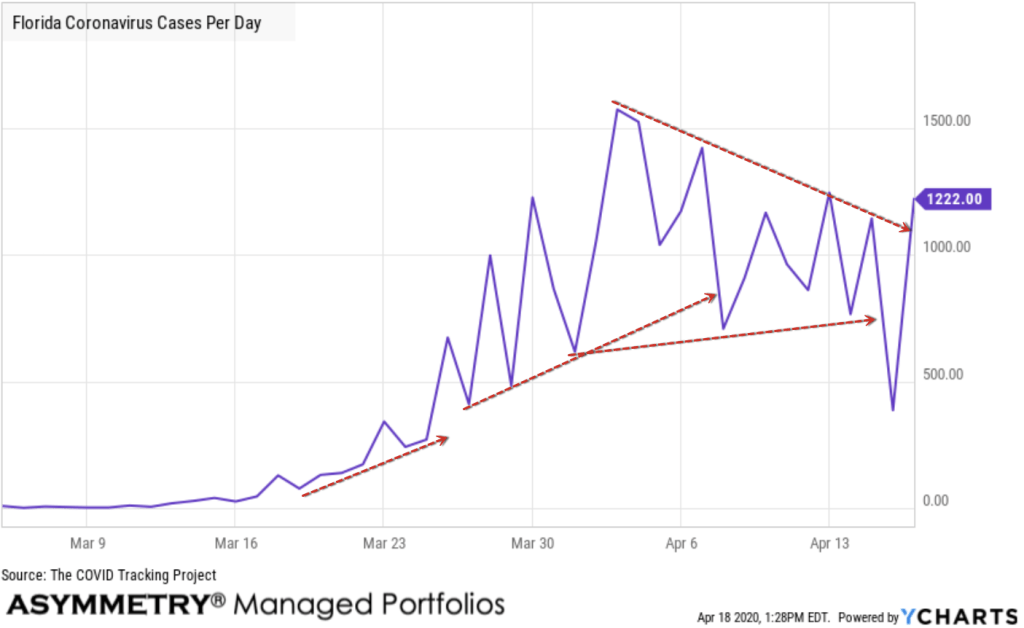
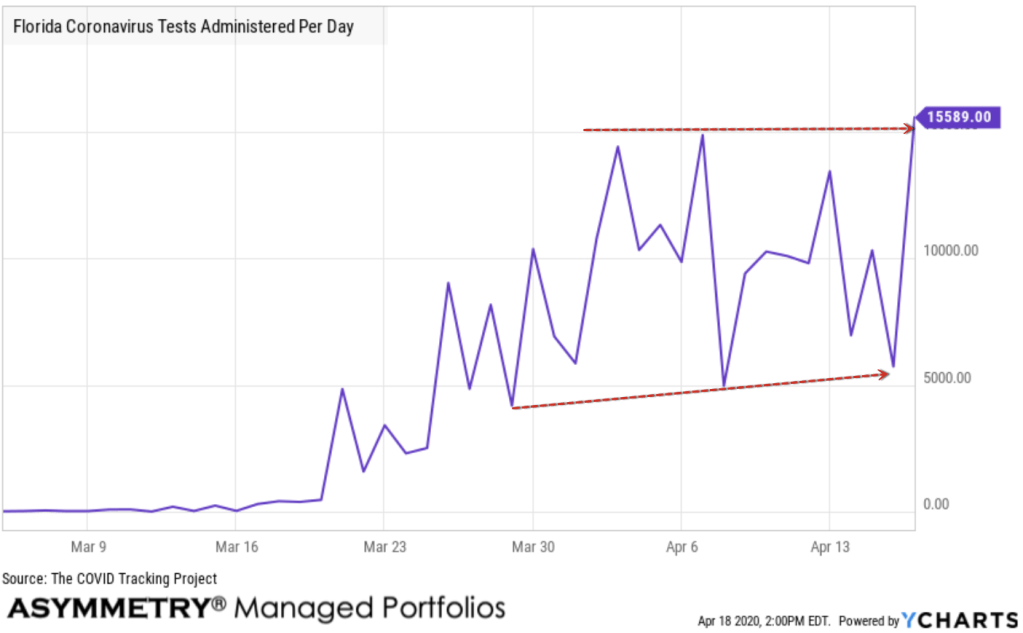
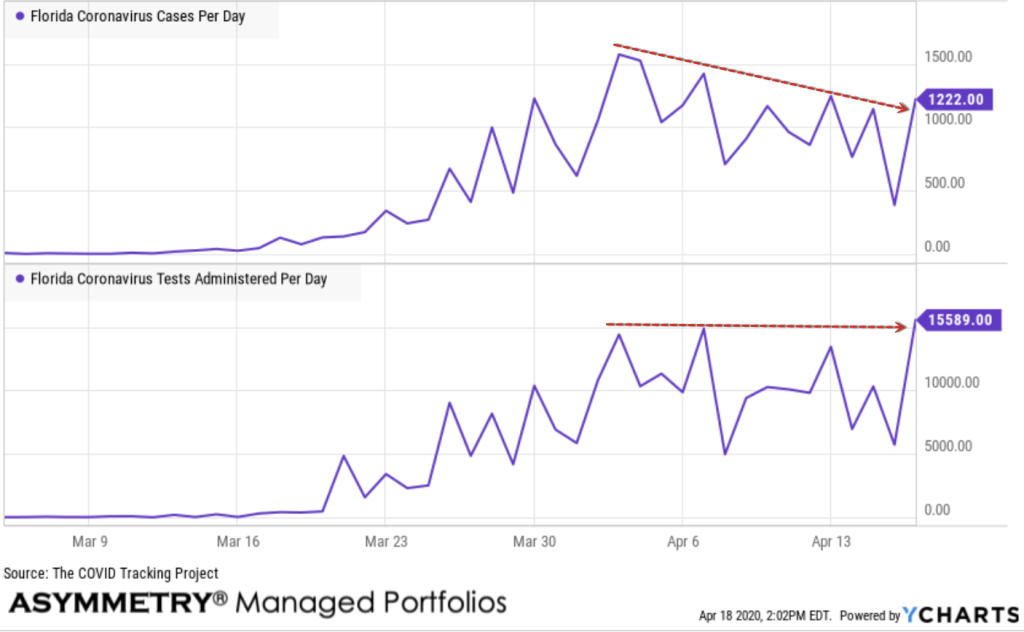
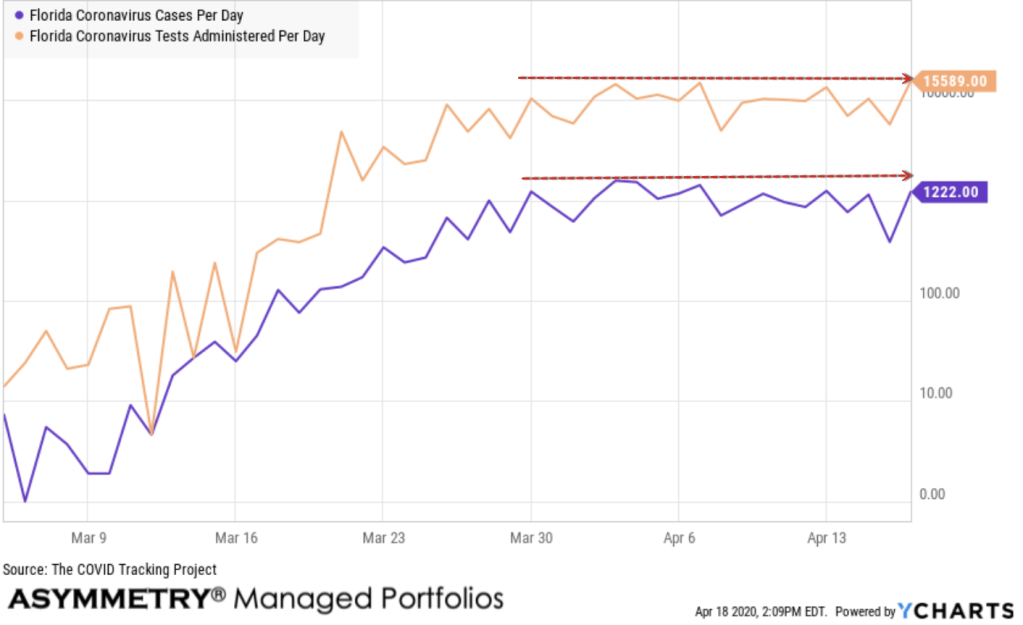
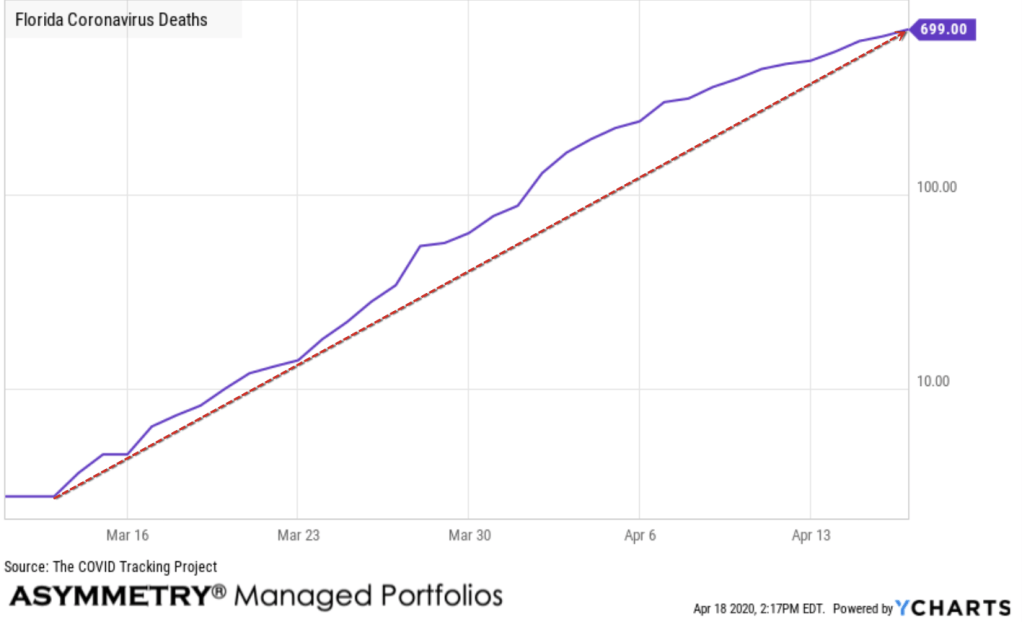
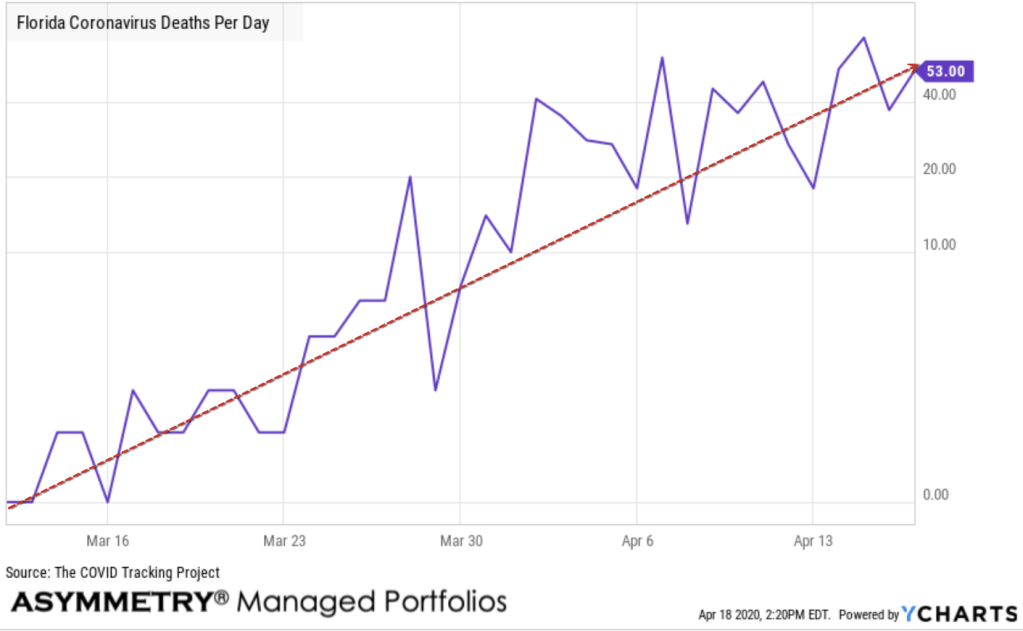
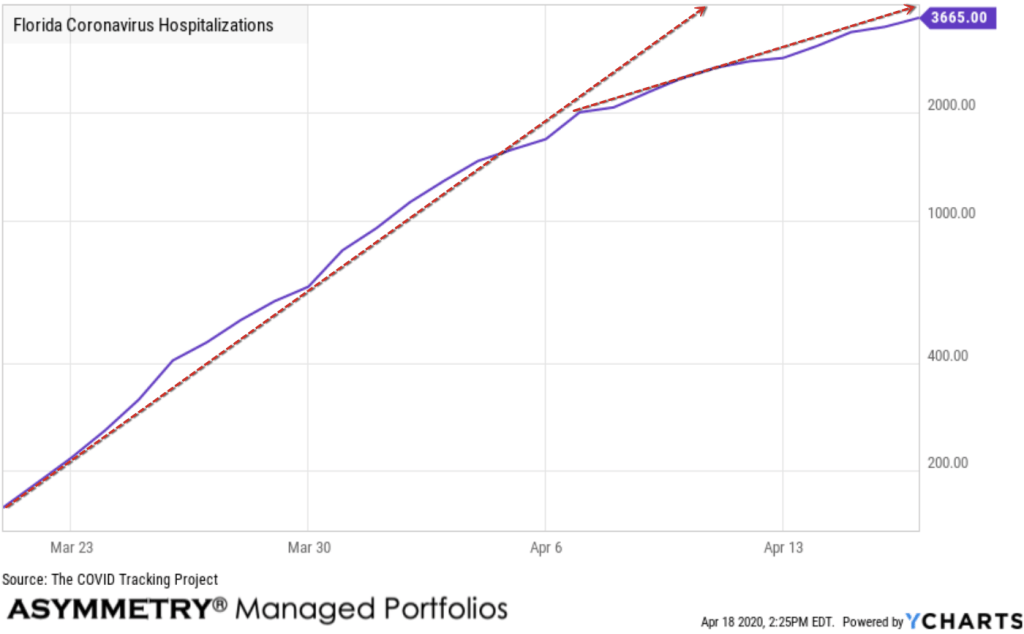
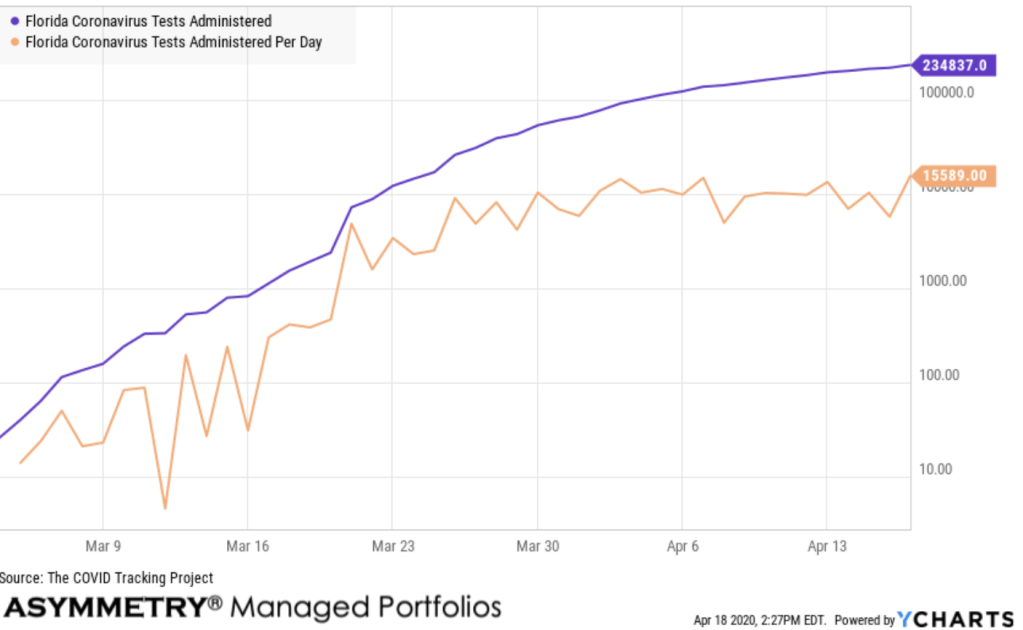
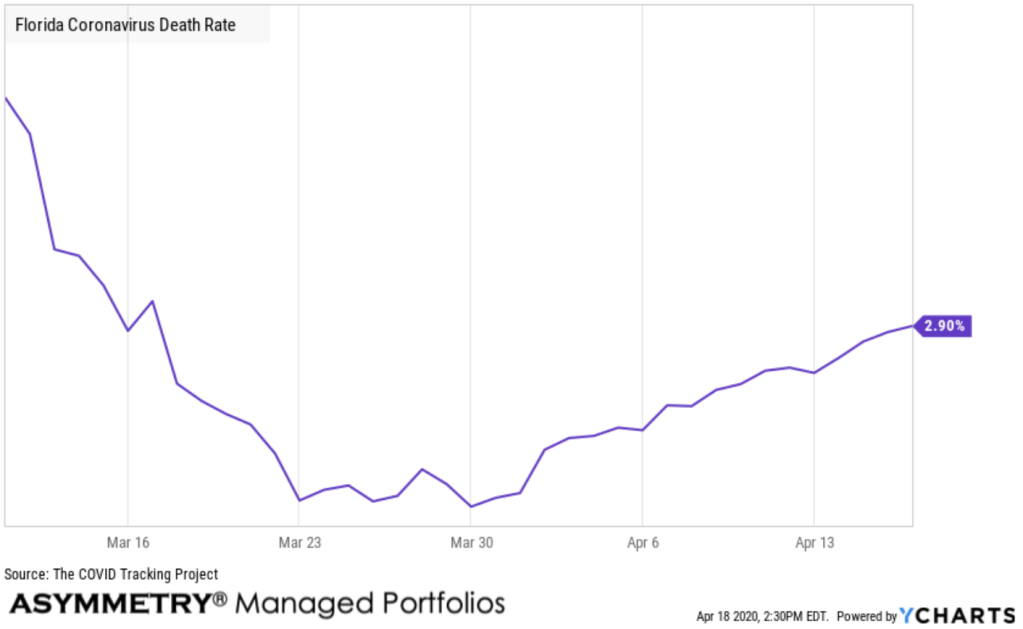
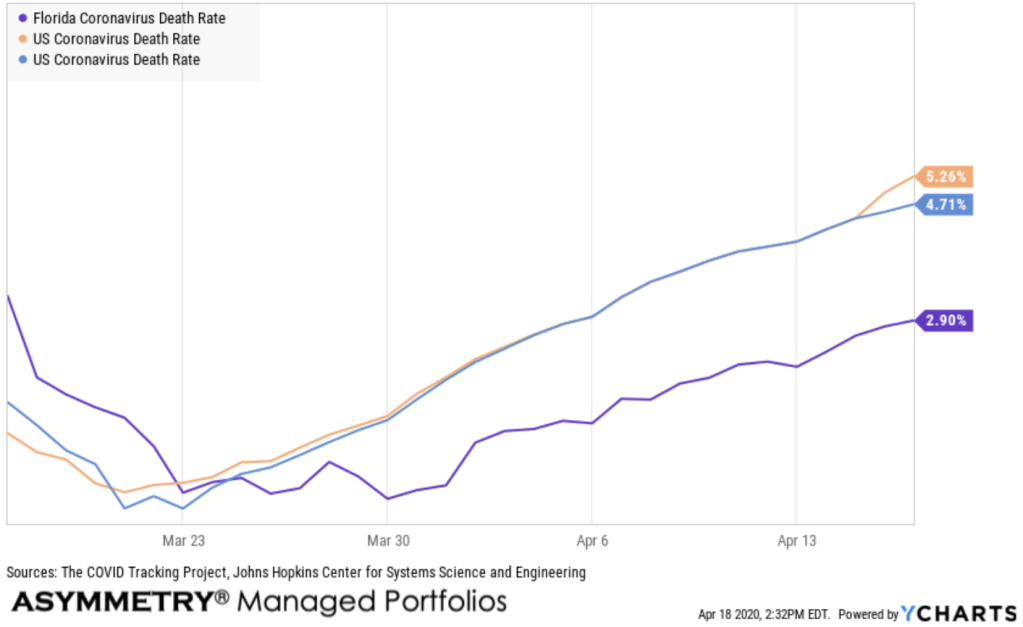
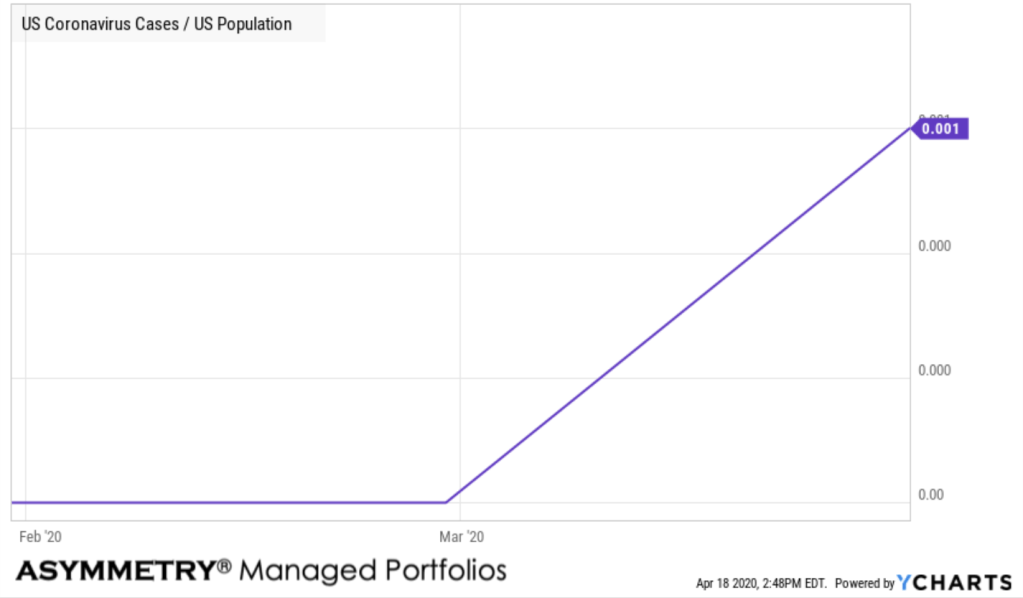
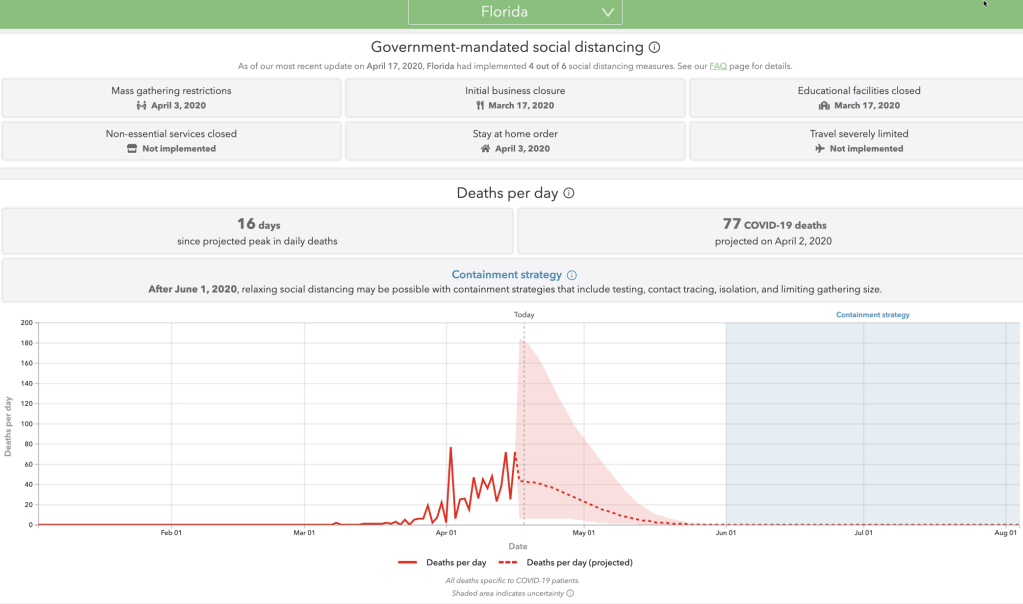

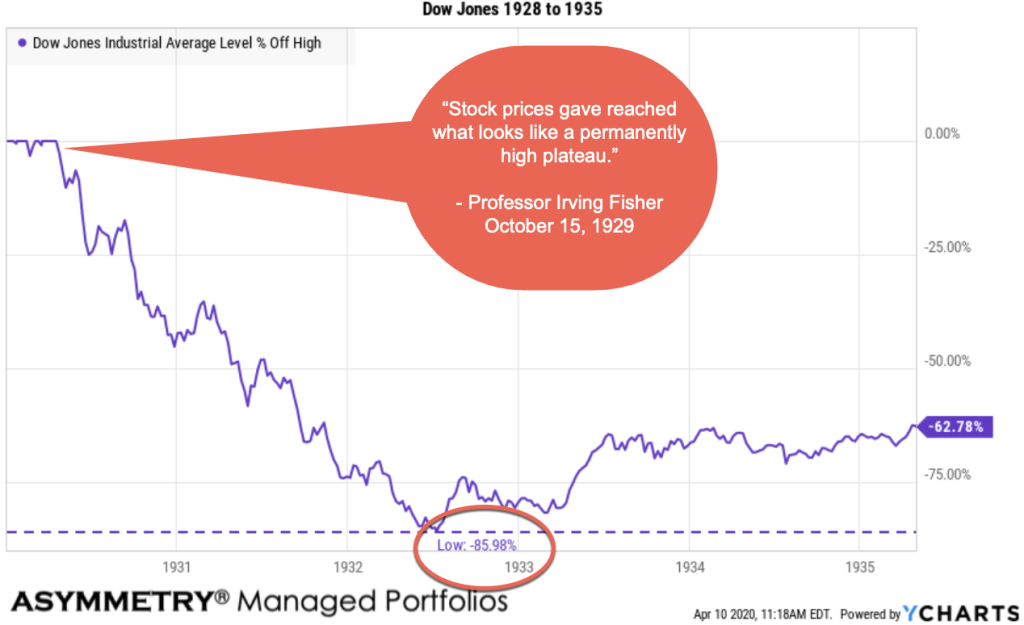
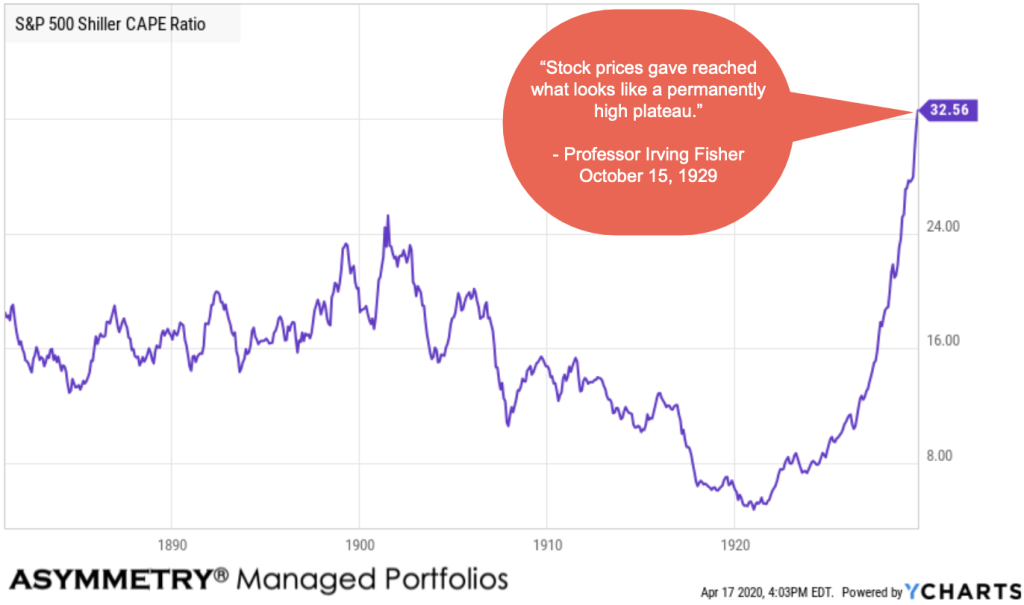
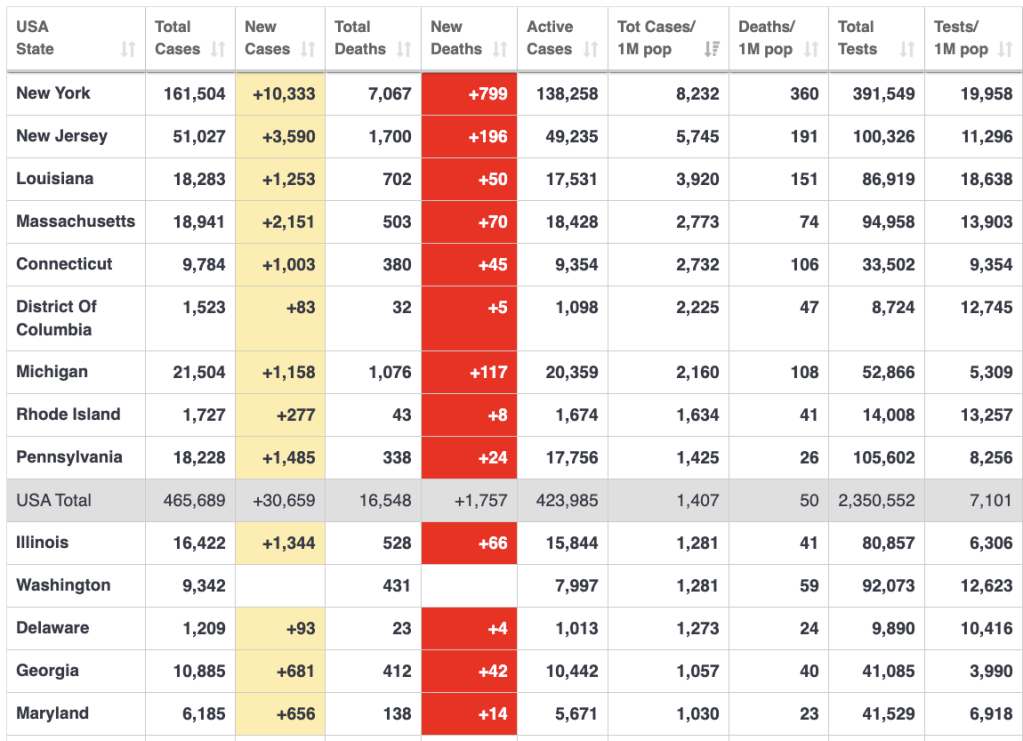
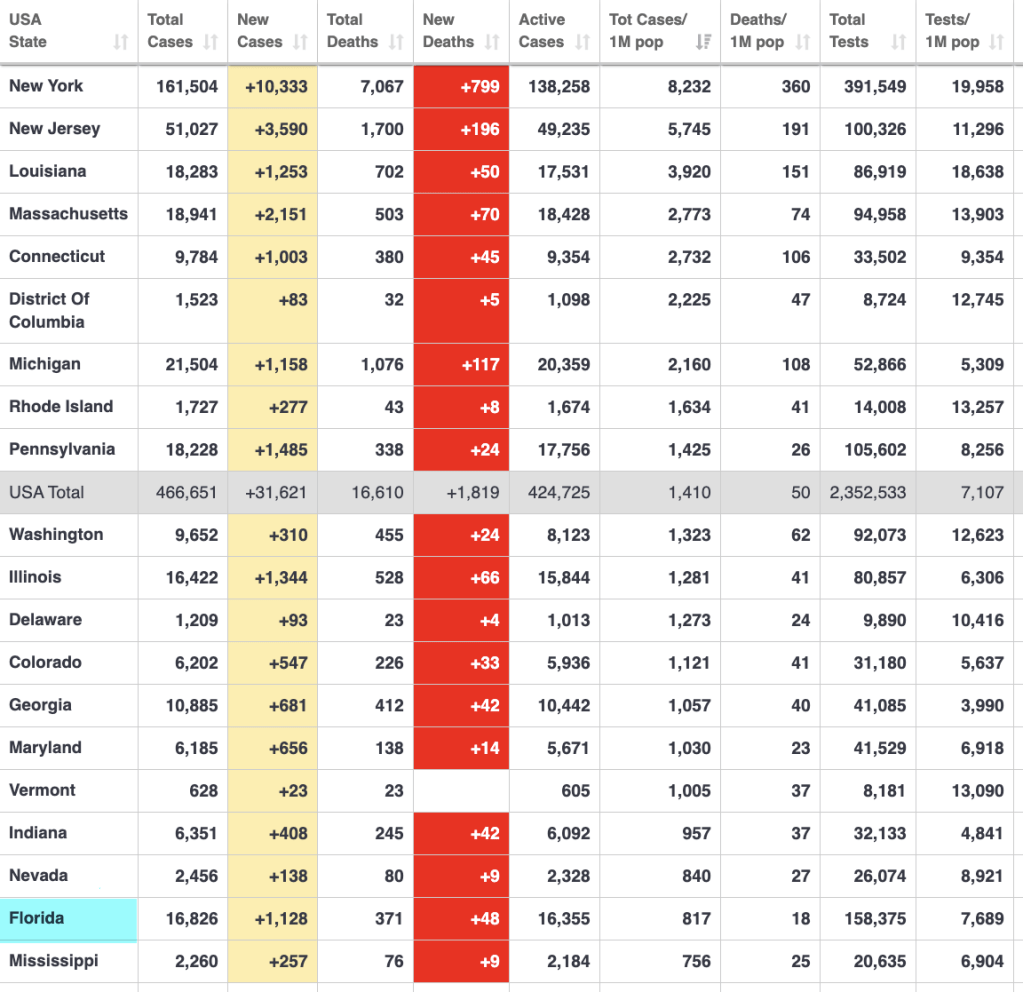
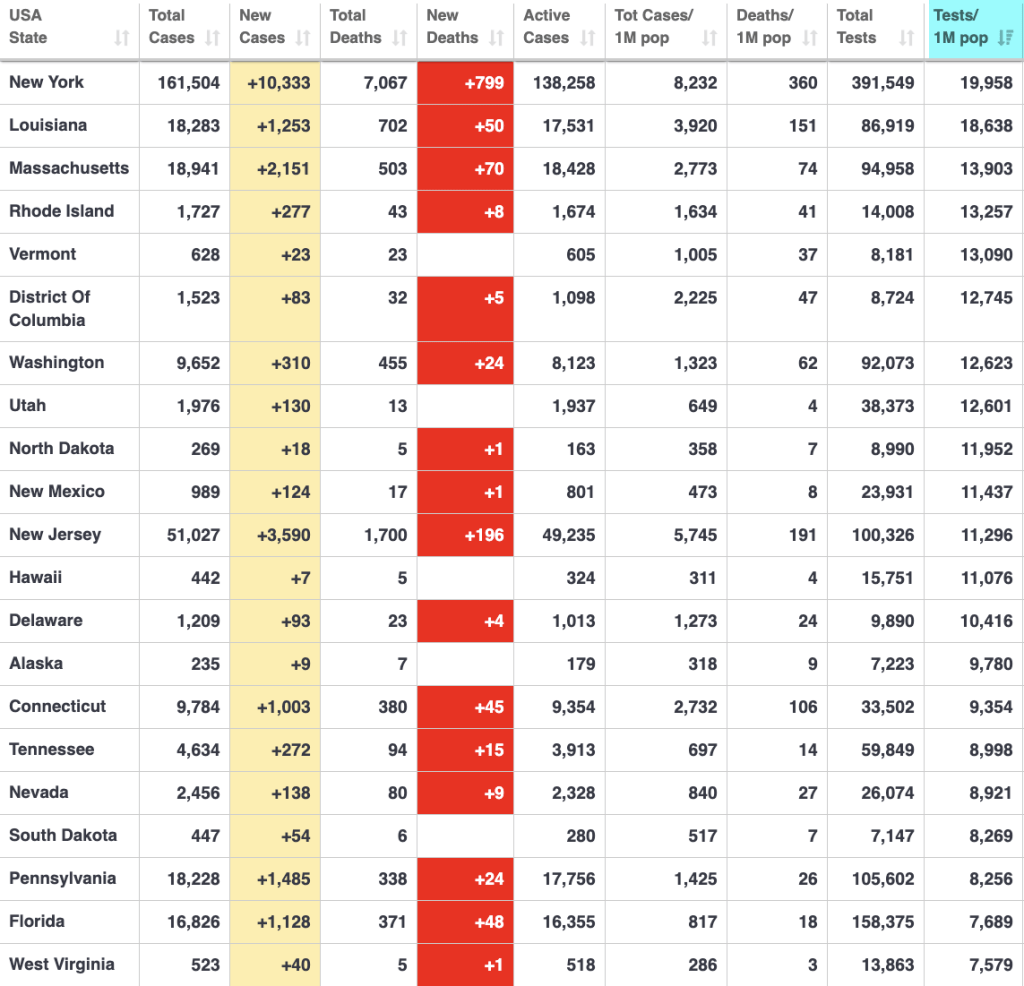
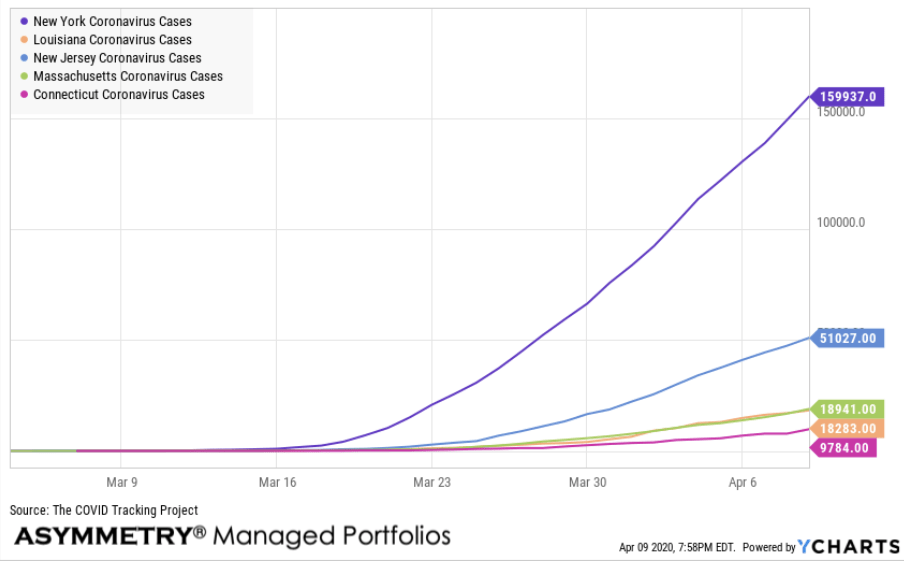
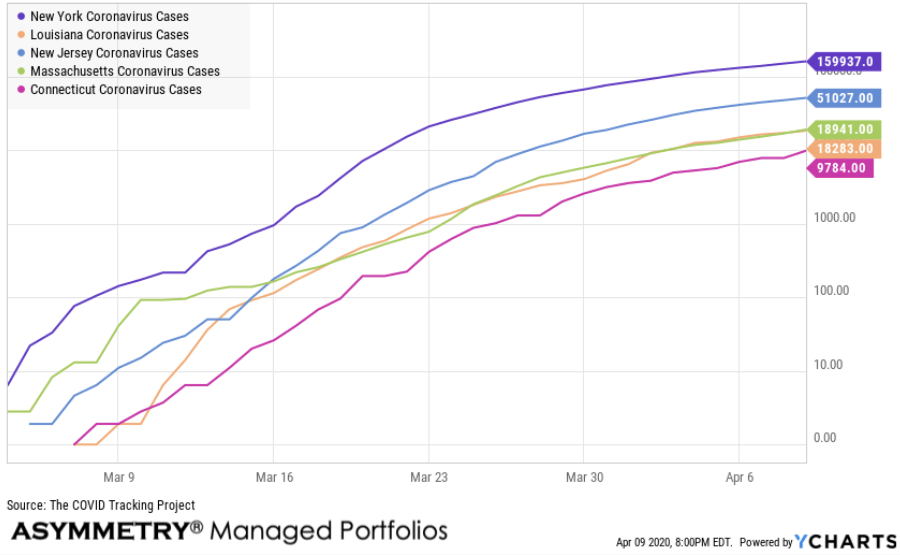
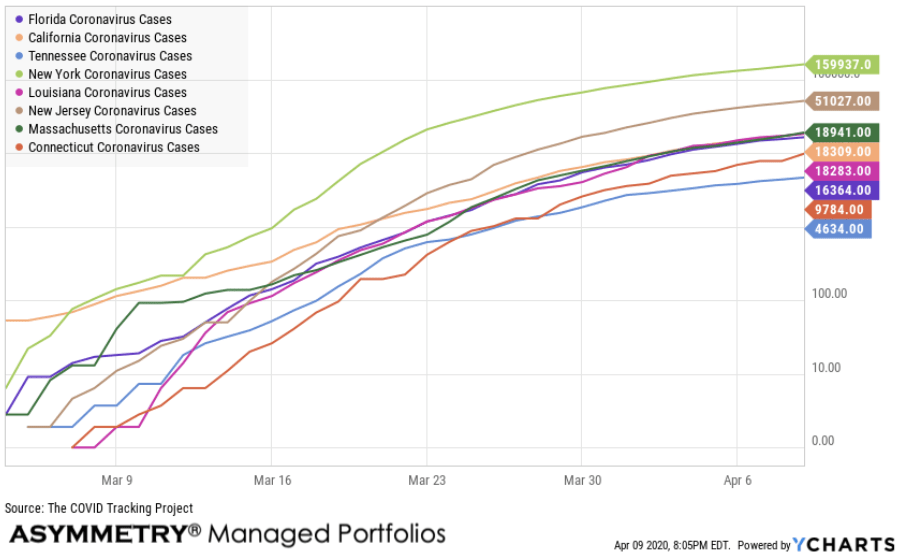
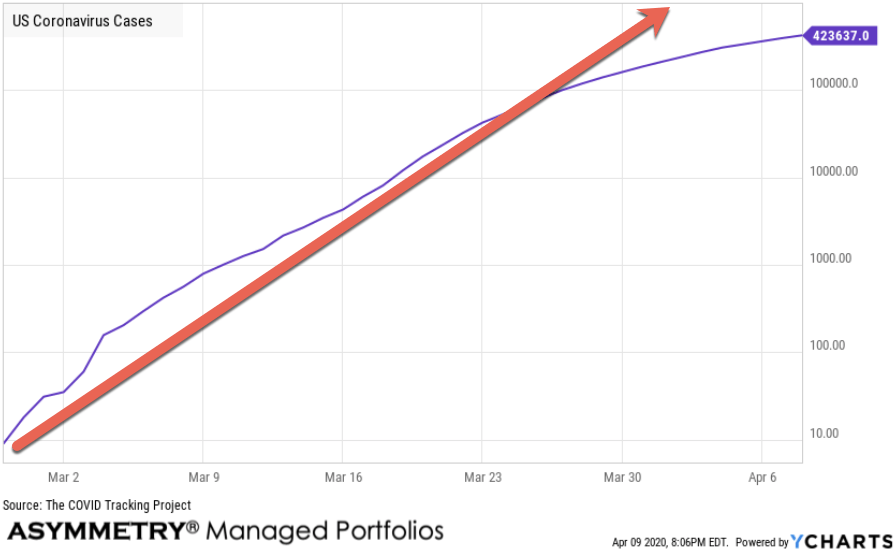
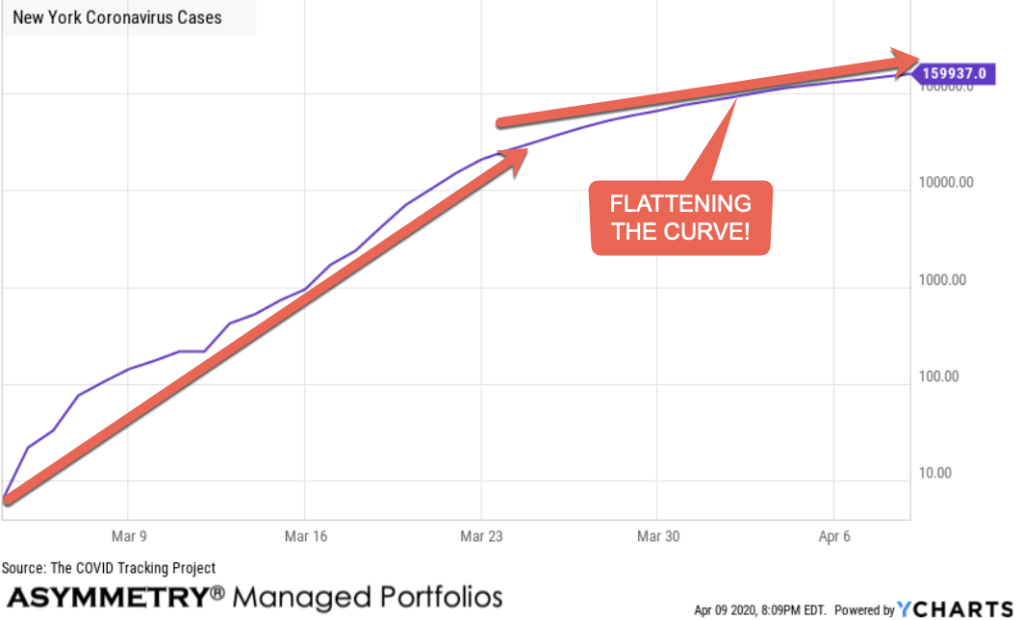
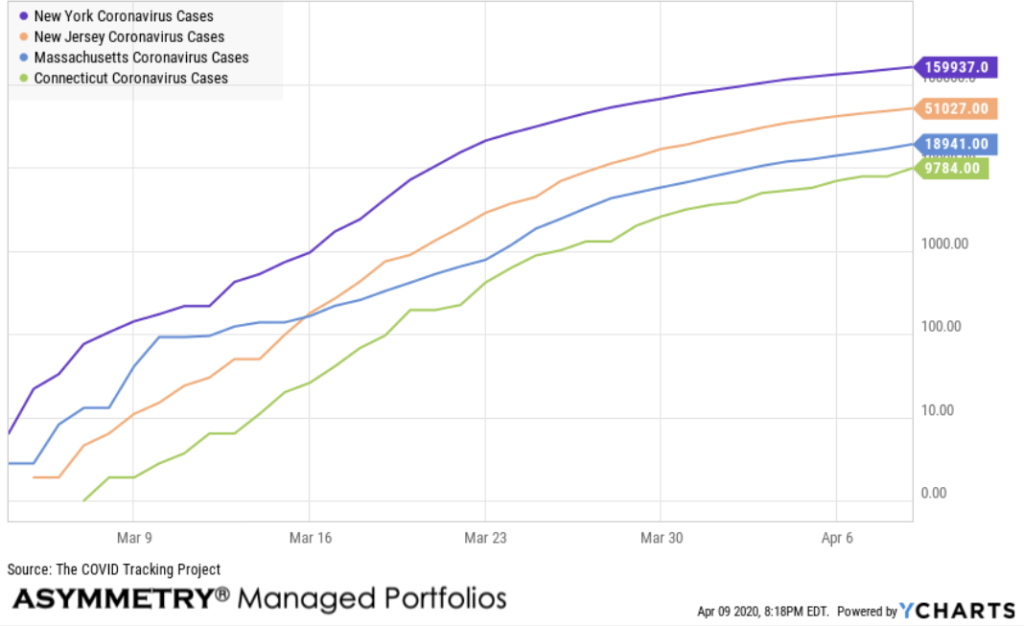
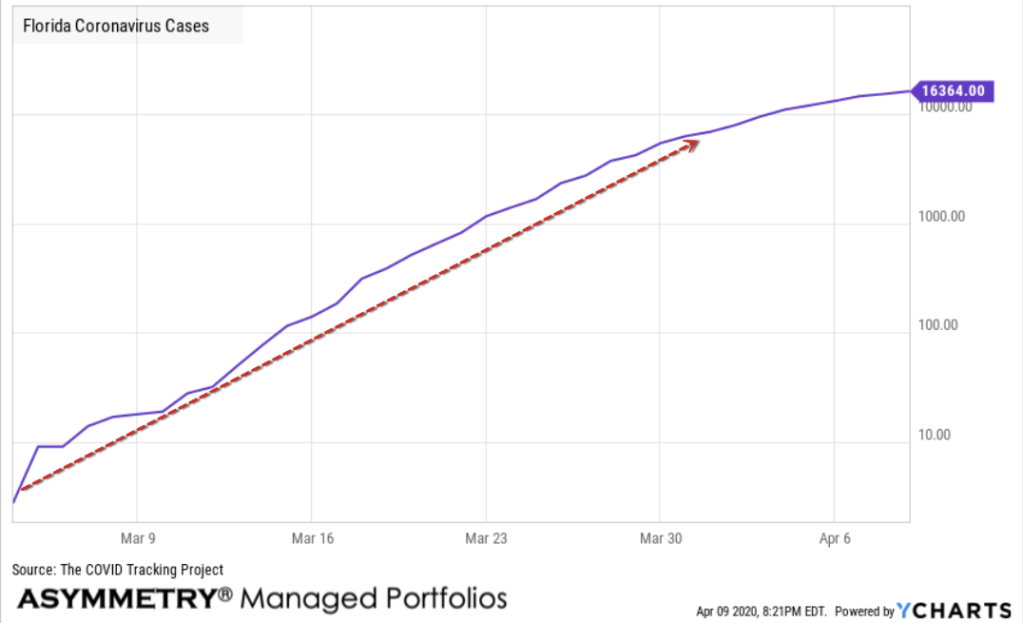
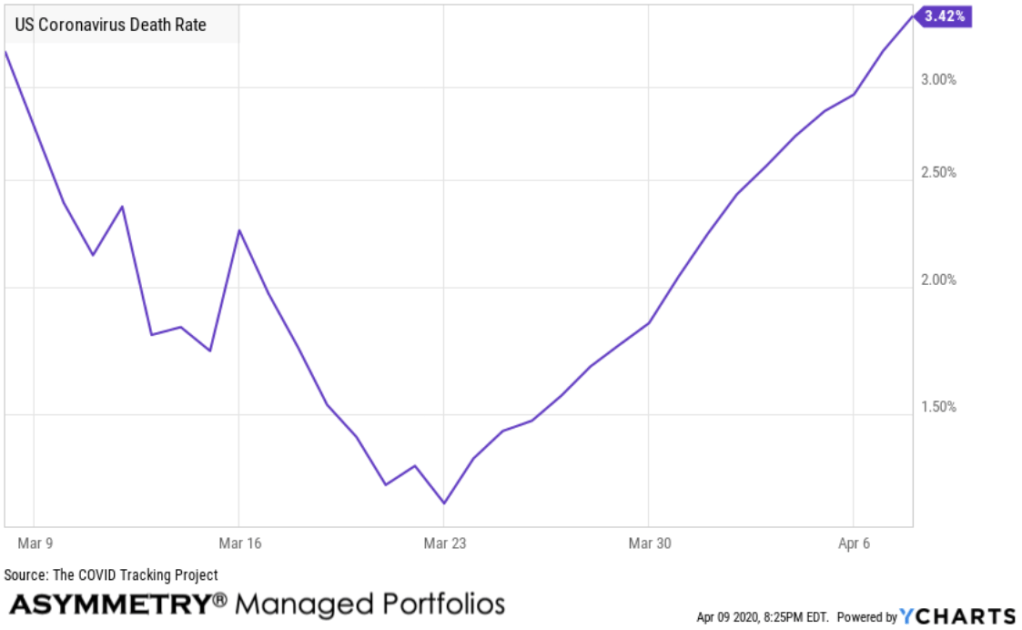
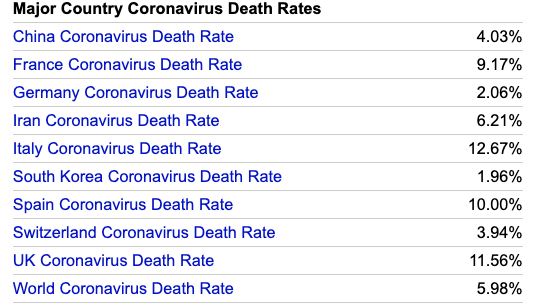
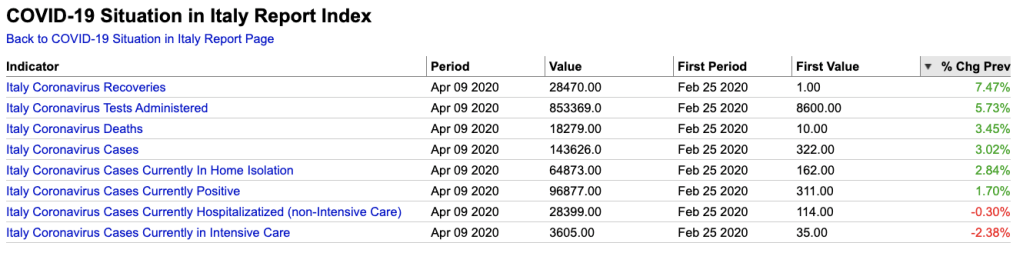
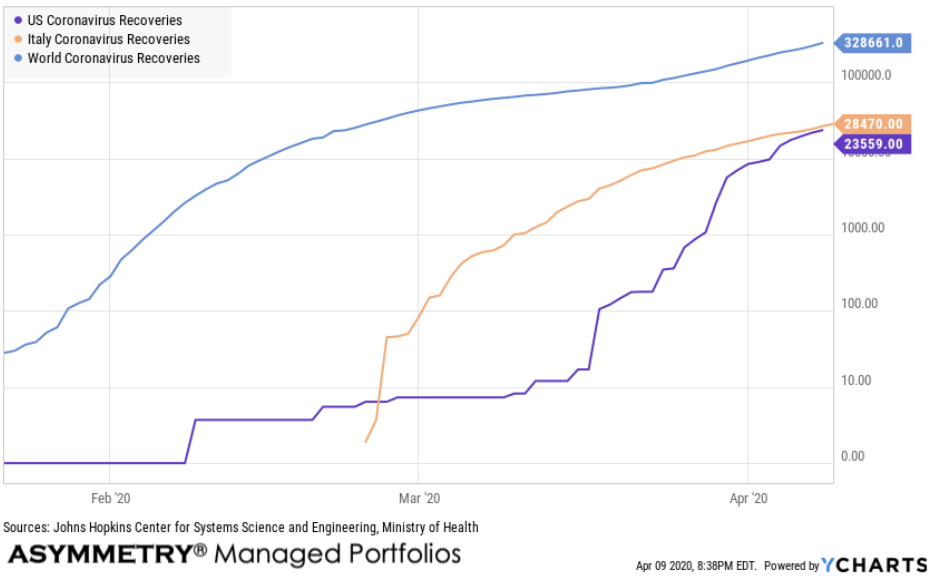
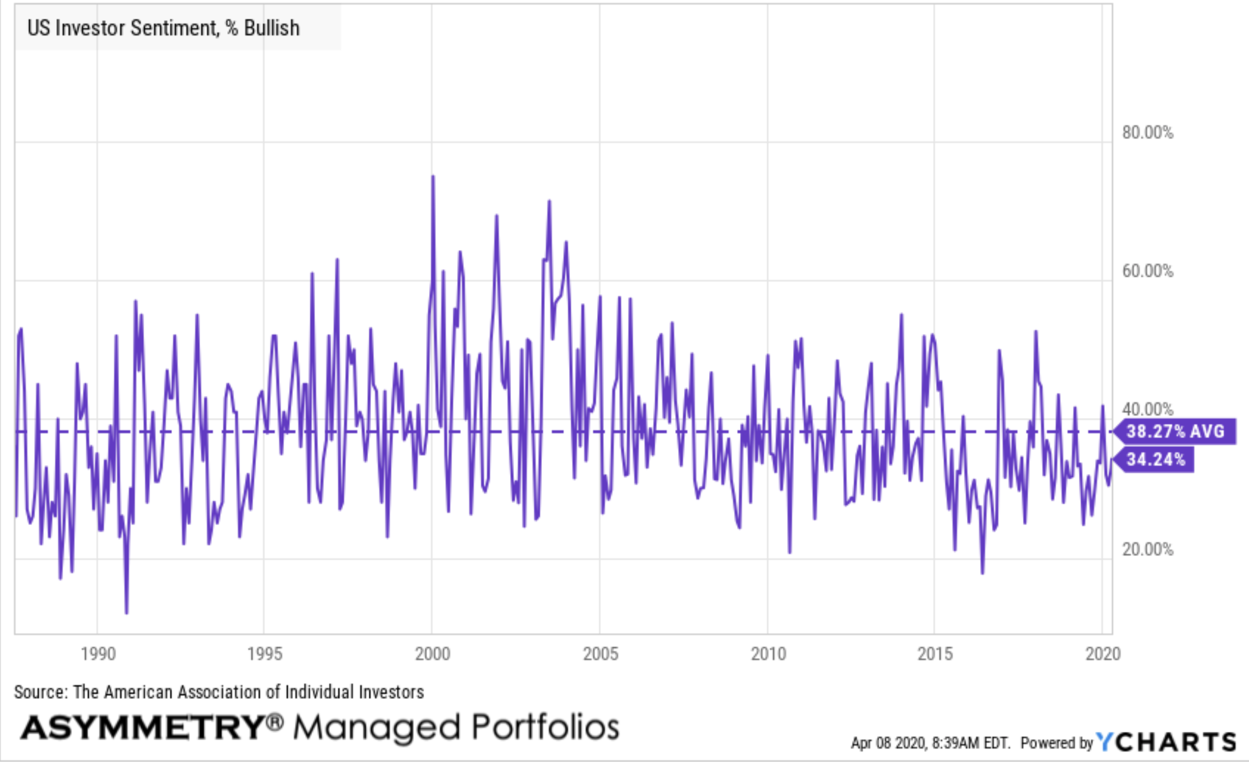


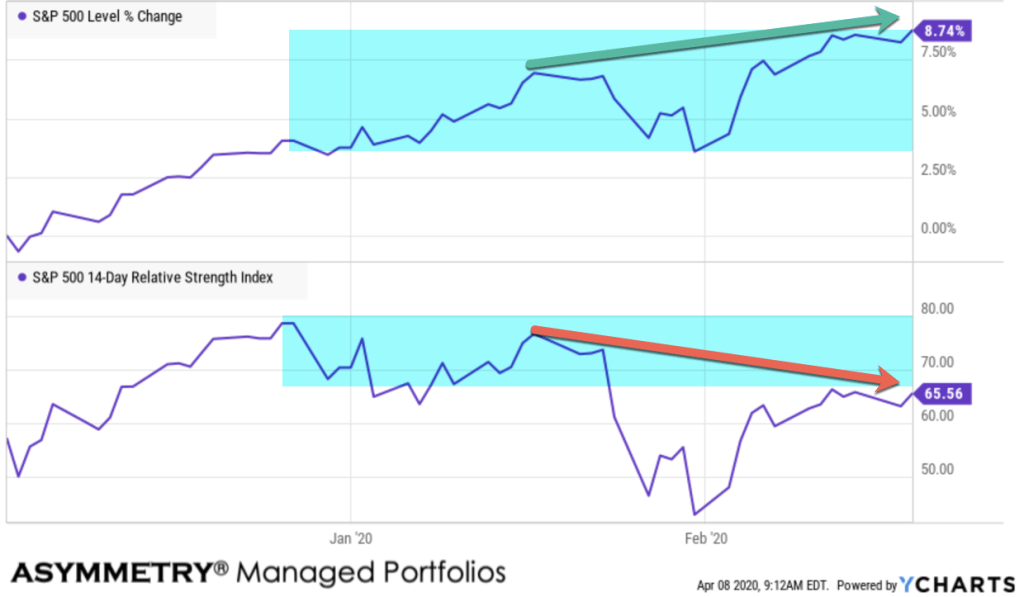
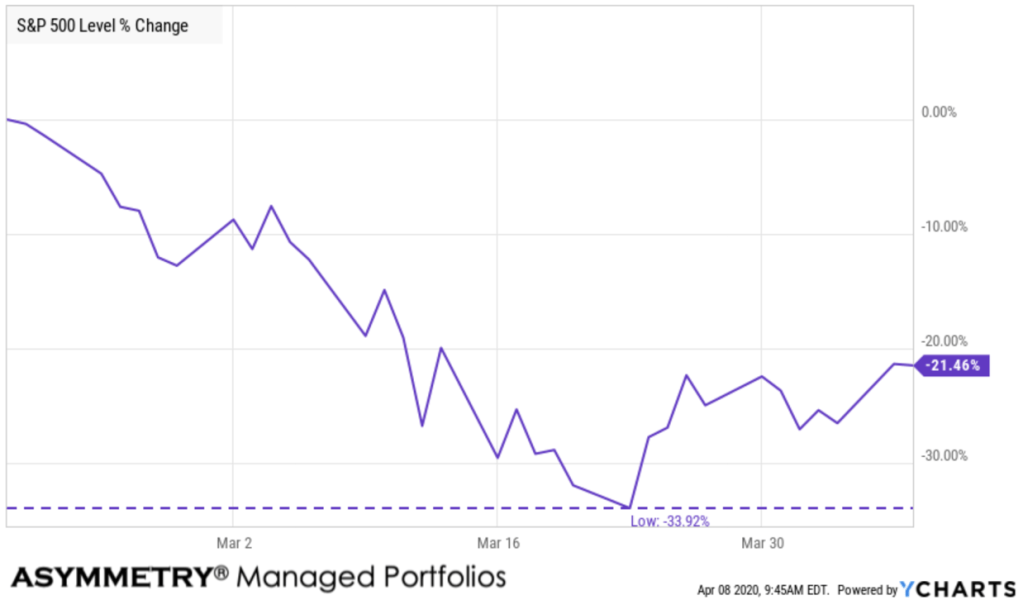
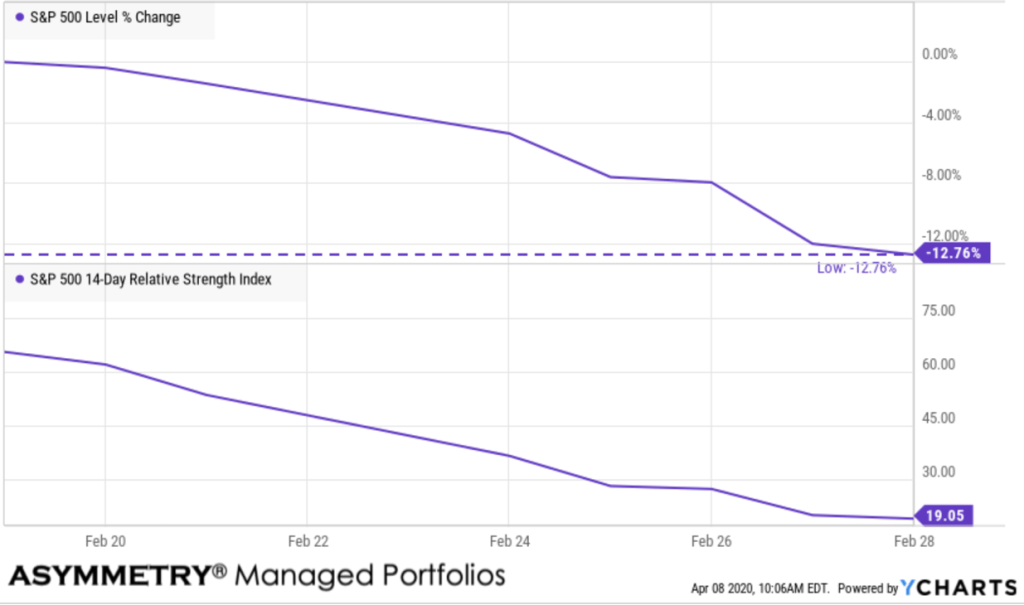

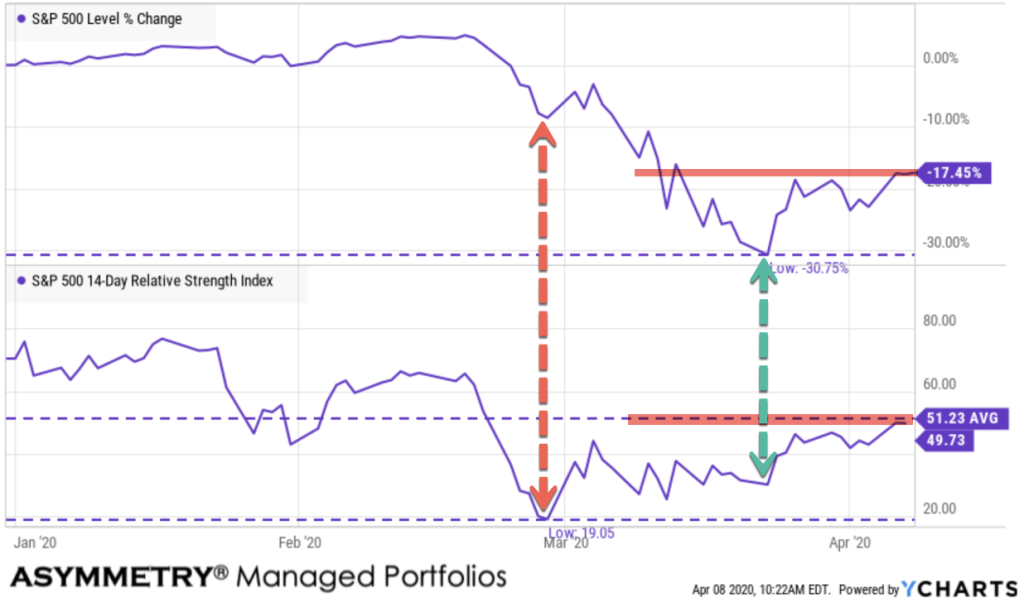
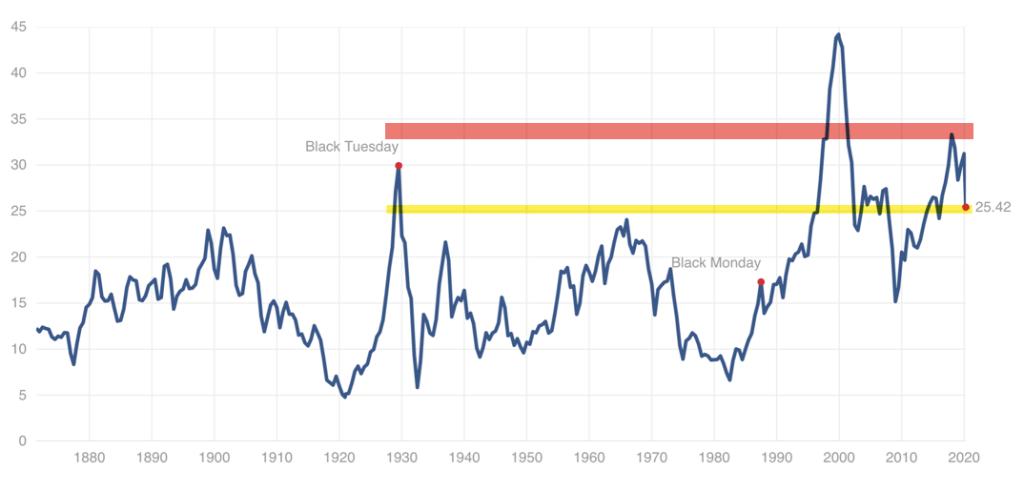
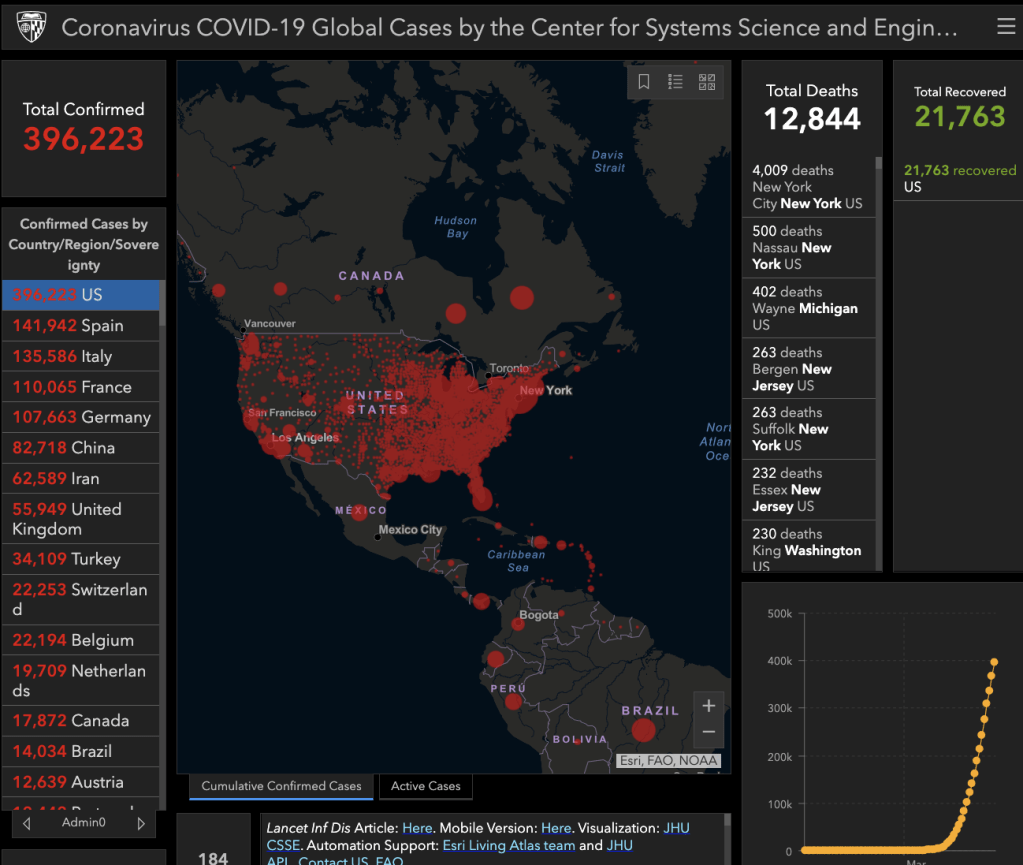
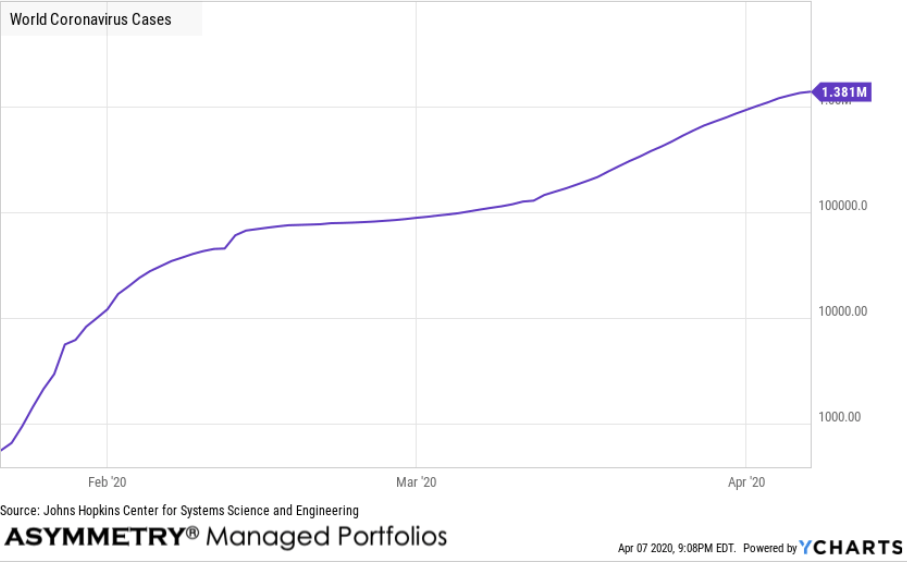
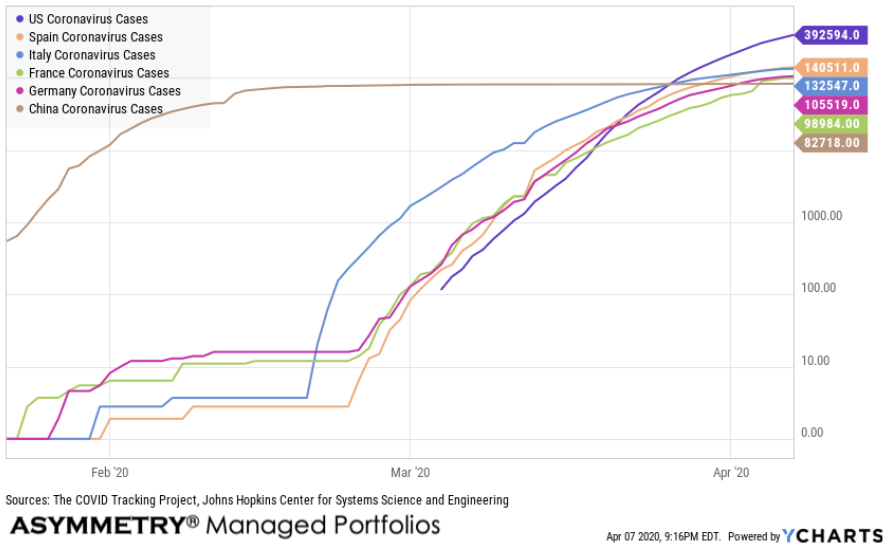
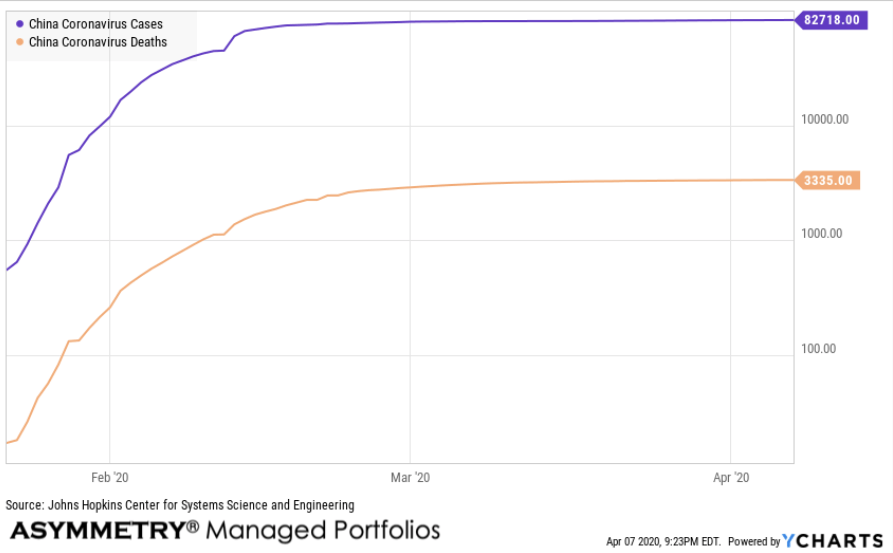
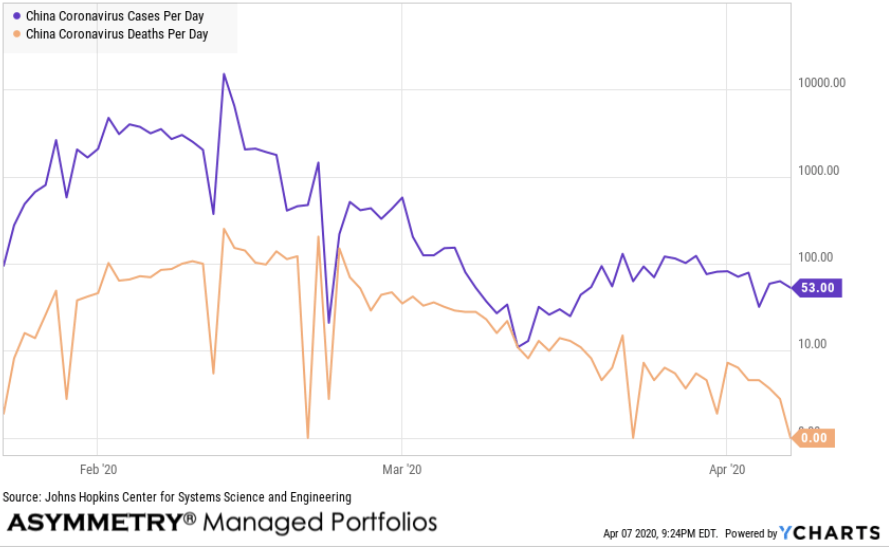
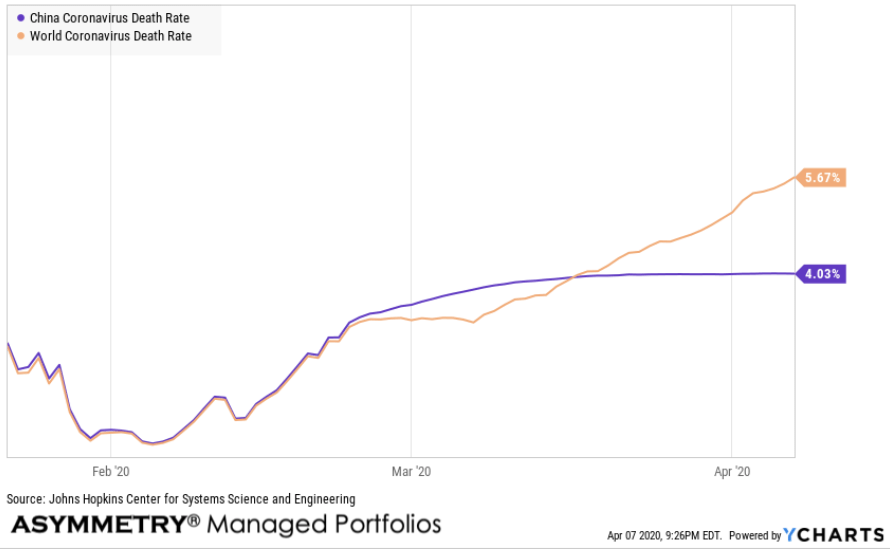
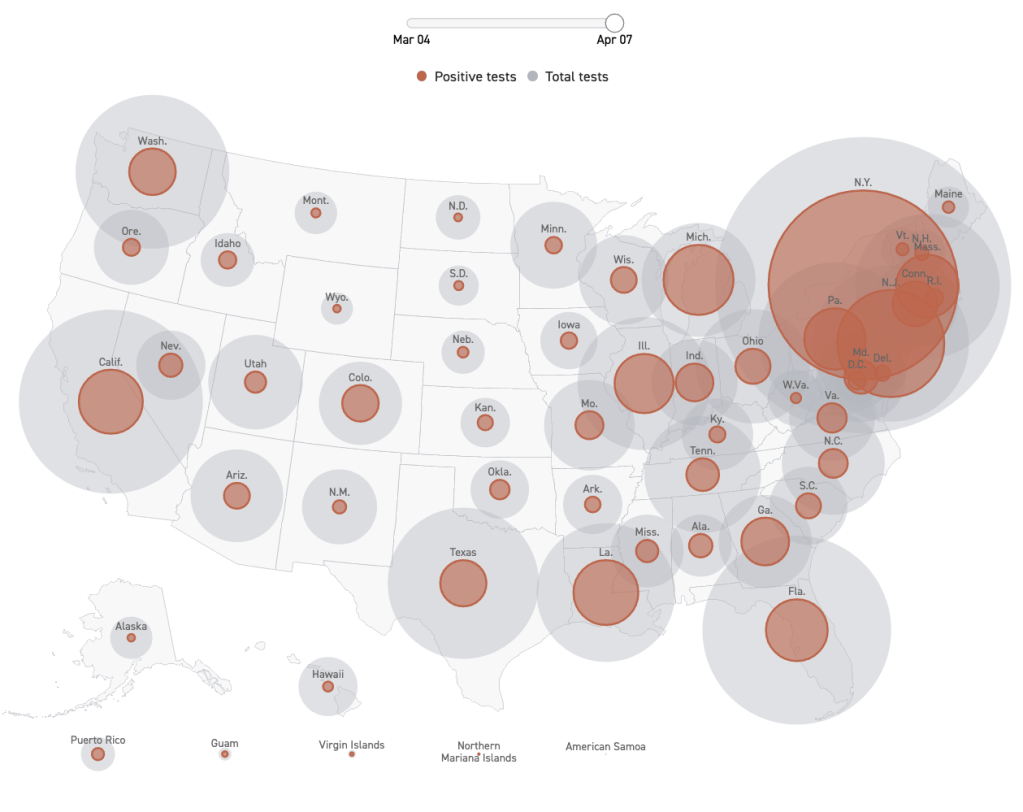
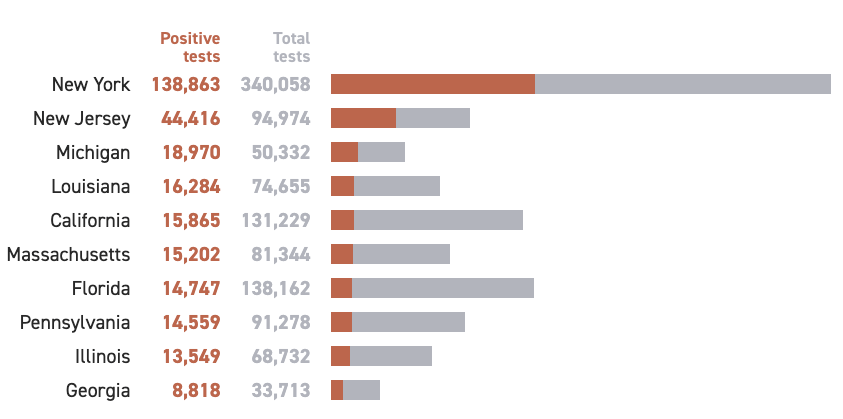
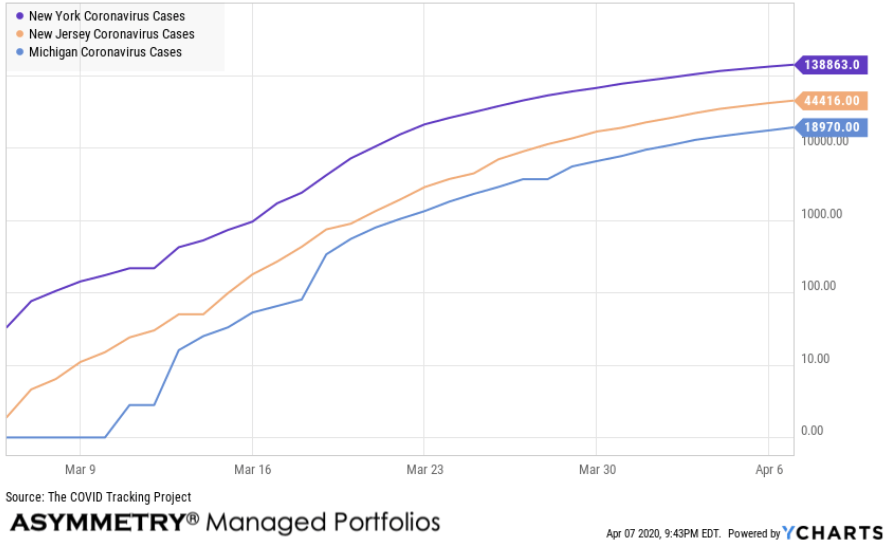
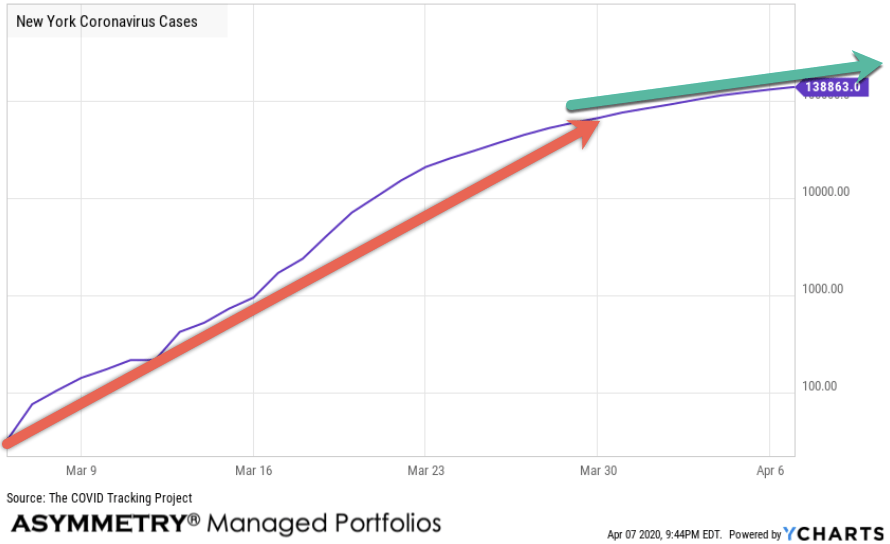
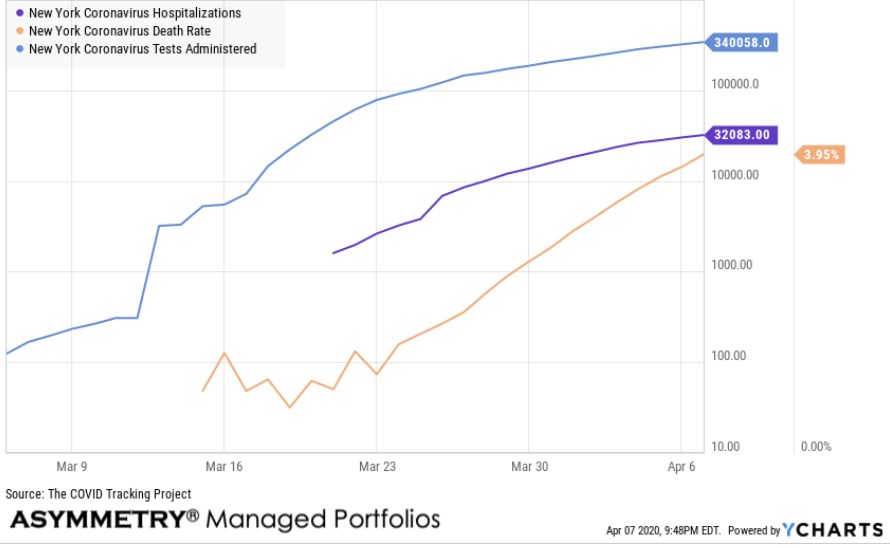
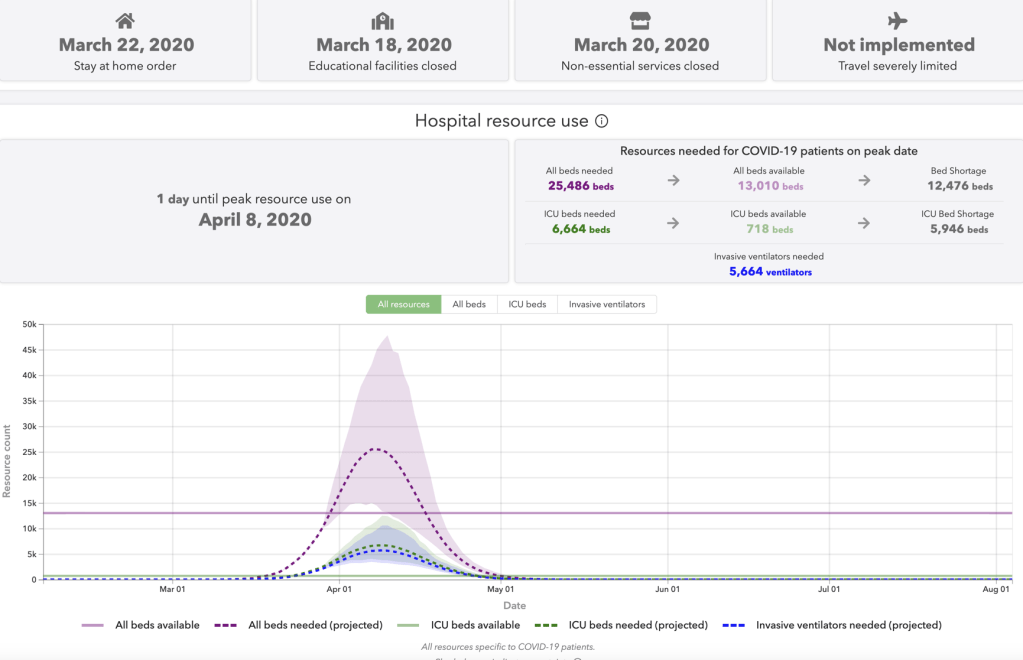
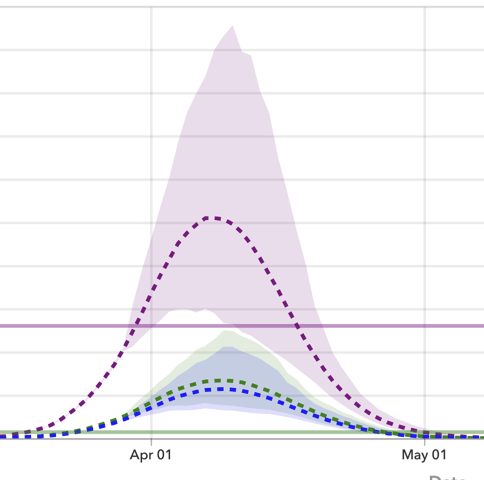
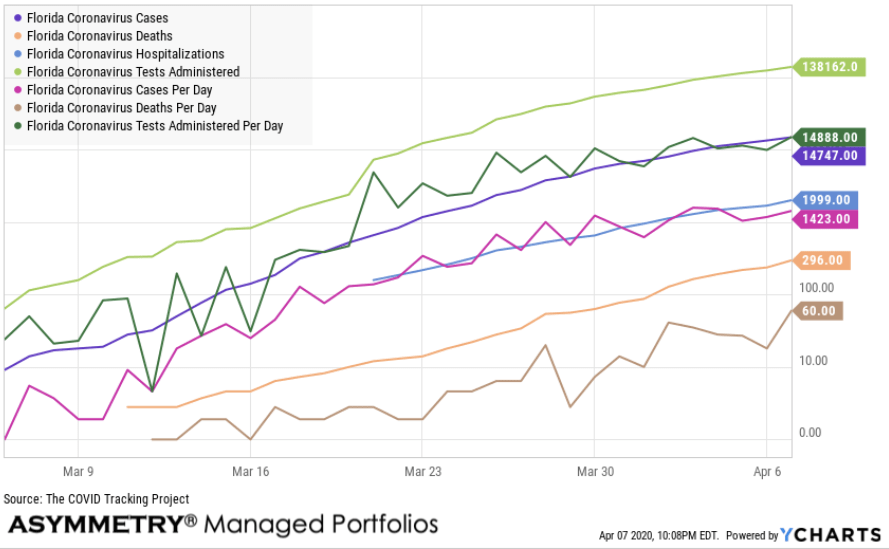
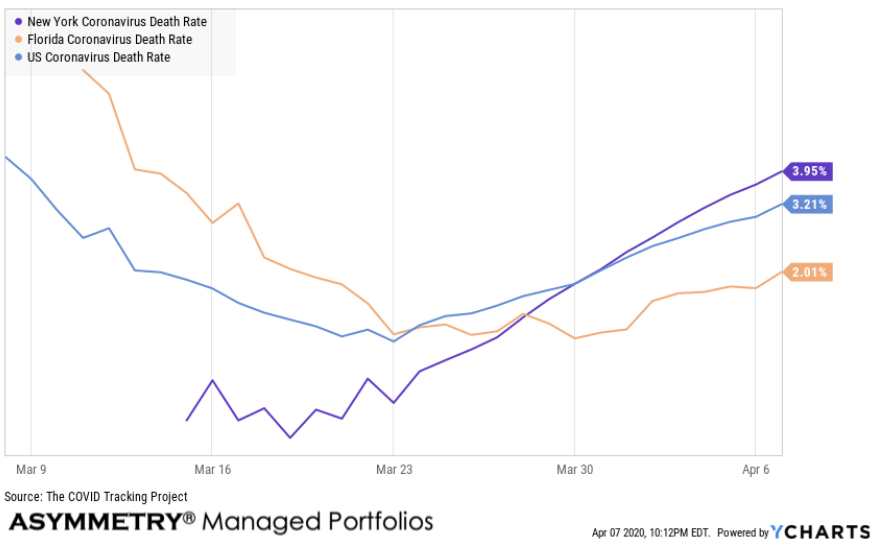
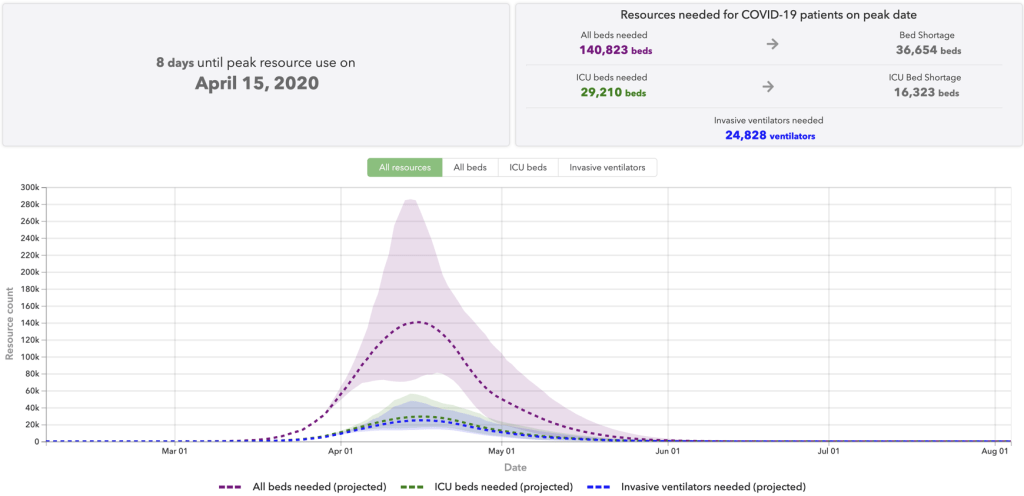
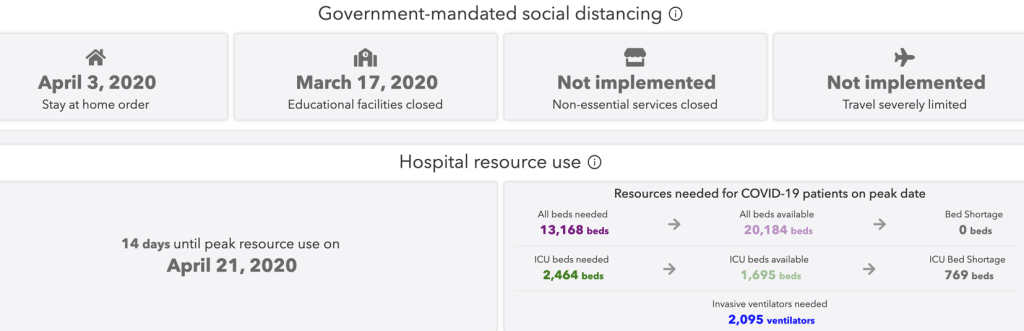
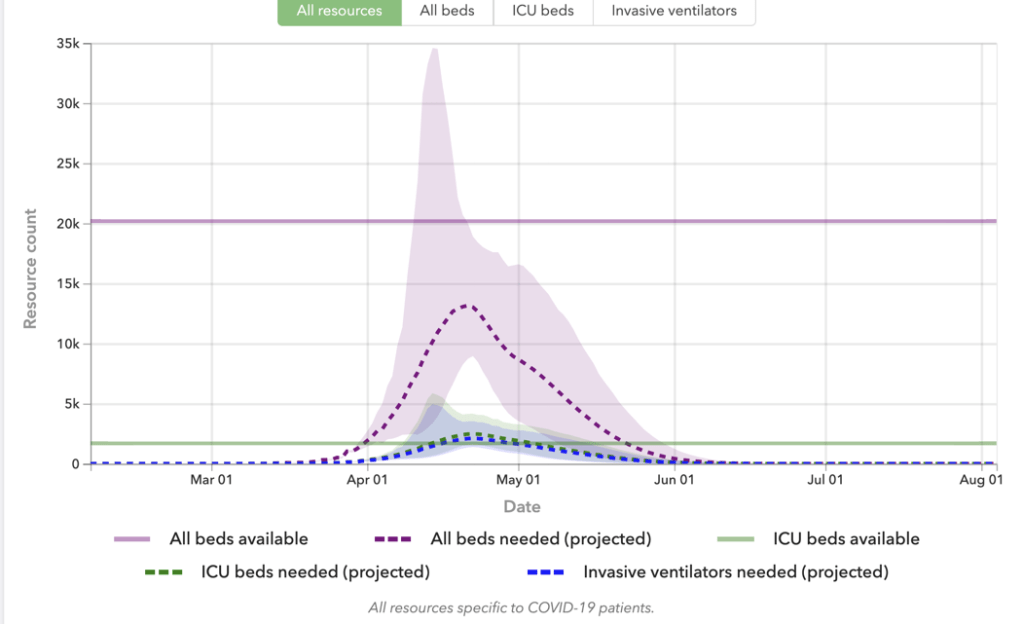
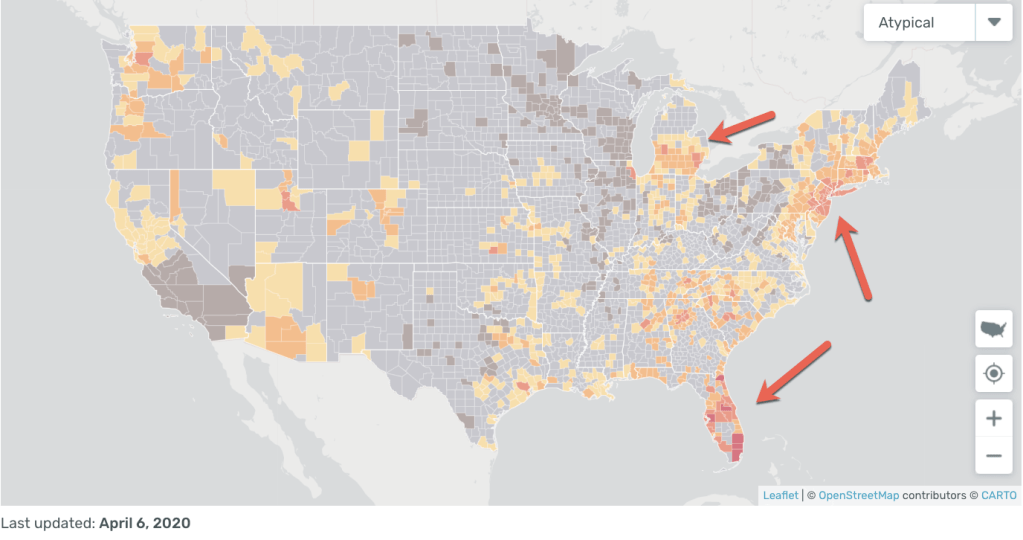
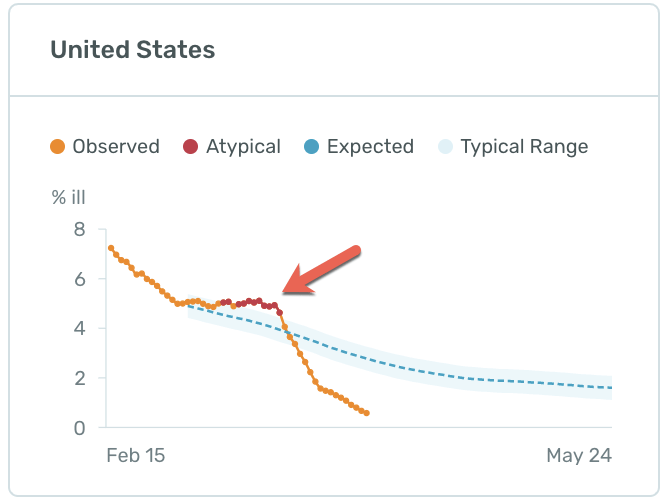
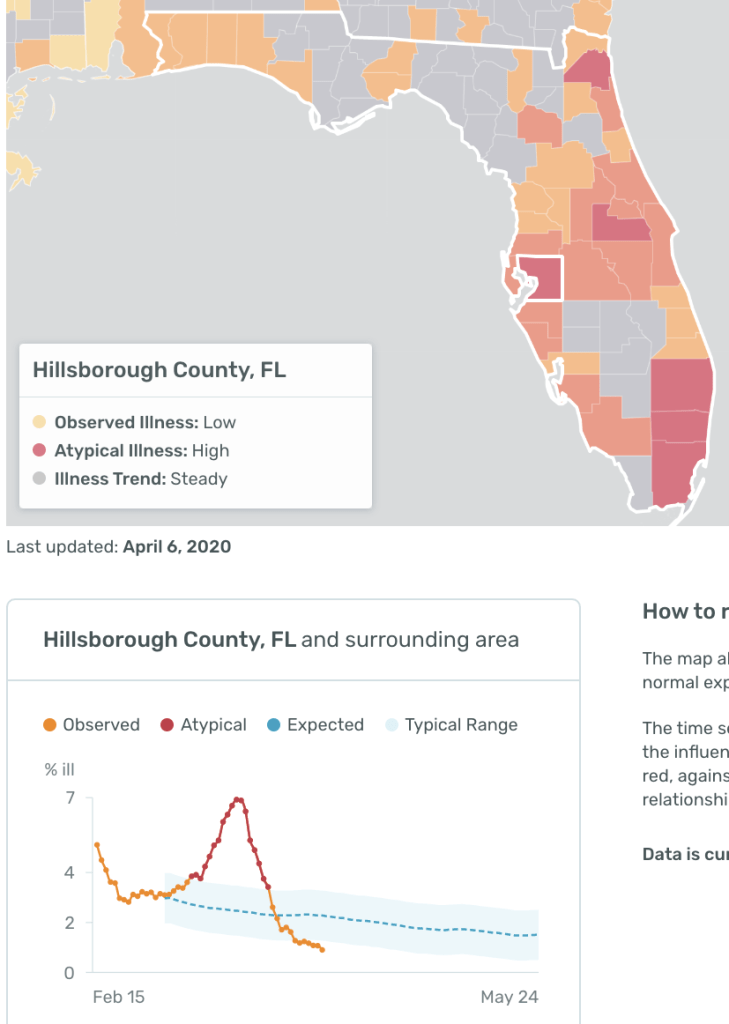
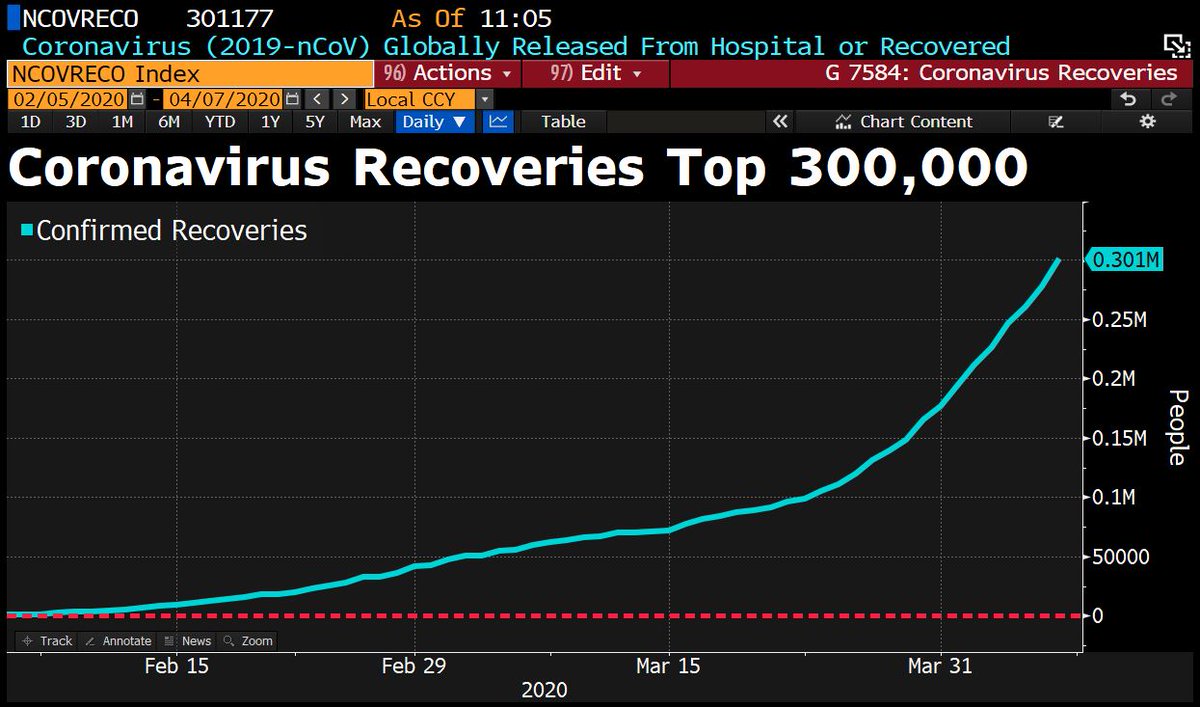
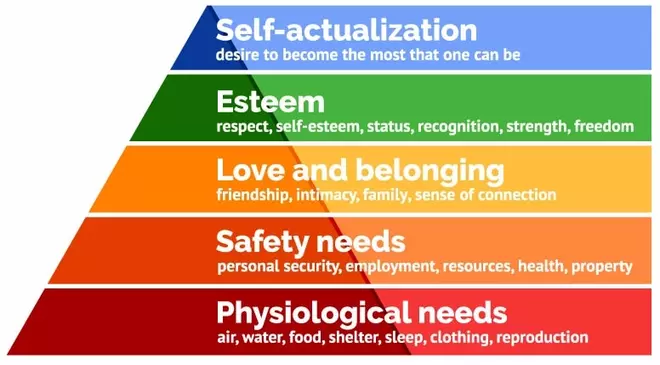
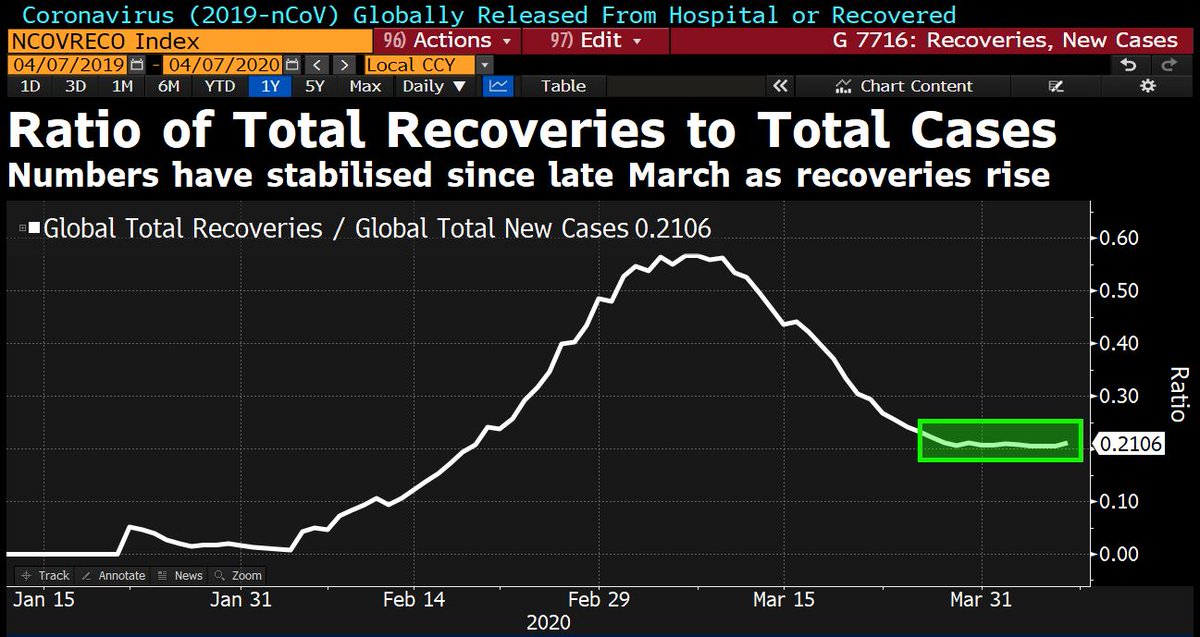
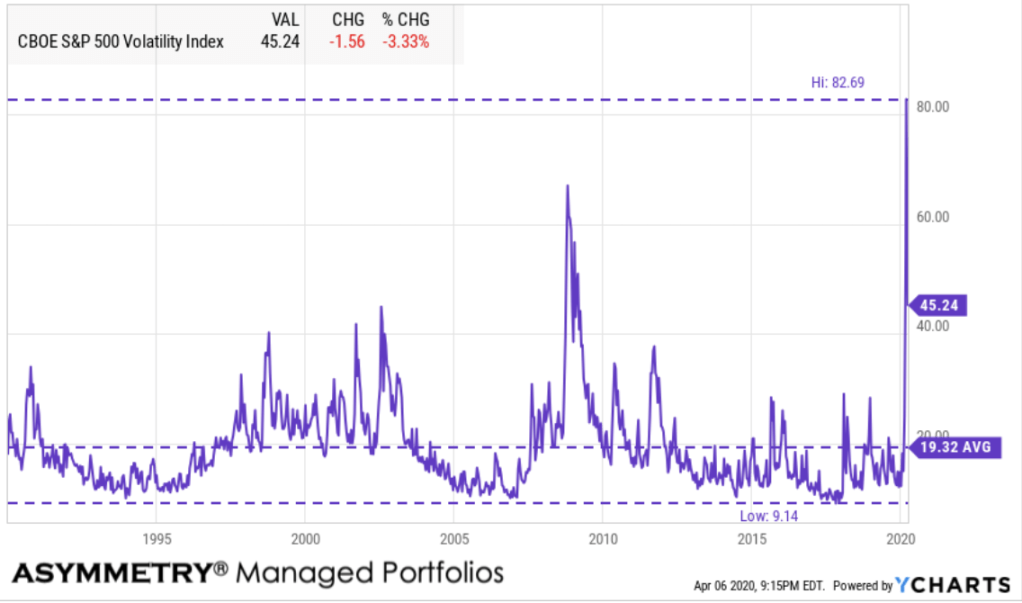
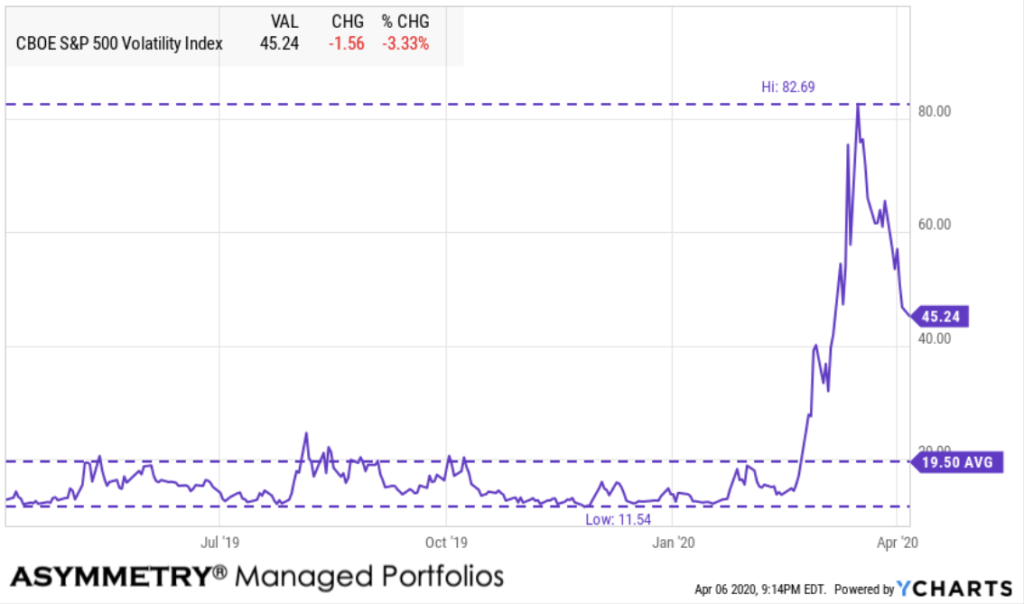
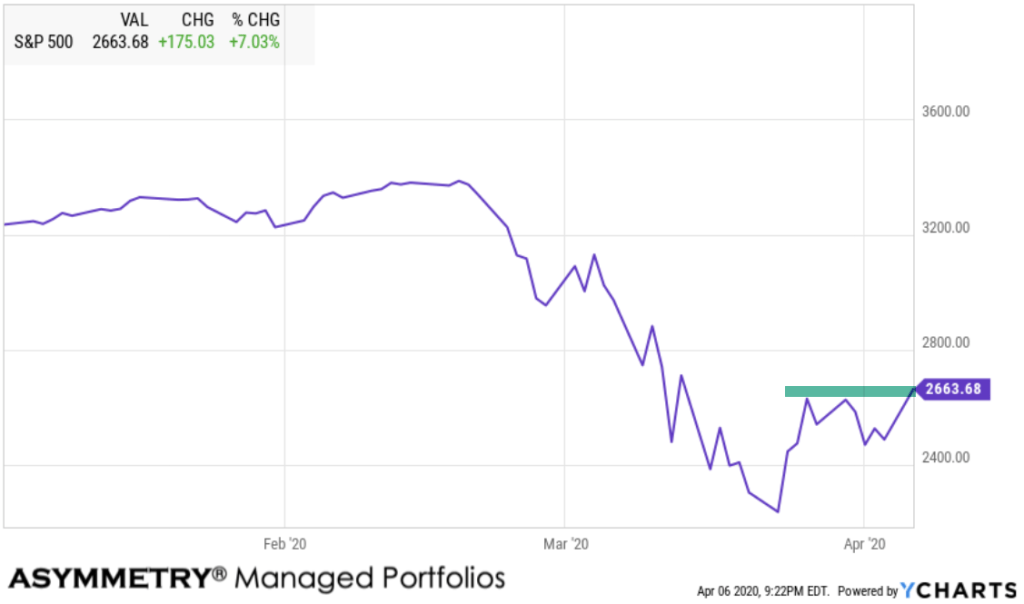
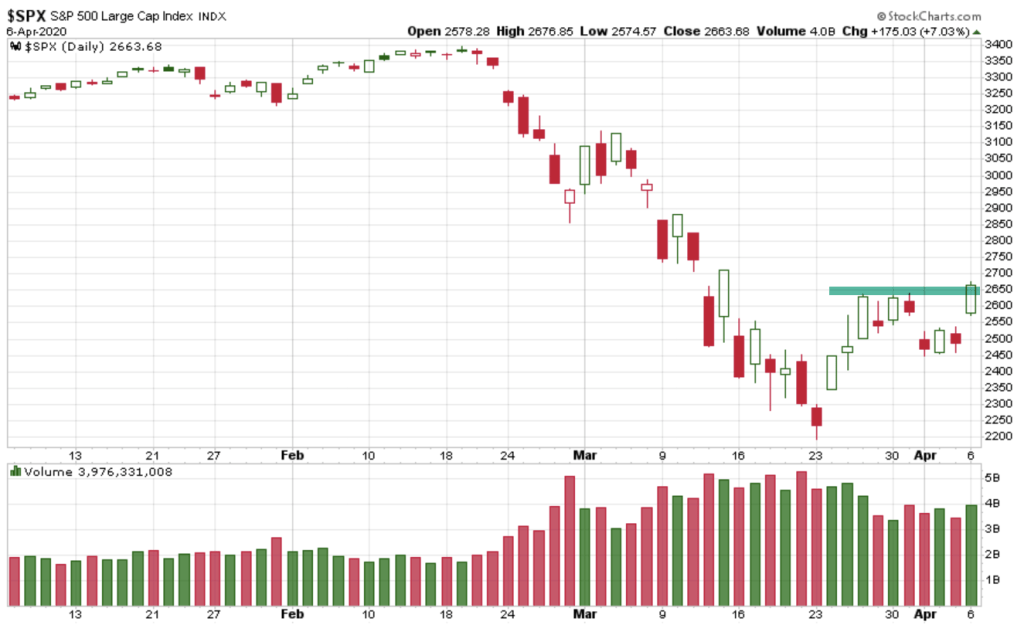
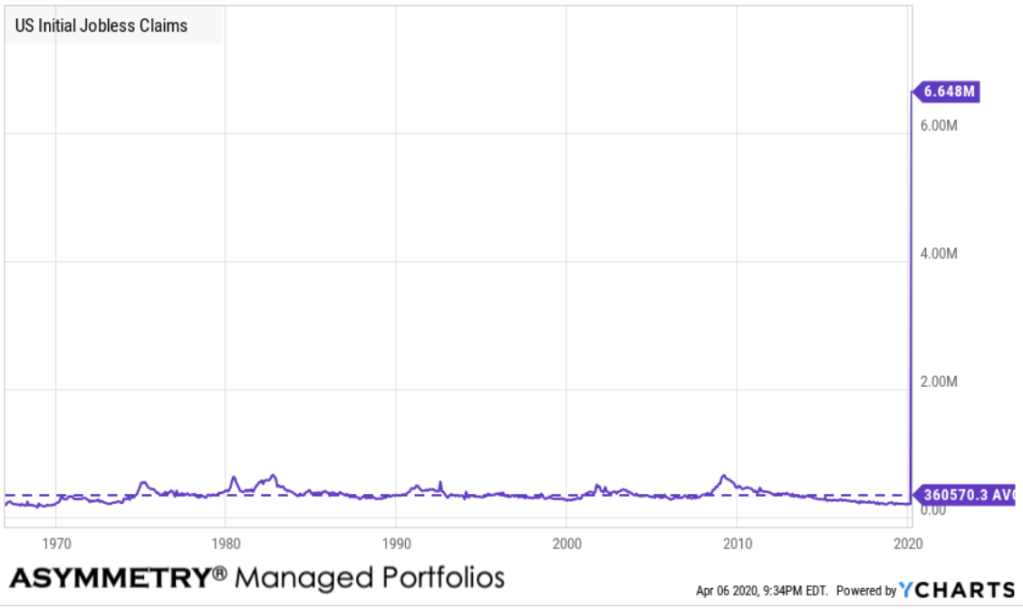
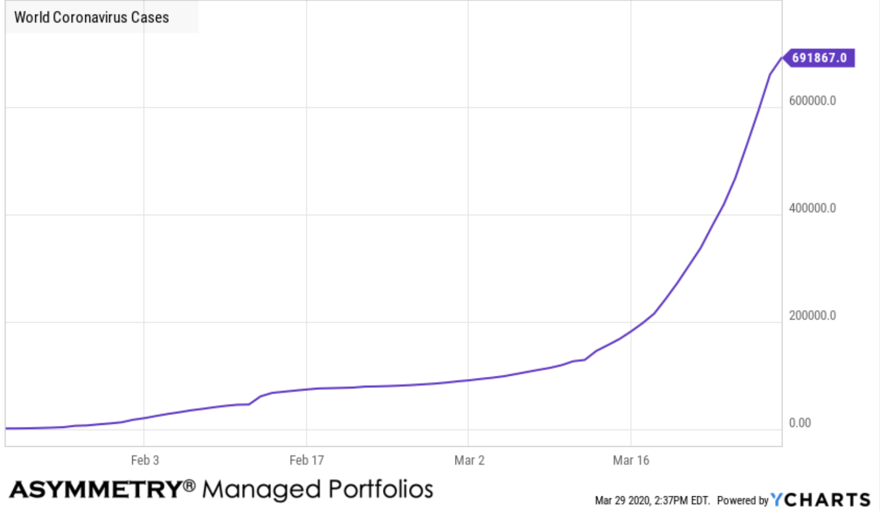
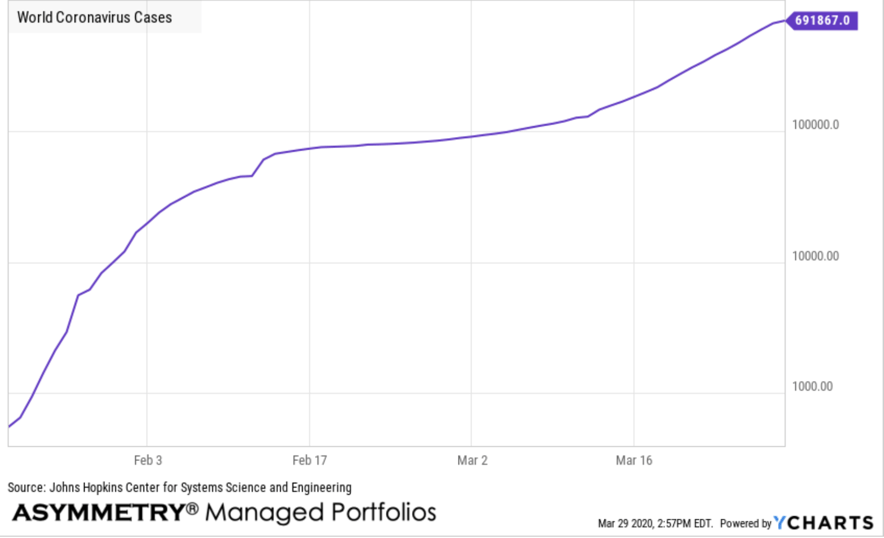
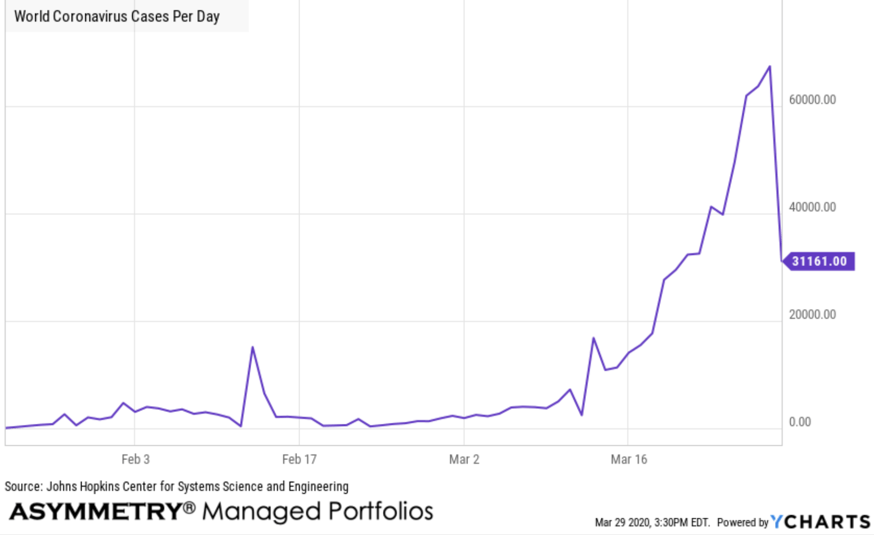
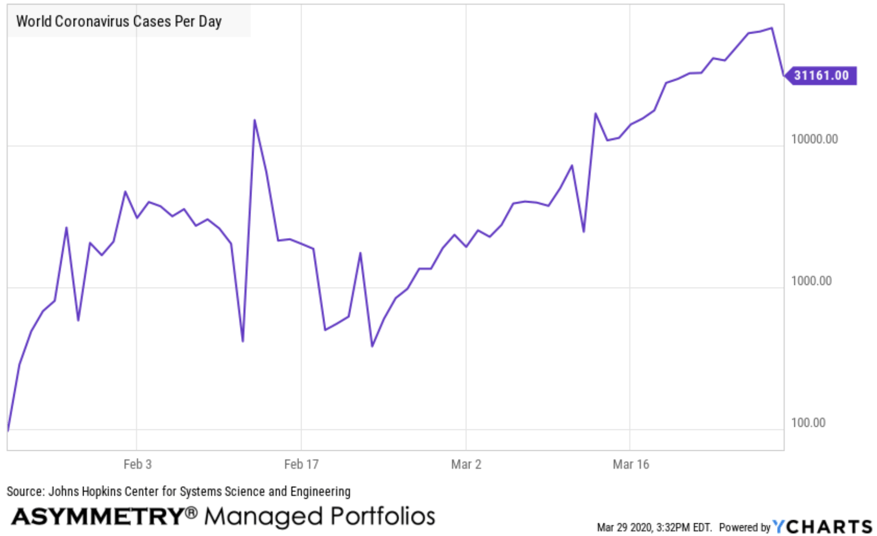
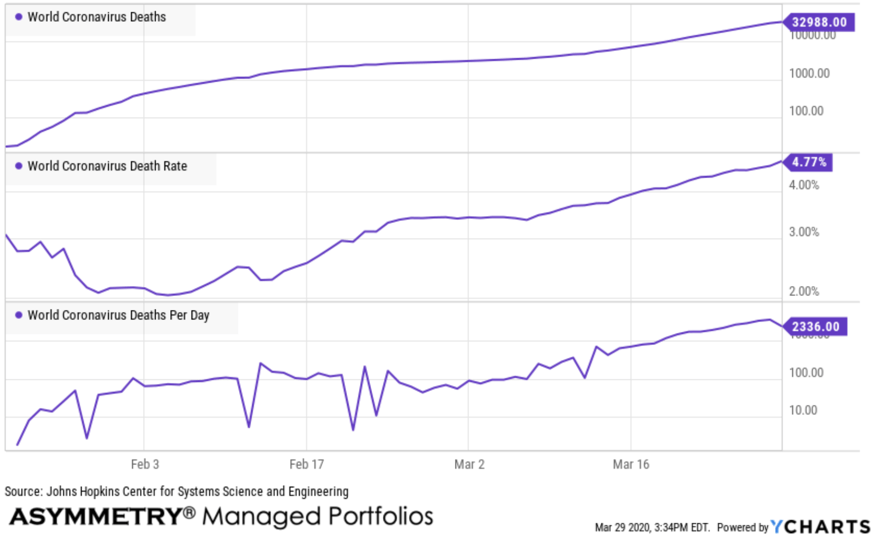
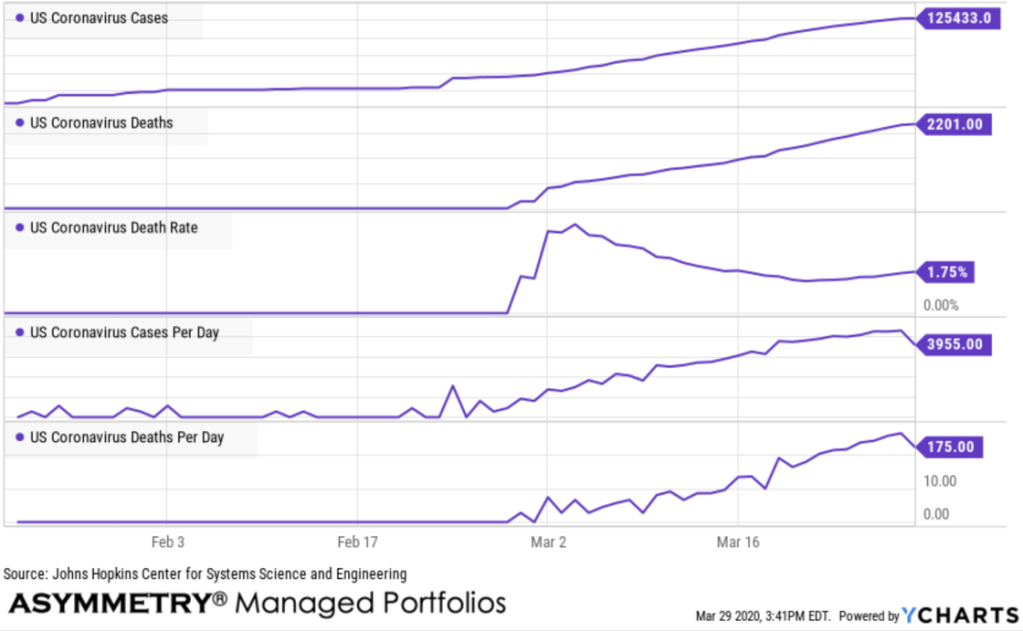
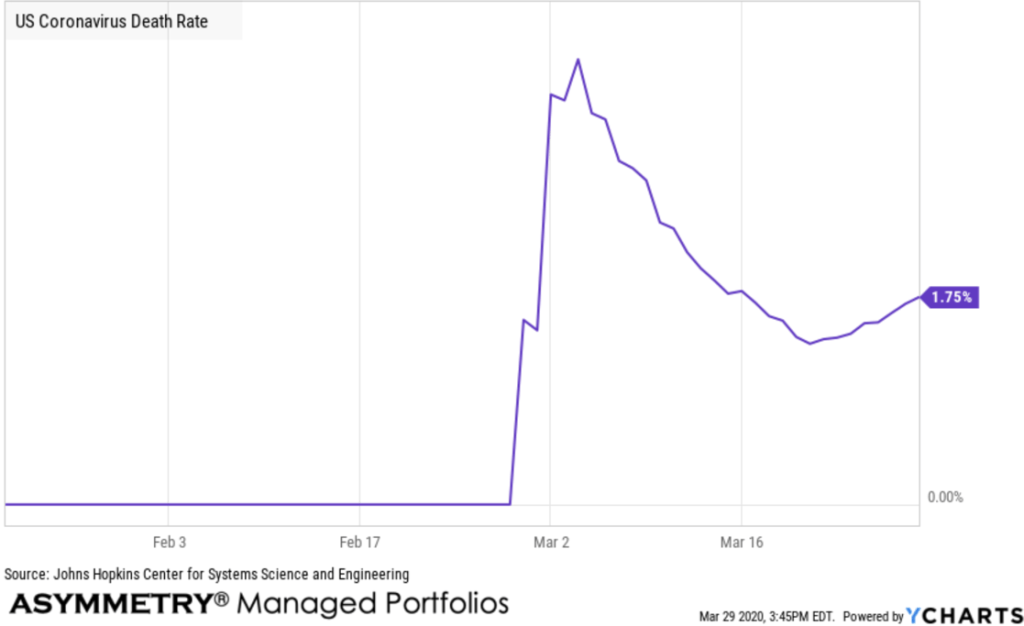
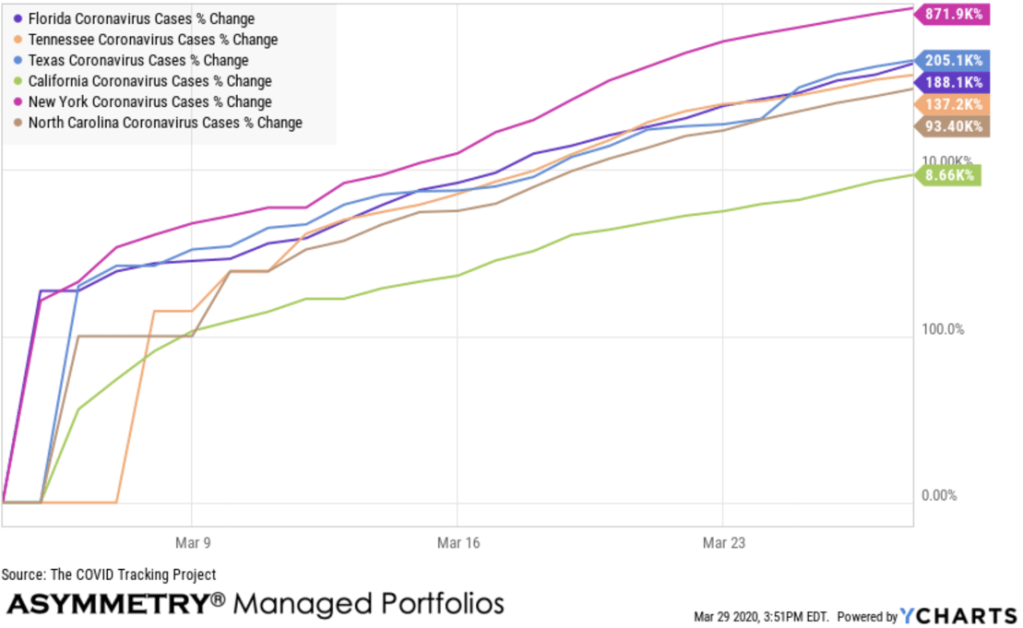
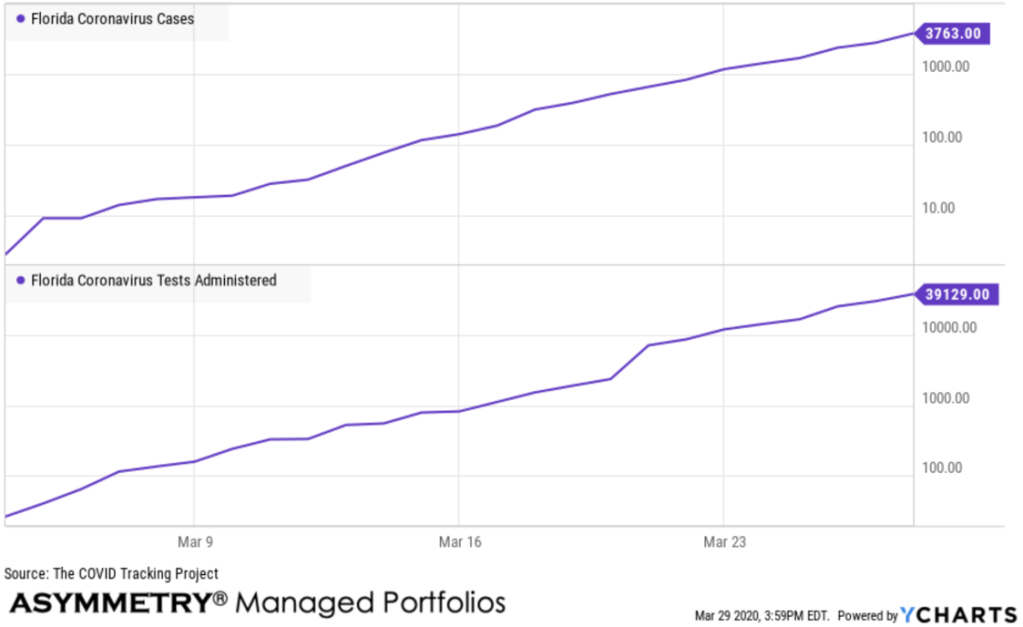
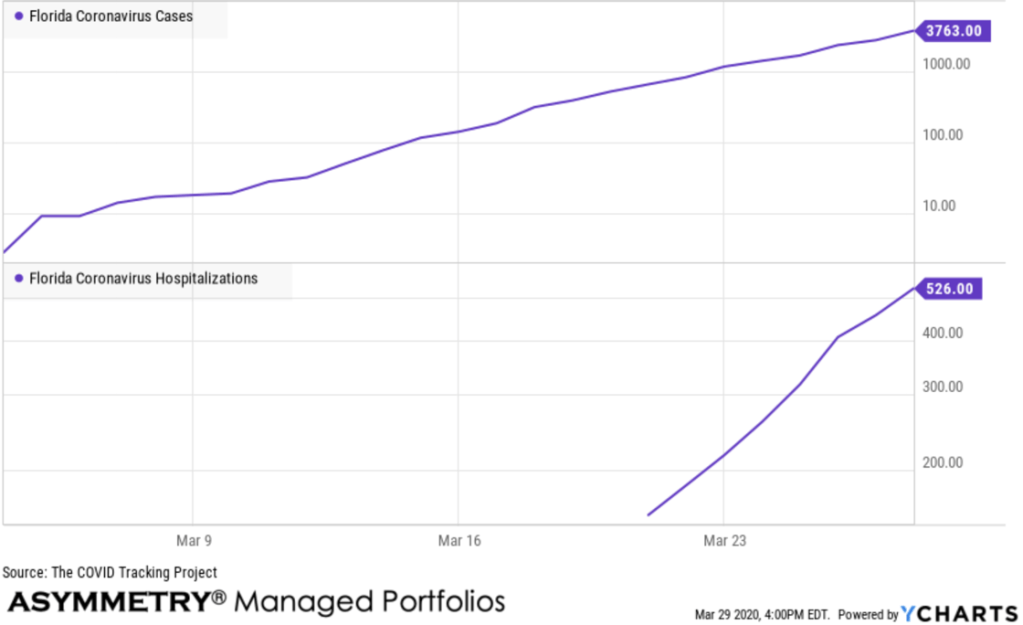
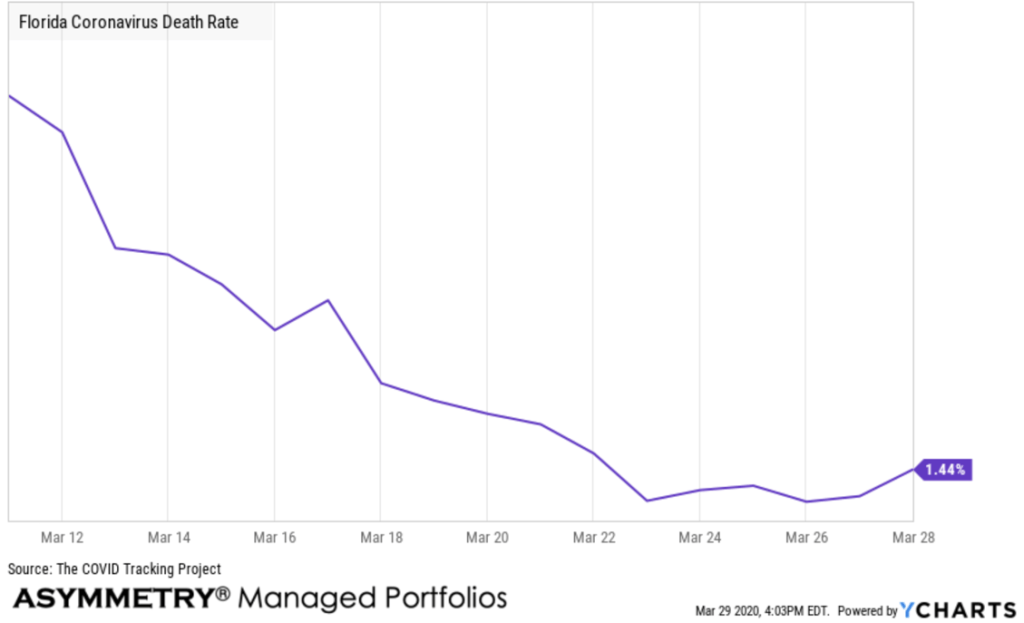
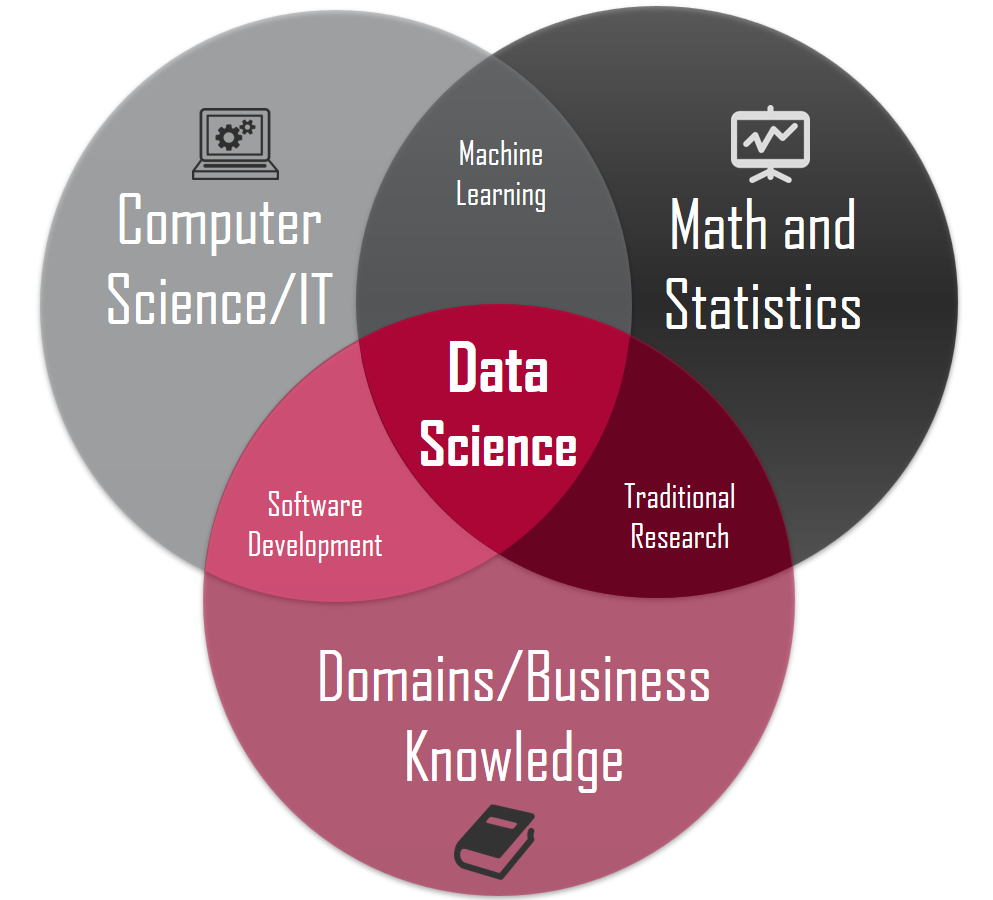
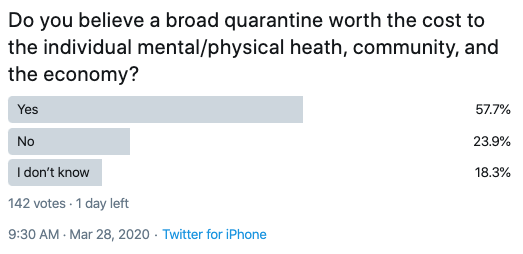
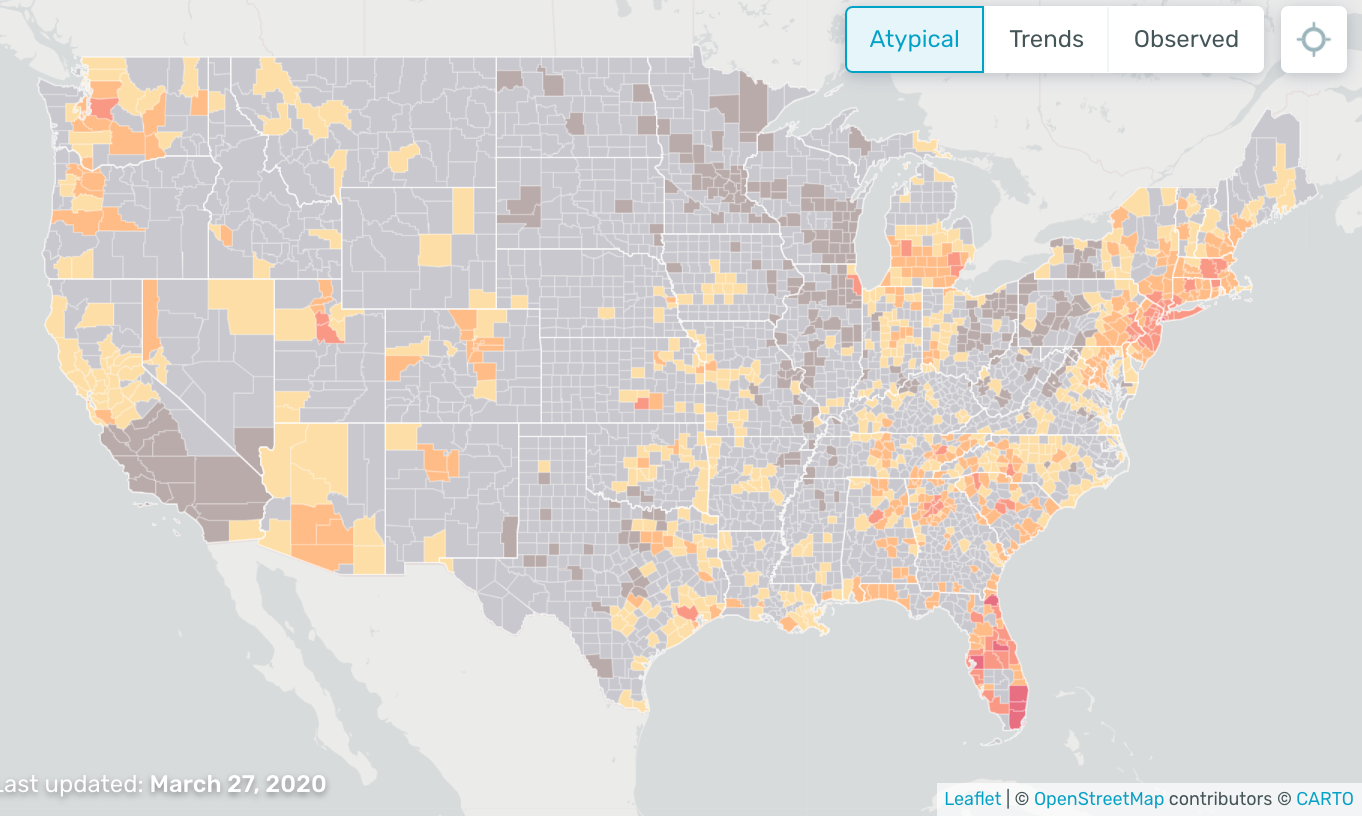
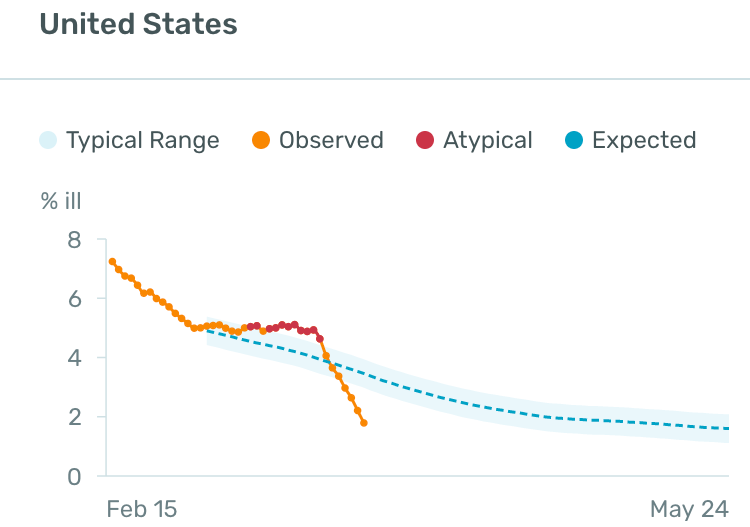

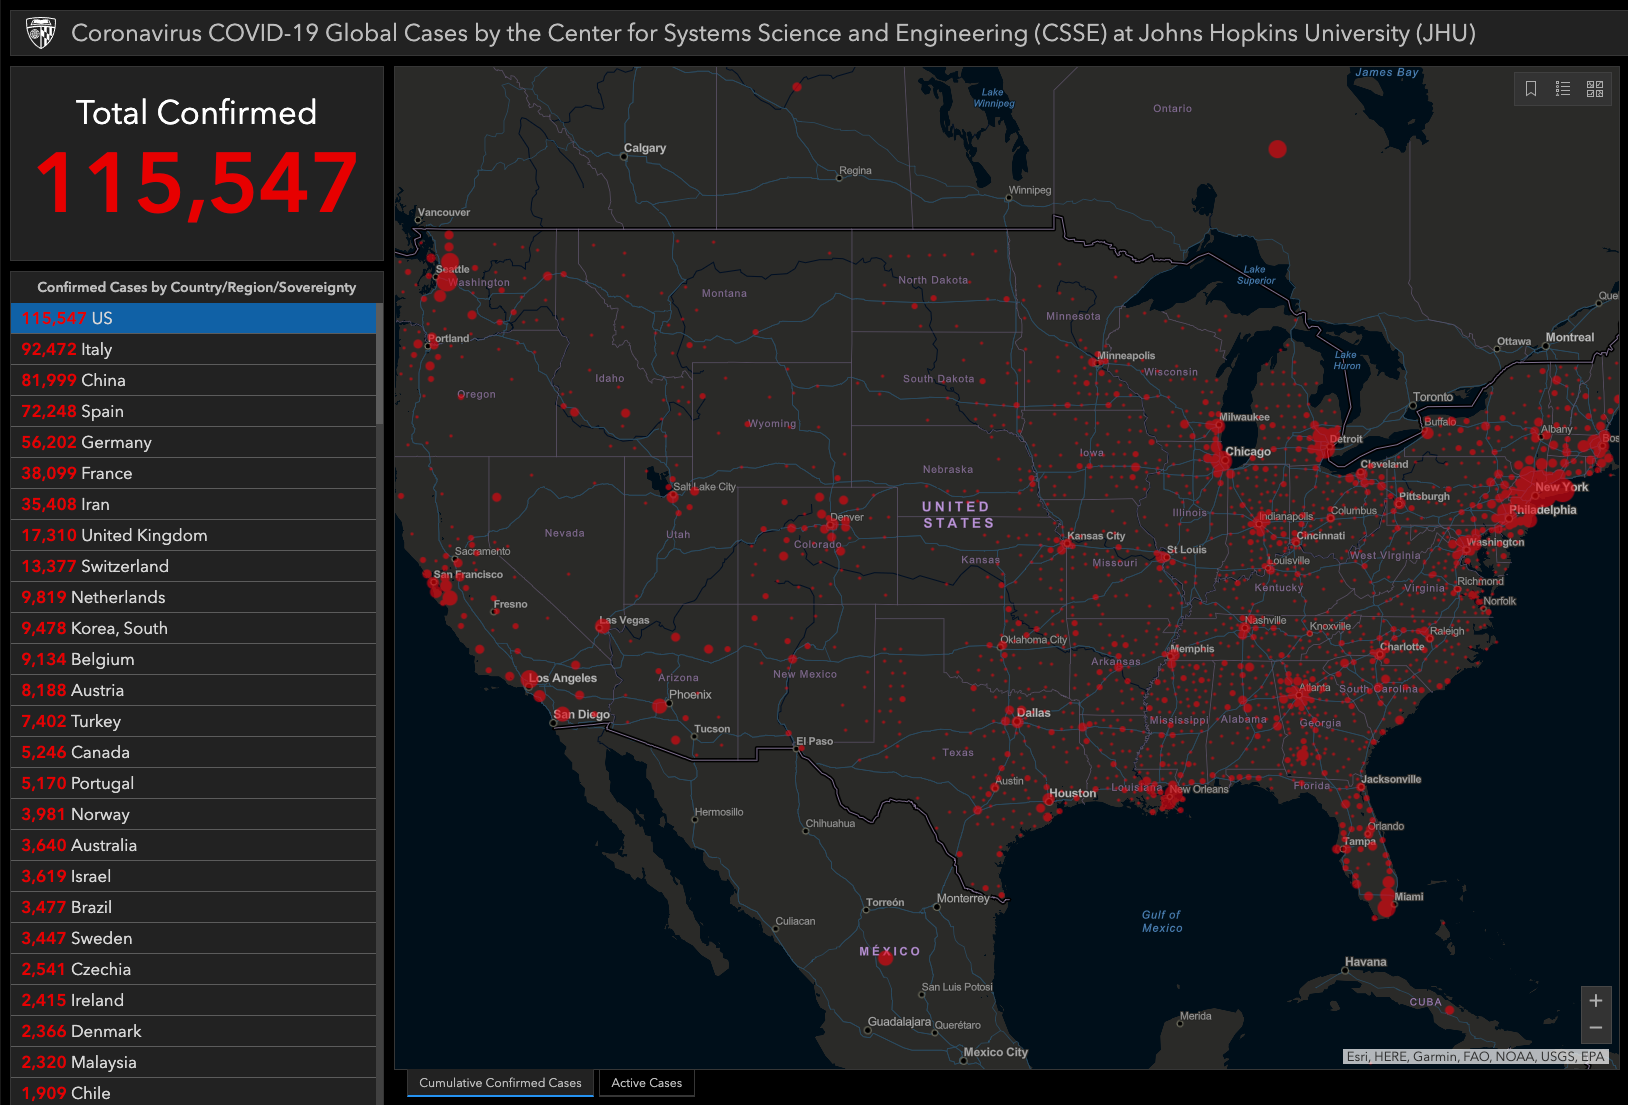
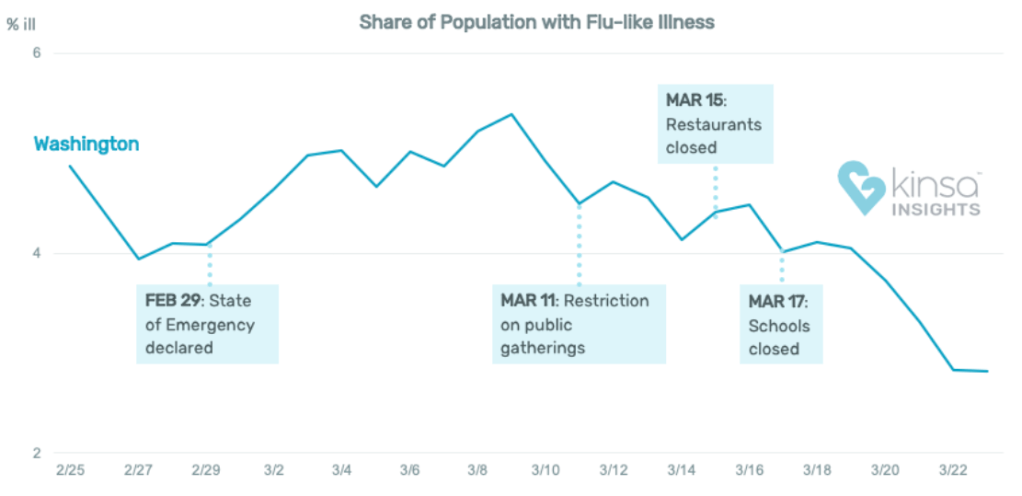
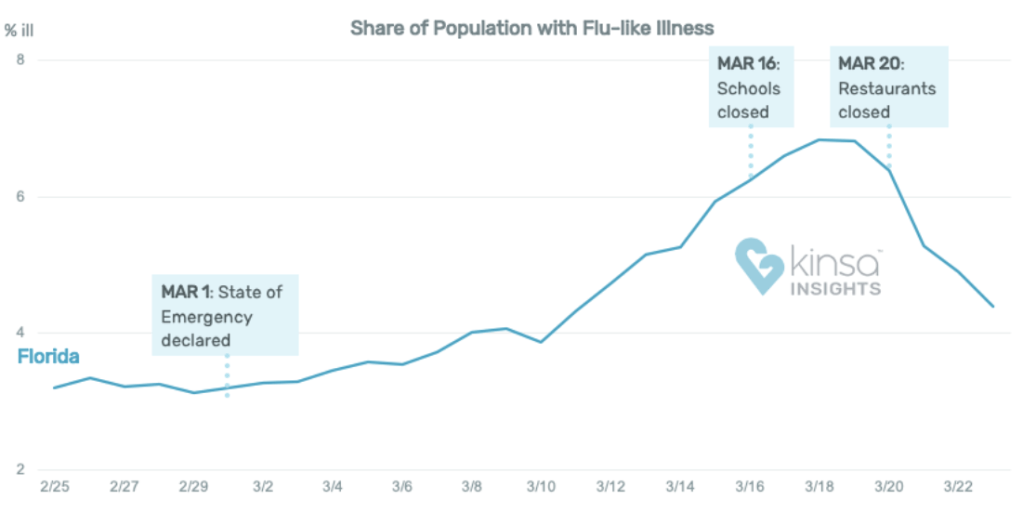
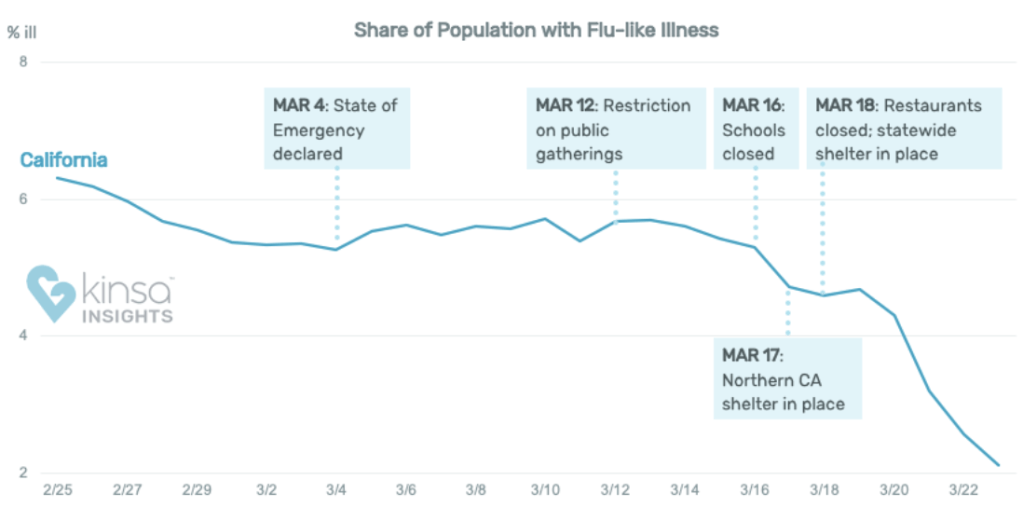


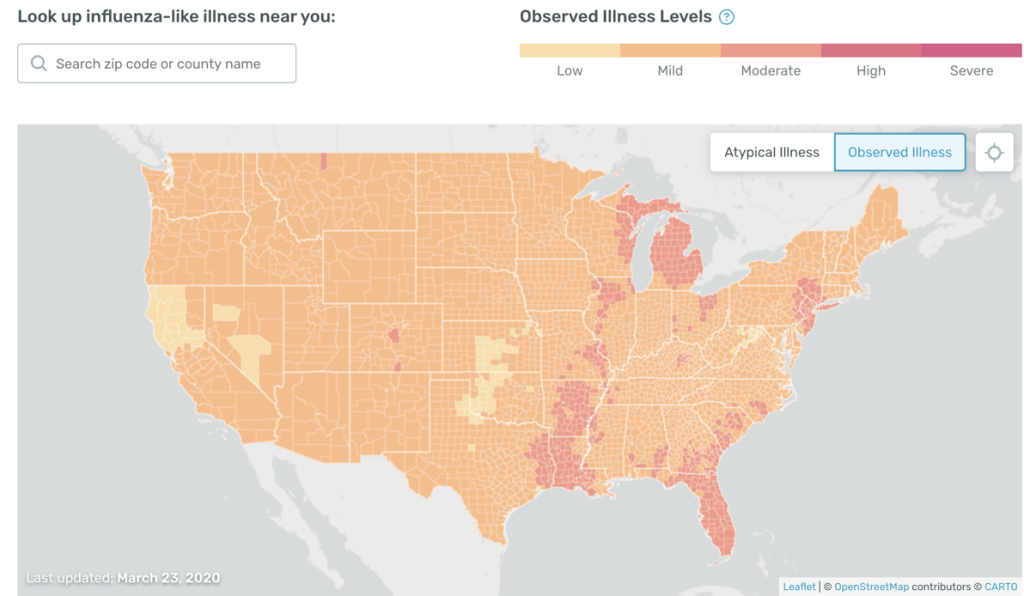
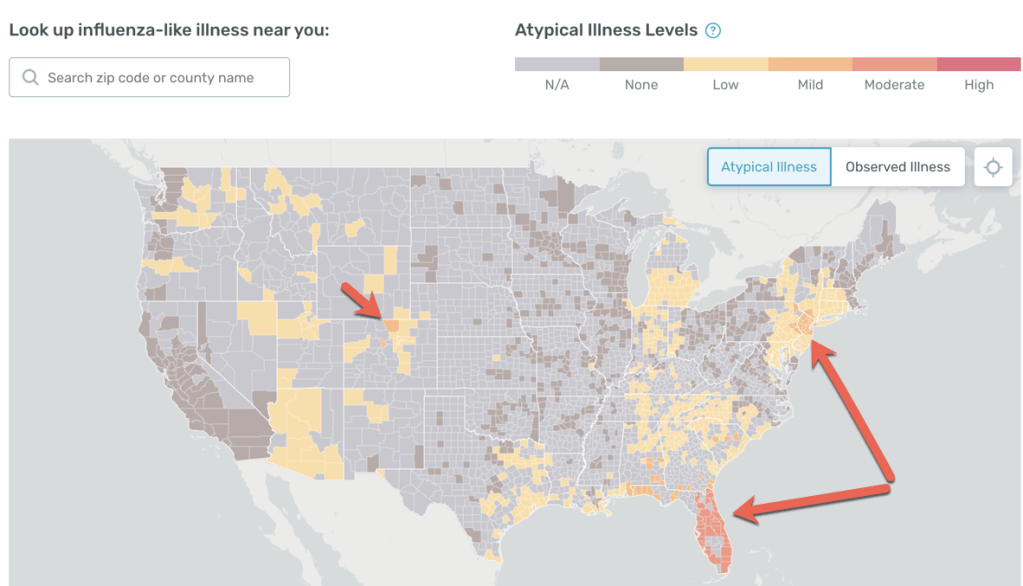
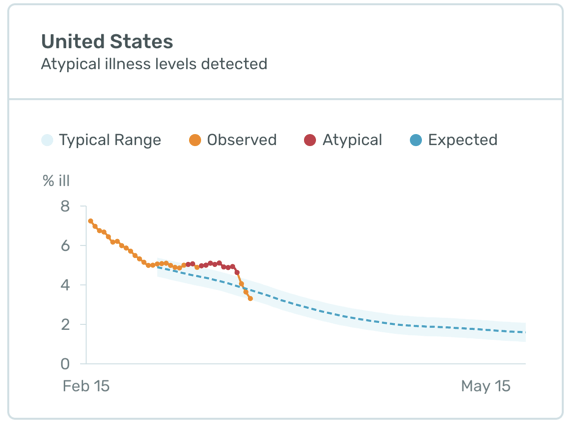
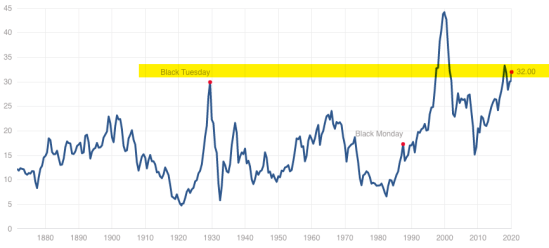
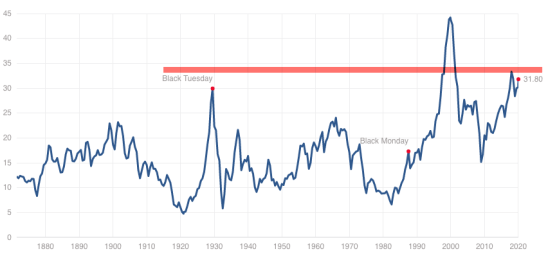
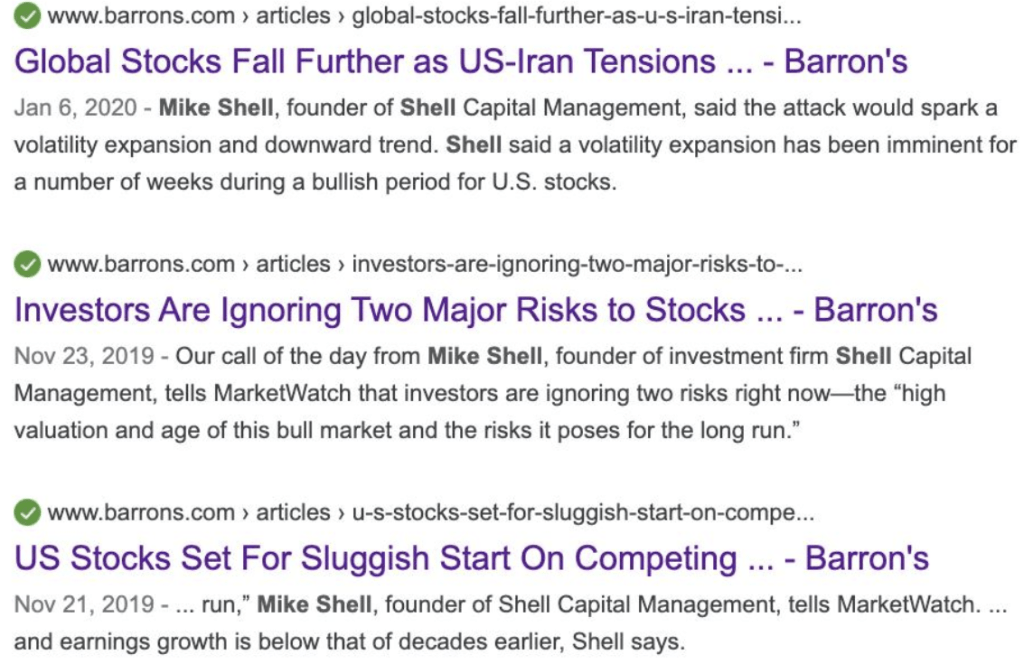
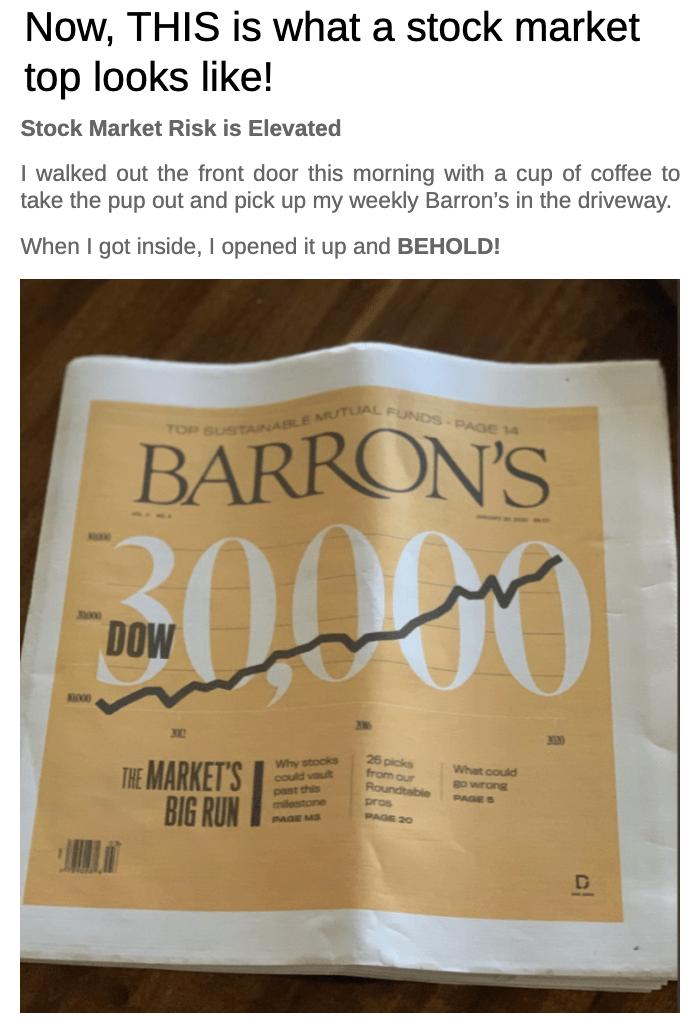
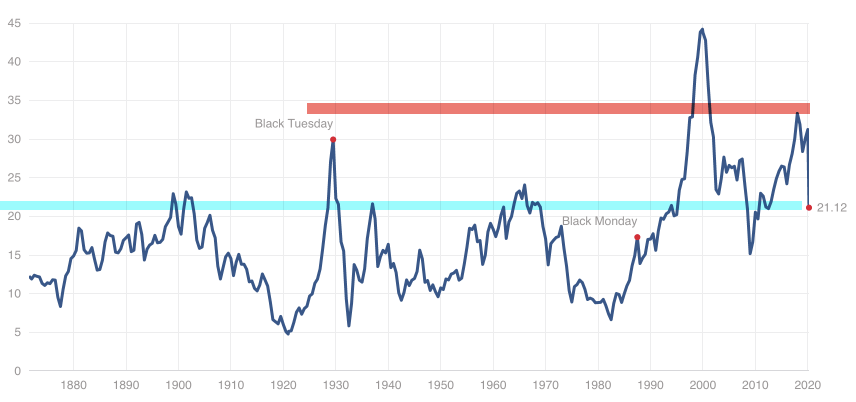
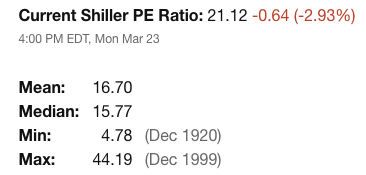
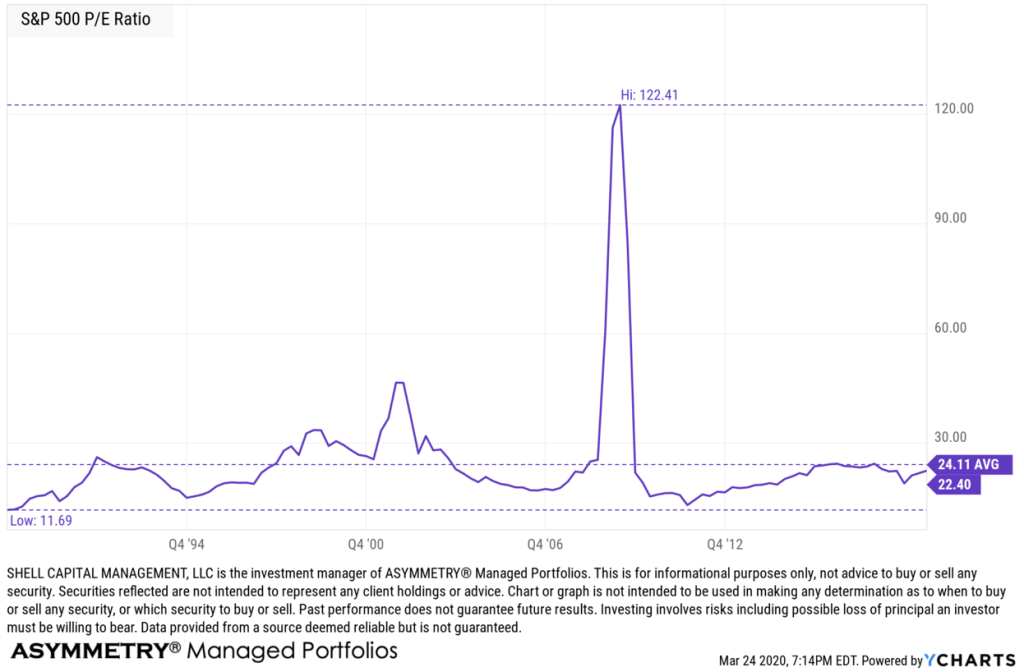
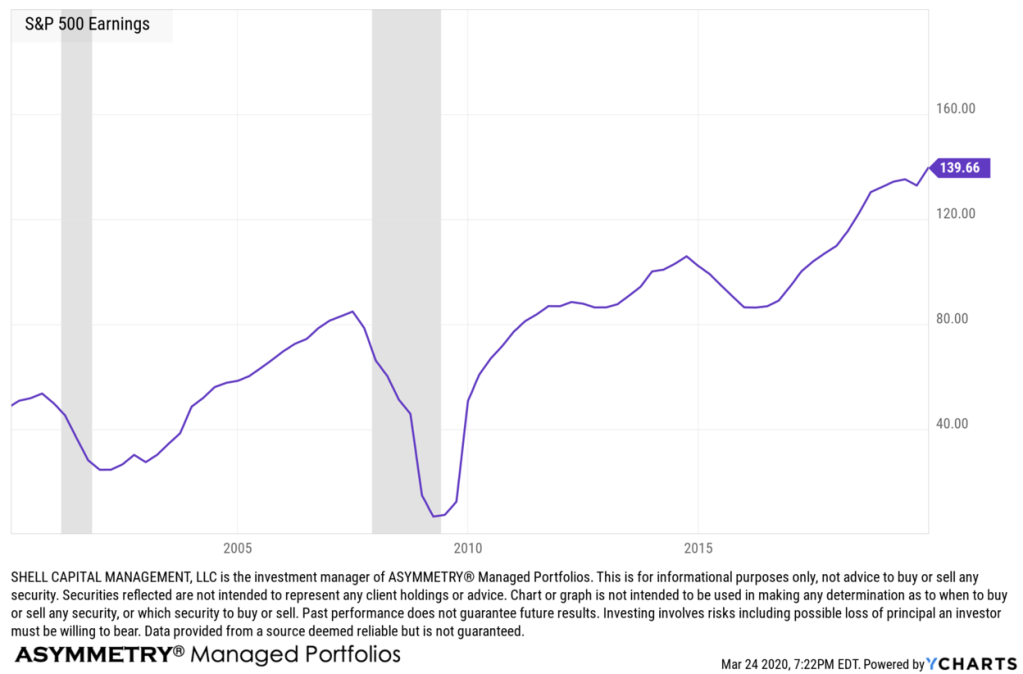
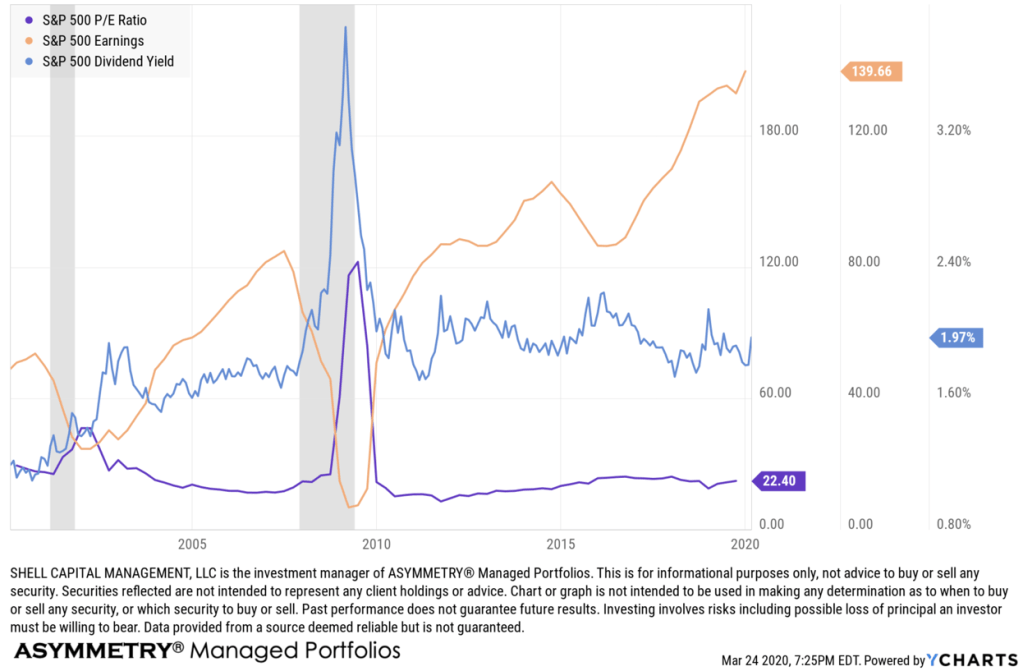
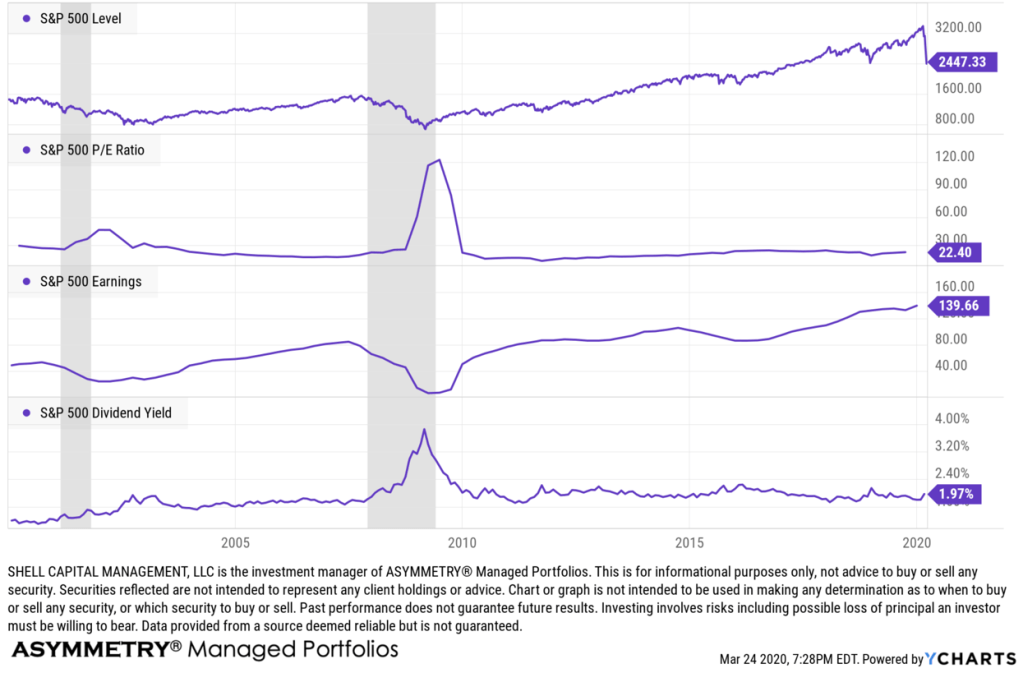

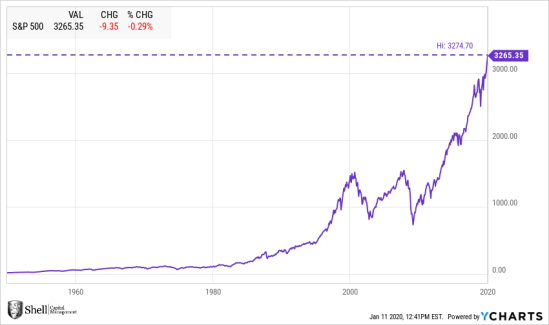


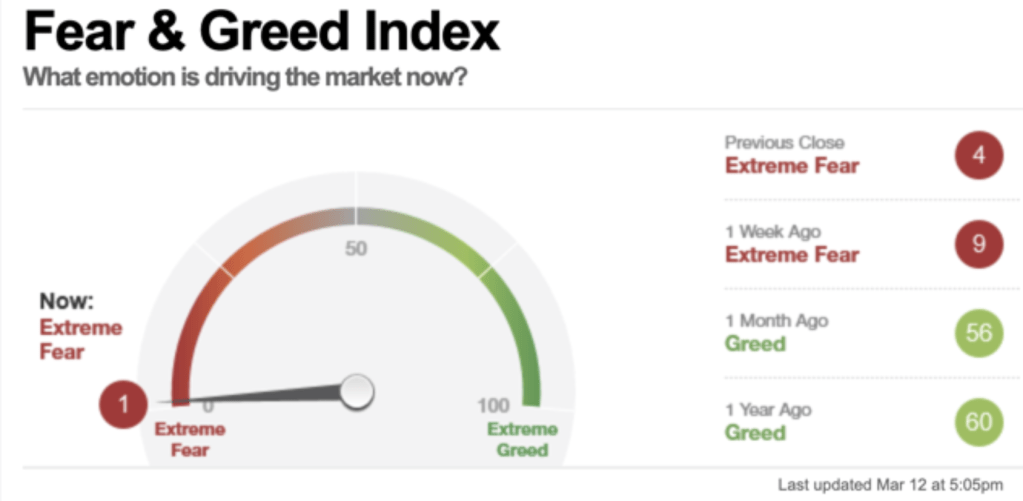


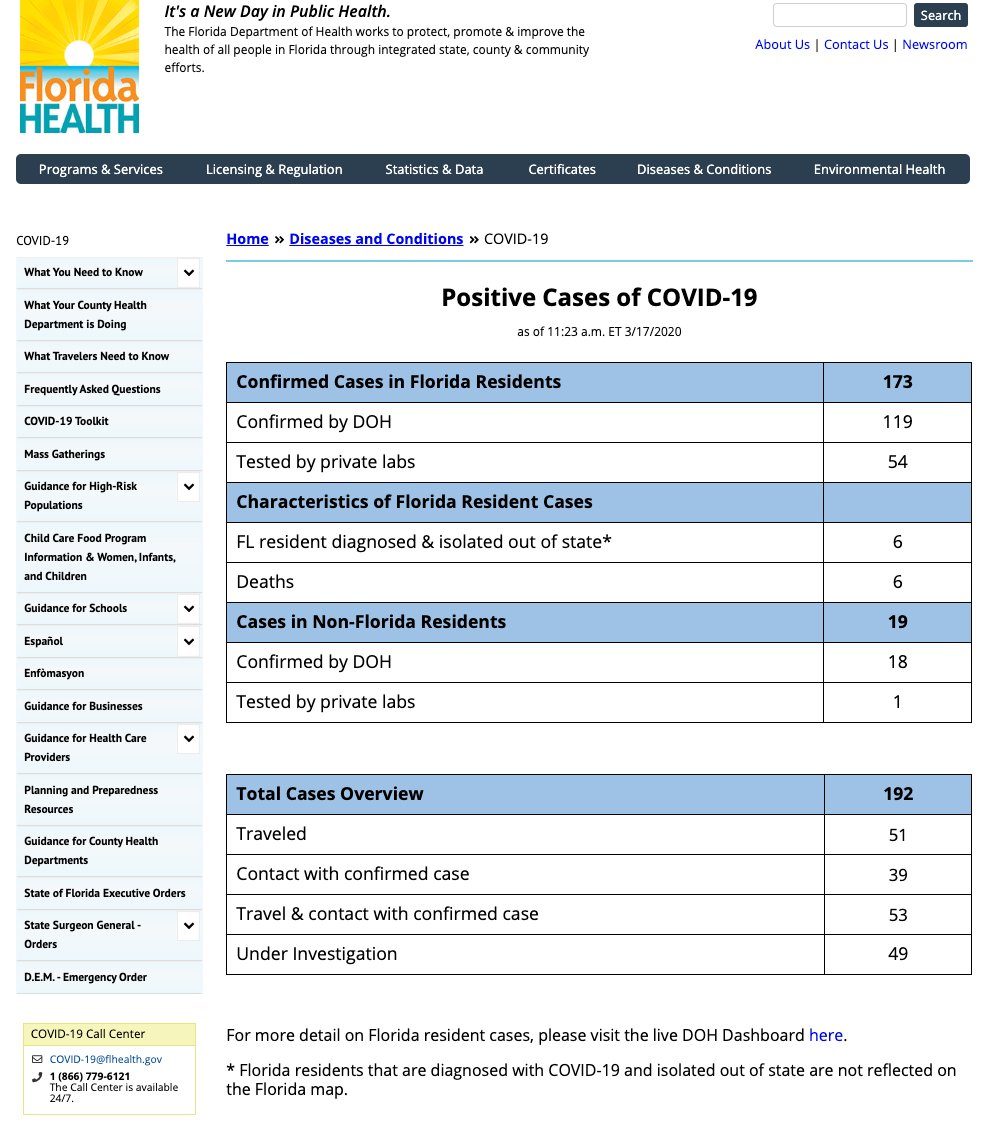


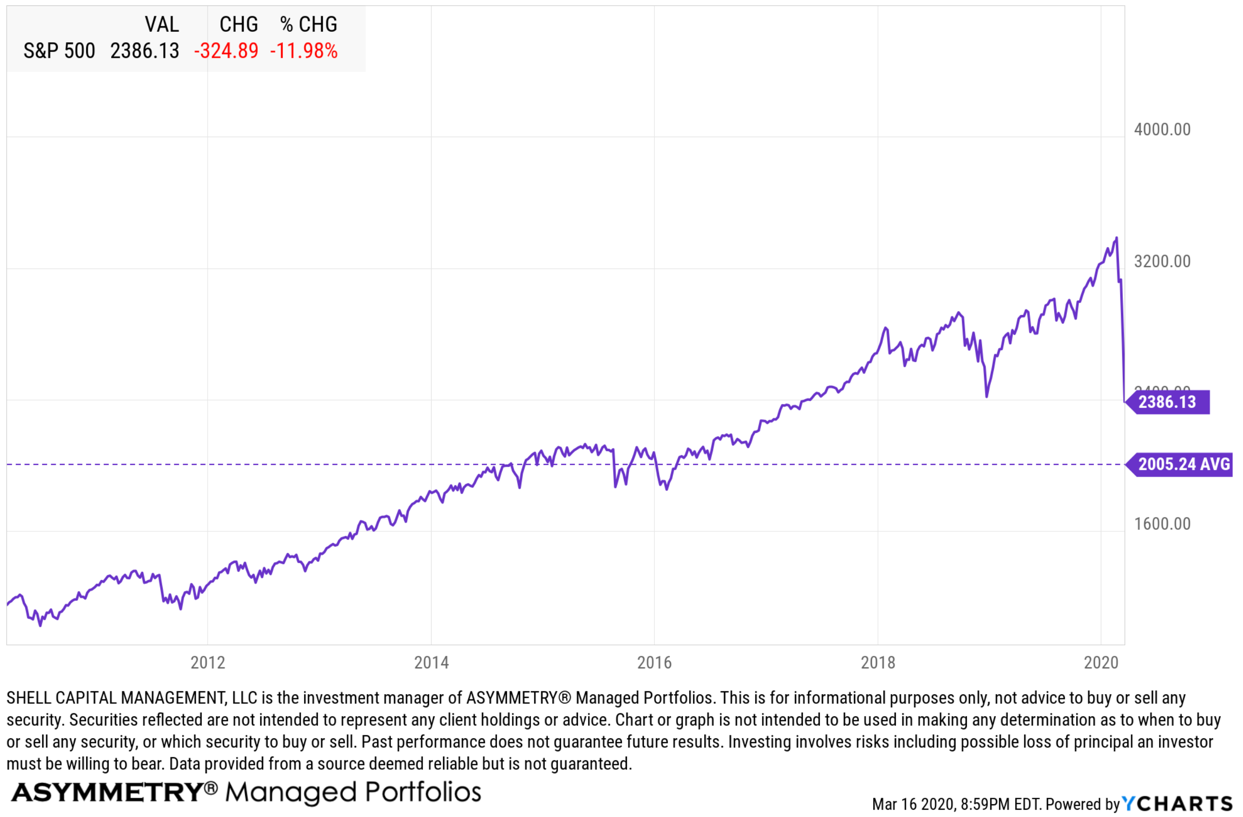

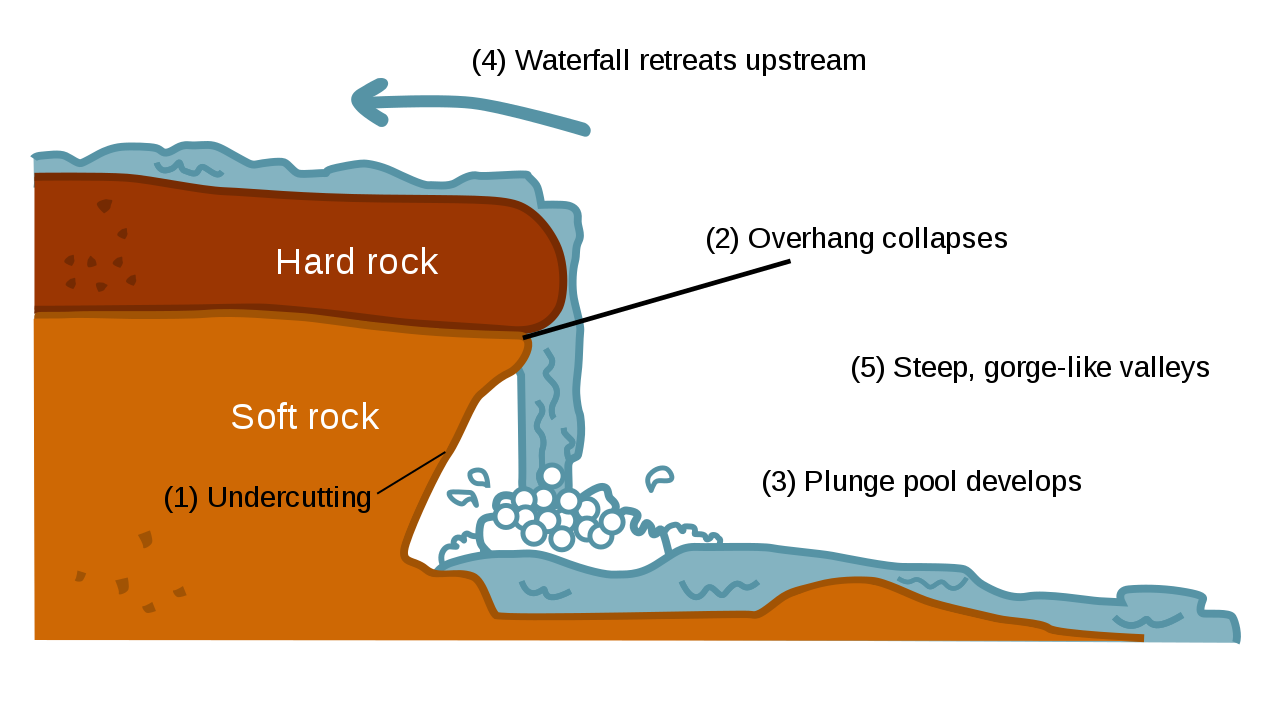 An overhang in a waterfall can sometimes protrude out enough to form a base, or even drive the water to flow upward for a while, but the waterfall isn’t over until the plunge pool develops.
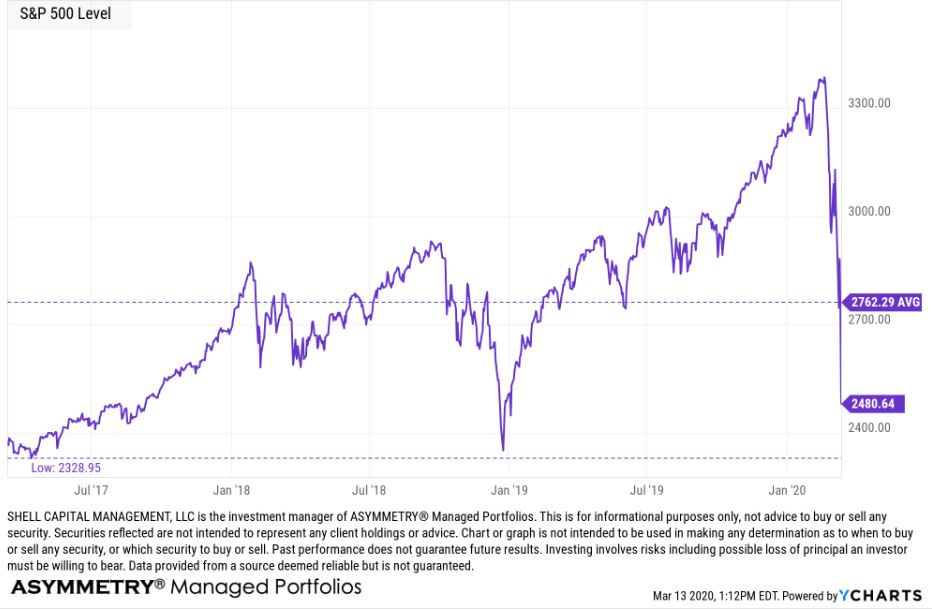
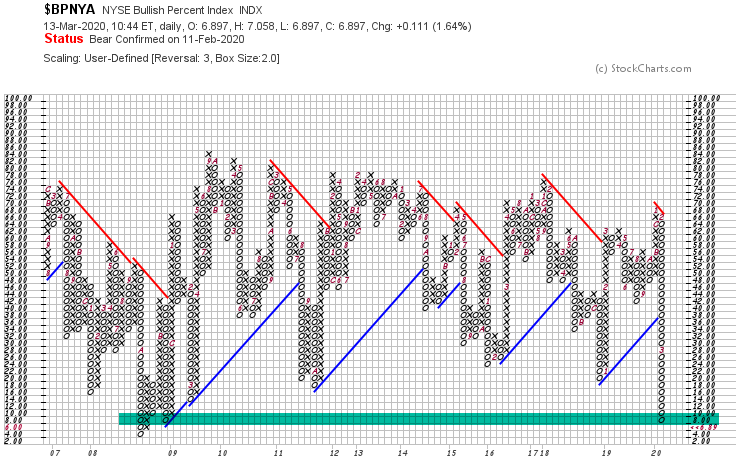
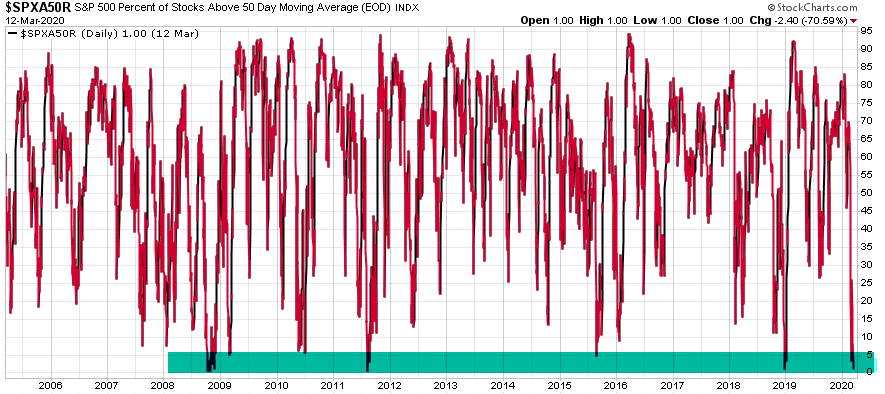

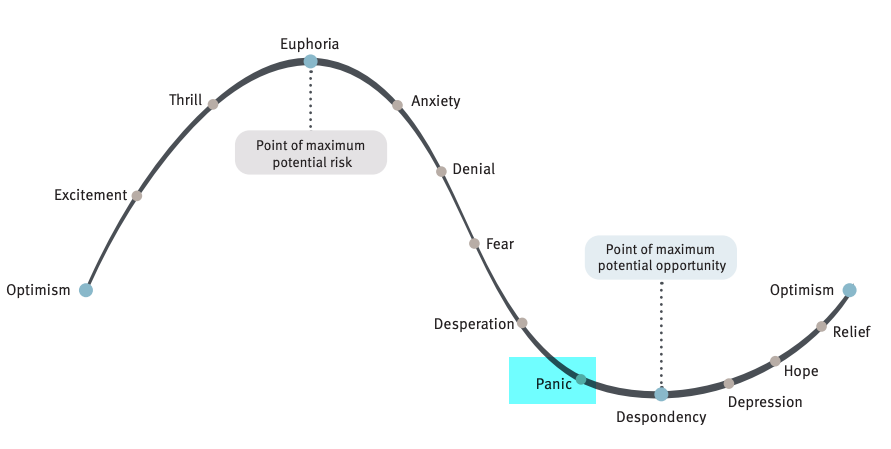

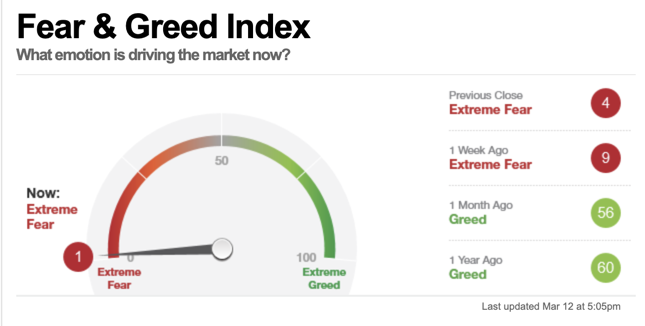


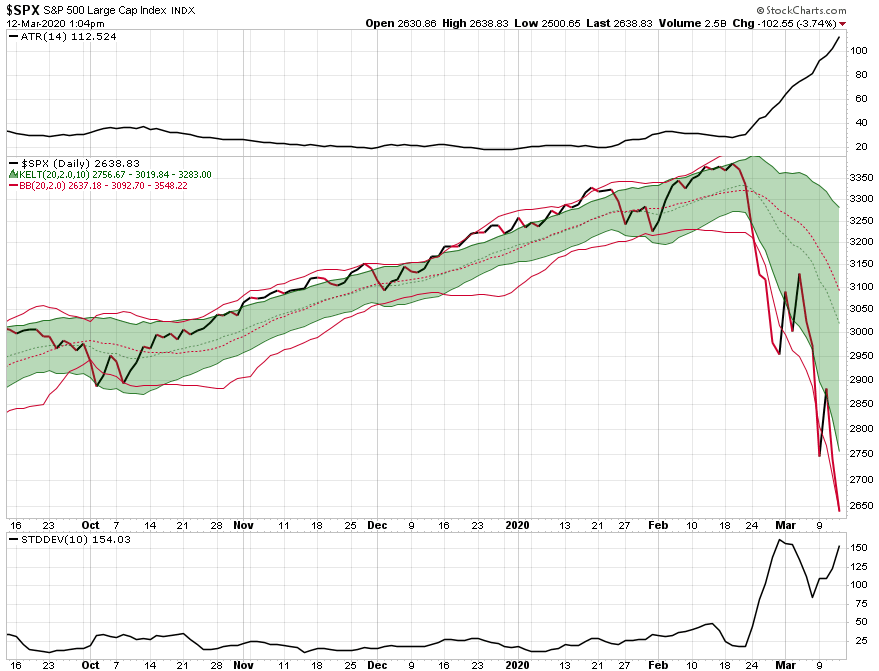

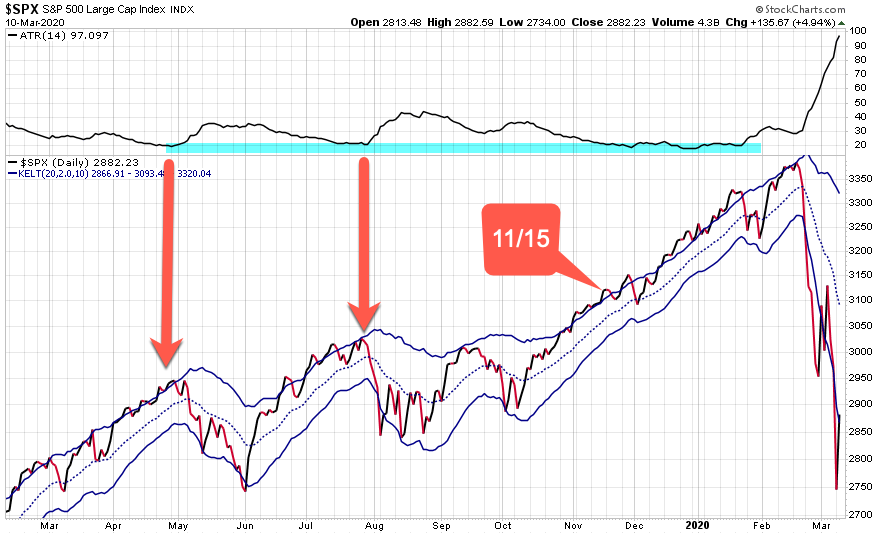
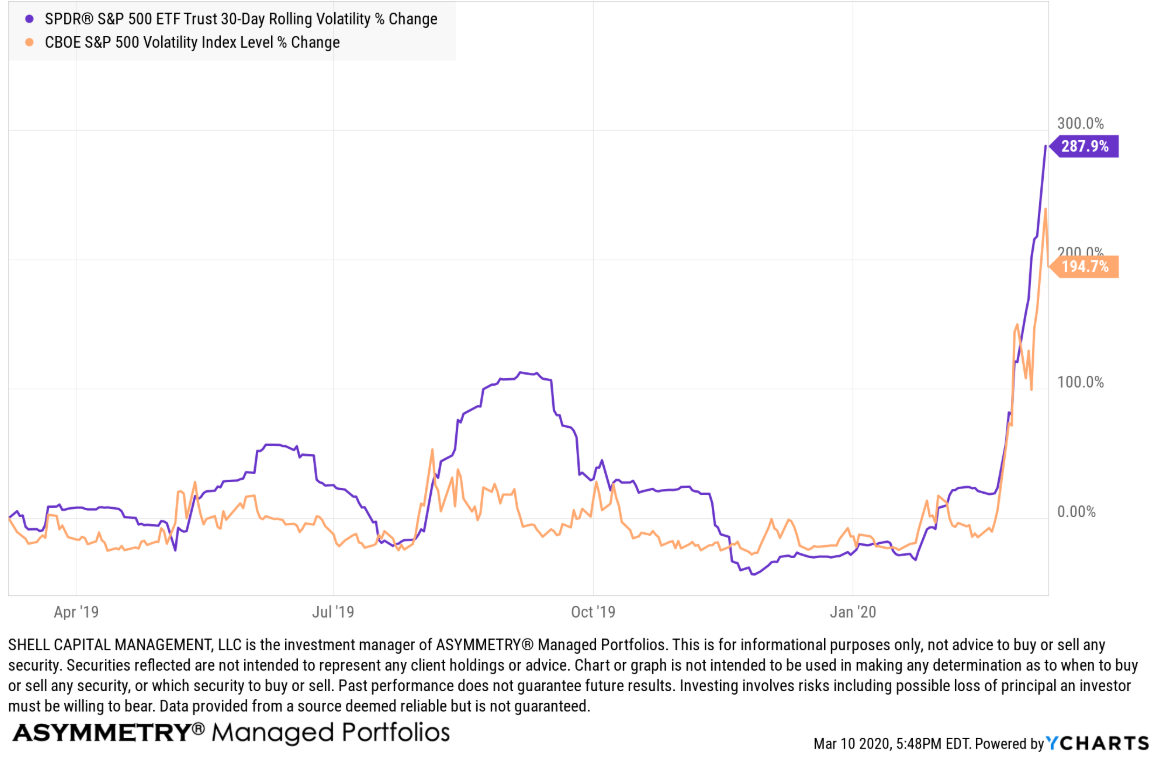
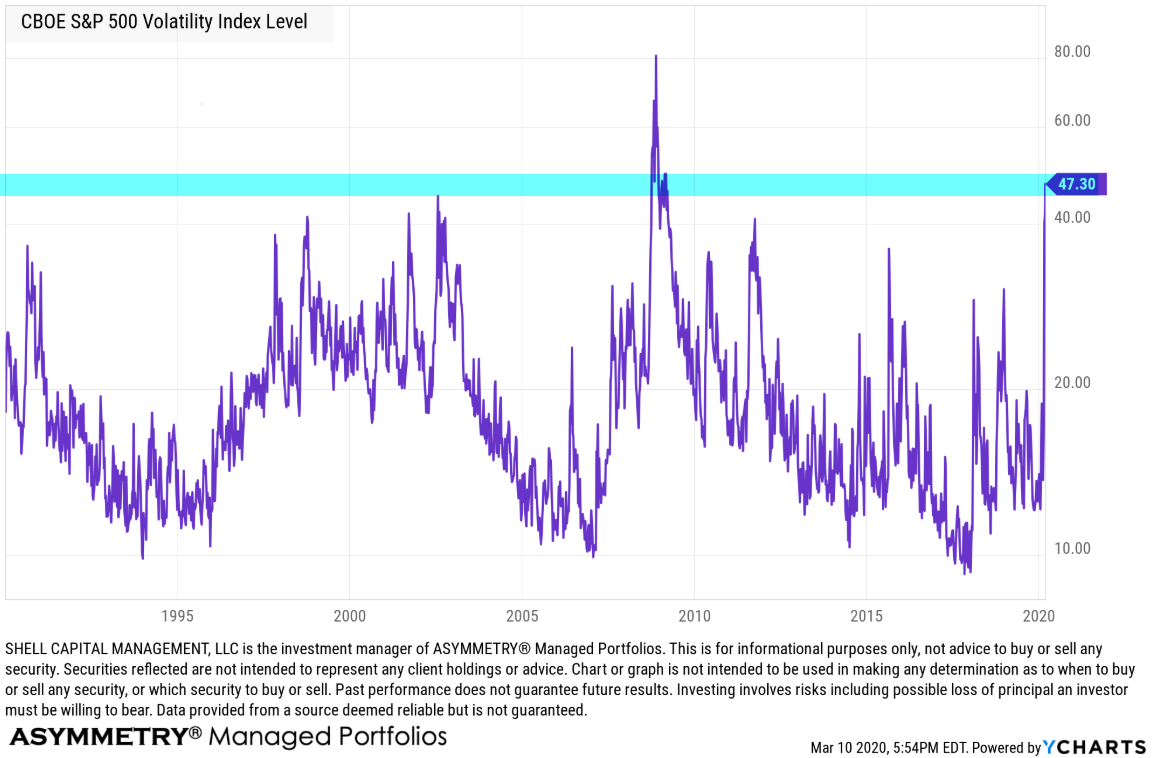
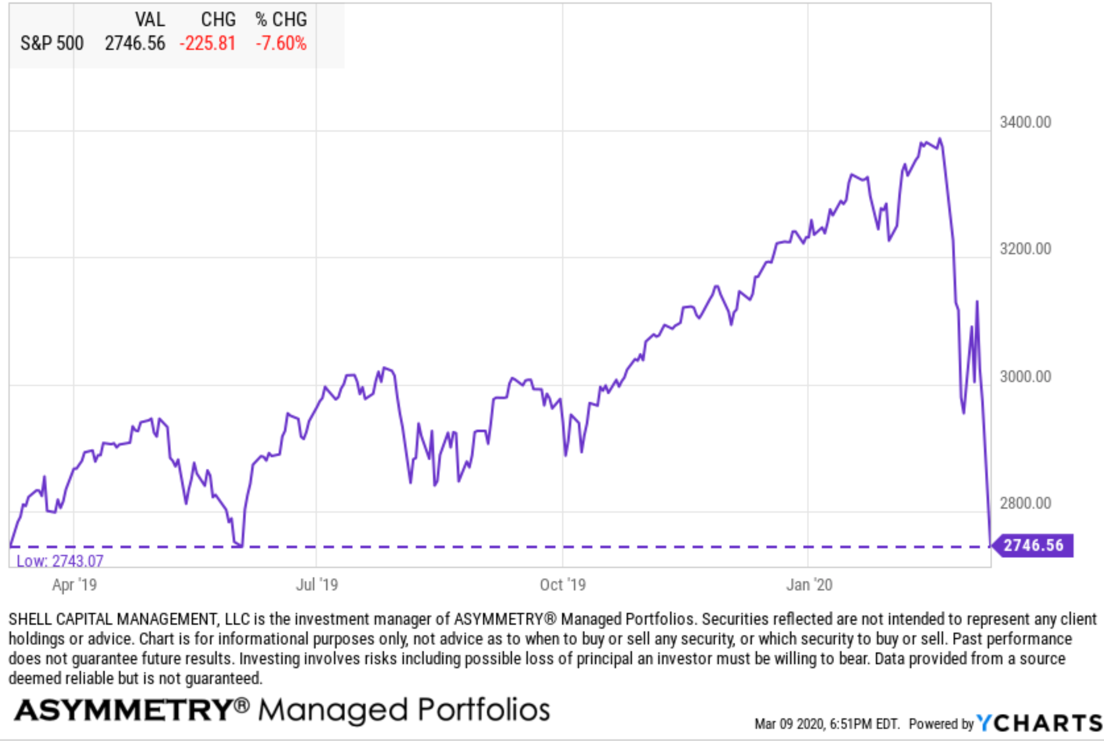
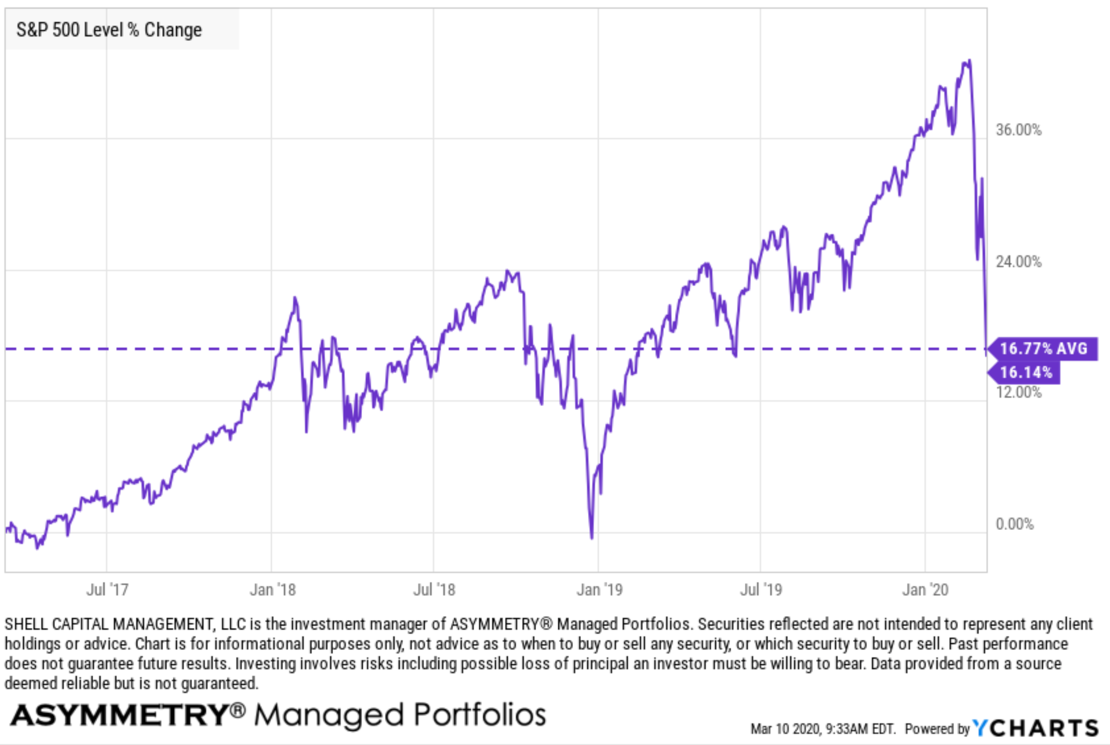
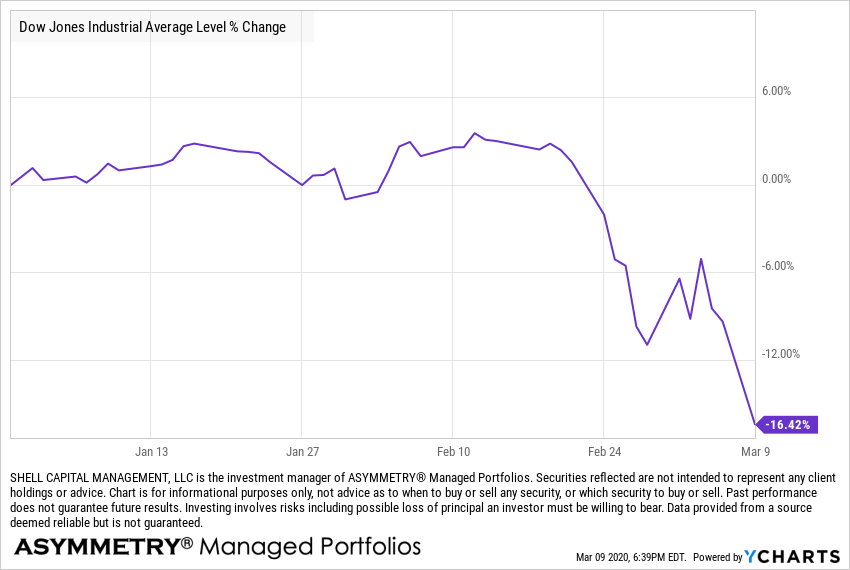


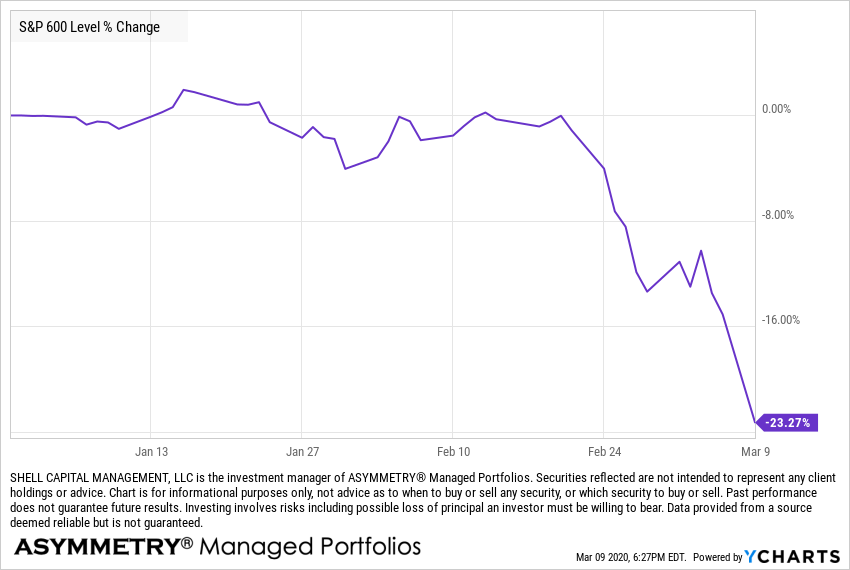

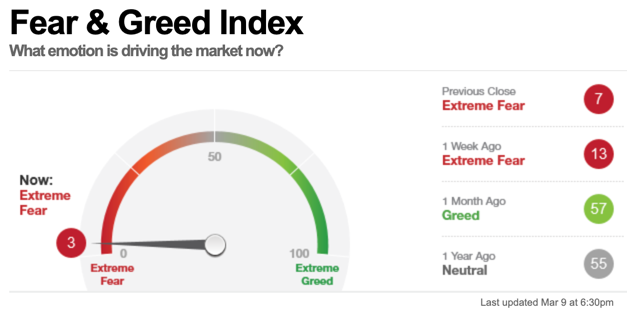
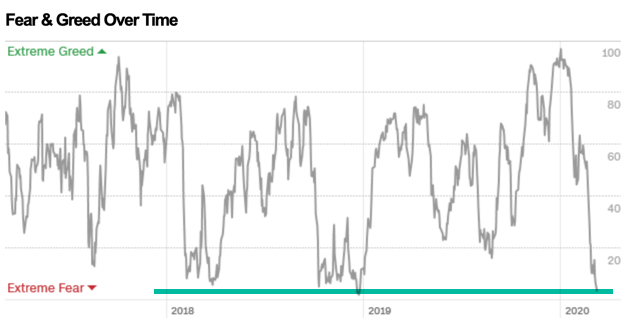

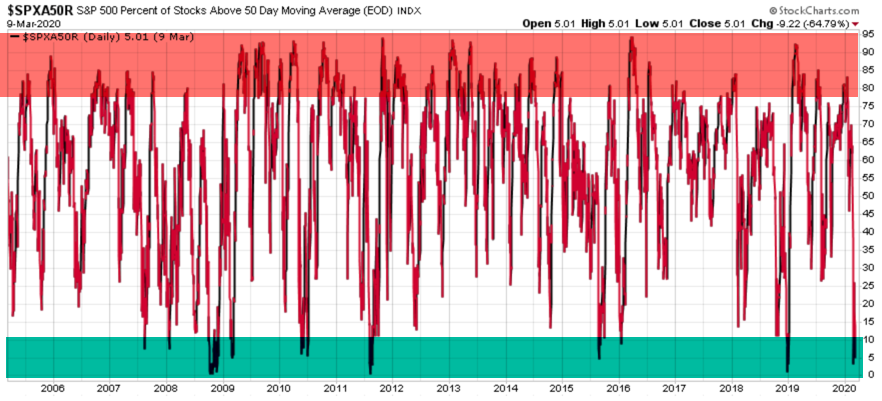

You must be logged in to post a comment.