Growing up in East Tennessee and the Great Smoky Mountains, I observed a lot of waterfalls.
Wiki says a fall of water is an area where water flows over a vertical drop or a series of steep declines in the course of a stream or river.
According to National Geographic, a waterfall is a river or other body of water’s steep fall over a rocky ledge into a plunge pool below. Waterfalls are also called cascades. The process of erosion, the wearing away of earth, plays an essential part in the formation of waterfalls.

What we have witnessed in the global equity markets is a waterfall decline, the question now is if the plunge pool has developed.
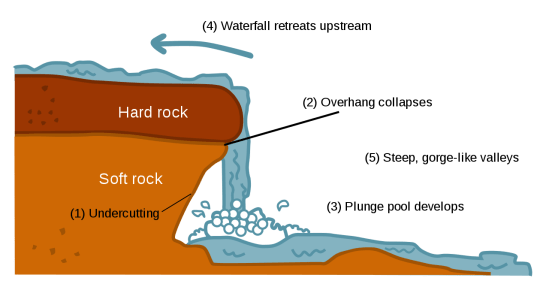 An overhang in a waterfall can sometimes protrude out enough to form a base, or even drive the water to flow upward for a while, but the waterfall isn’t over until the plunge pool develops.

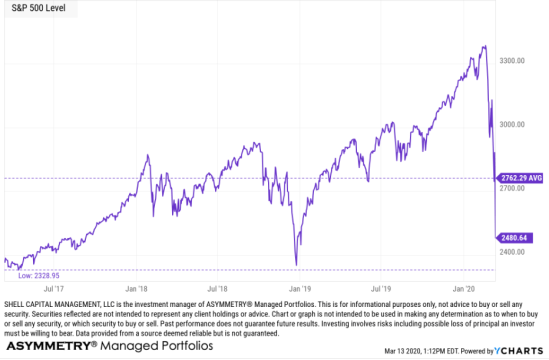
Using the S&P 500 stock index as a proxy, it’s pretty clear there wasn’t much of an overhang along the way. For example, in the middle of this 3-year chart, we see how the decline in late 2018 played out. It had a lot of overhangs as the stock market was swinging up and down for several weeks. Now, compare that to this time…
What we have here is panic selling.
Investors tend to underreact and overreact to new information.
Underreaction: Trends begin to drift in a direction as people initially underreact to change, so the price trend unfolds gradually.
Overreaction: Sometimes, investors overreact to new information, so the price is driven too far, too fast. When the market overreacts, prices overshoot too high, or too low.
At the bottom of a waterfall is a plunge pool, where the water settles. What does the plunge pool look like as it develops? It’s a floor that has enough support the water stays were it is.
The trouble is, in the market, we don’t physically see the rock bottom. Unlike in physical science, an exchange market is a social science because it’s human behavior. Don’t think this is humans? Maybe it’s the computer algorithms? They are created and operated by humans.
I apply quantitative tools to get a read on how extreme investor sentiment is.
In analyzing market trends and price action, we can see what is going on with market internals, such as breadth. The NYSE Bullish Percent was developed by Abe Cohen was the first breadth indicator. Abe Cohen was an early pioneer of Point & Figure charting and created the NYSE BP in the mid-1950s. The NYSE Bullish Percent is a market risk barometer that measures the percent of stocks listed on the New York Stock Exchange that have a Point & Figure buy signal, so they making higher highs, so they are in uptrends. The NYSE Bullish Percent is washed out. It hasn’t been this low since the waterfall decline in October 2008.

The challenge with countertrends is they can also trend farther than you would ever believe is possible. It’s because markets don’t follow a normal distribution. Instead, market trends have fat tails, meaning some gains and losses exceed an otherwise normal distribution, as we see in physical science. As such, the overreactions can overshoot and just keep overshooting. We never know for sure when a trend has stopped. What we can do, however, is apply quantitative tools to gauge and guide. I use these as a guide and barometer for overall market risk.
The percent of the S&P 500 stocks above the 50-day moving average is washed out to 1%. In fact, only 7 of the 505 stocks in the S&P 500 are in a short term uptrend. While in a big bear market such as 2008-09, these conditions can continue for a long time, historically, this lower level of risk eventually offers the potential for asymmetric risk/reward. That is, the possibility for reward is greater than the risk it takes the achieve it. Or, the magnitude for a reward is greater than the downside risk, which can be predetermined with options or an exit (i.e., stop-loss.)

A material change that has occurred the past week is the percent of S&P 500 stocks above their 200 day moving average, or longer-term uptrends have washed out. Only 5% of the stocks are in uptrends now, so 95% of them are in long term downtrends. That doesn’t sound good, but when it reaches an extreme, it suggests to me the selling pressure is intense and could eventually dry up.
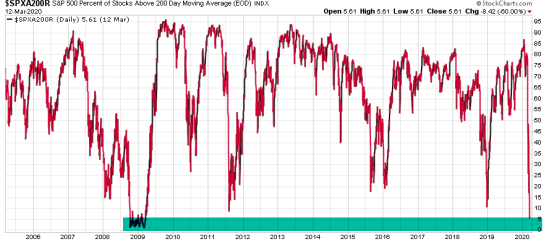
This is about as oversold the stock market gets, both internally looking at the individual stocks and the indexes. Sure, it can get more oversold and stay there for as long as sellers have the desire to sell, but it has reached the point the odds of a short term reversal is increasing the lower it goes.
Yesterday I asked: where do you think we are in the cycle of market emotions?
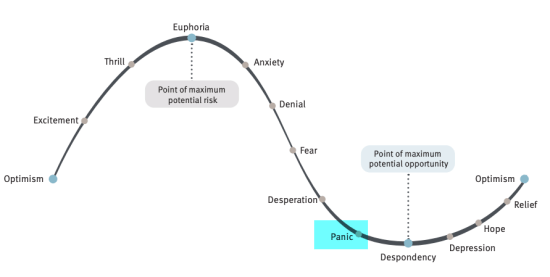
Clearly, when stock indexes drop 8-10% in a single day after already well off their highs, it is driven by emotional panic.
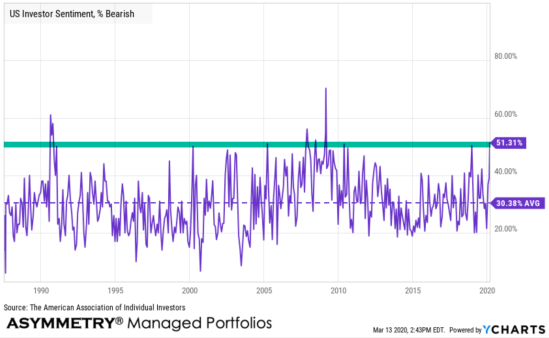
The US Investor Sentiment poll from AAII is released on a few day’s time lag, but Bearish % of those polled is another measure up to 2008-09 levels.
To no surprise, the Fear & Greed Index was penned all the way back to 1 after yesterday’s close.

What we have here is a washout. A washout is an event or period that is spoiled by constant or heavy rain. We may see more rain, but it’s a washout nonetheless. A washout in the stock market is when prices have been flooding down so hard, so broad, it seems like a washout of rain.
As you can imagine, with a waterfall, heavy rains increase the volume and speed of water flow. A washout pushes the river to its limits.
The desire to sell has been overwhelming any buying interest that remains for a few weeks now. This has been the fastest decline in US stock market history. I guess we shouldn’t be so surprised if we believe a trend stretched far in one direction is more prone to snap back harder and faster. That’s what we’ve seen here.
This is the end of the longest bear market in US history, and it has indeed ended with a bang. That also means this is the beginning of a bear market. What we don’t know in advance is how long it will last or how low it will go. If we knew it would be -50%, we could simply sell short and profit from the fall. If we knew this was “the bottom,” we could use leverage to maximize gains on the upside. But, none of us know the outcome in advance, not the biggest banks, not the largest asset managers, and neither you nor I. The edge I do have is accepting this reality and embracing it to the point I drove me to create risk management systems to limit the downside when I’m wrong and focus on the things I can control. I’ve operated tactically through periods like this many times before in the last two decades, so I’ll just do what I do, which means I’ll execute many entries and exits until we find the trend. In conditions like we’ve seen this year, they’ll be countertrends. Once trends do develop, they’ll be trend following.
What I’ve typically seen in past bear markets is many cycles up and down along the way. That isn’t what we’ve seen this time, so far. This reminds me more of September 11, 2001, after the World Trade Center was attacked. The difference is, the S&P 500 was already down about -17%, and since the planes hit the World Trade Center in New York, the NYSE was closed. The New York Stock Exchange remained closed until the following Monday. This was the third time in history that the NYSE experienced prolonged closure, the first time being in the early months of World War I[2][3] and the second being March 1933 during the Great Depression.
It may not play out this way this time, but countertrends should be expected. Here is what the stock market did after the exchange opened after September 11. The SPX dropped -12% quickly, but then investors become patriotic, and it recovered a few weeks later. Of course, this happened inside a bear market that started in 2000 and didn’t end until 2003.

Is this so different than 9/11? Of course, it is. Every new moment is always different. But, we’ve experienced these things before. I was much more of a rookie 20 years ago when I walked into my investment firm office to see the planes hit. It was an incredibly emotional and panicked time in American history. At the time, it wasn’t just the one attack, we wondered what would be next. It was the Pentagon, and another plane was hijacked. We didn’t know what to expect, it was uncertain. When would we be attacked again? Where? Would it wipe us out?
We didn’t know.
Portfolio managers and tactical traders must be here, now, in the present moment, not dwelling on the recent past, there will be time for that later when things are calm and quiet. But even then, we can’t do anything in the past, we can only do it now.
I hope this helps.
Mike Shell is the Founder and Chief Investment Officer of Shell Capital Management, LLC, and the portfolio manager of ASYMMETRY® Global Tactical. Mike Shell and Shell Capital Management, LLC is a registered investment advisor in Florida, Tennessee, and Texas. Shell Capital is focused on asymmetric risk-reward and absolute return strategies and provides investment advice and portfolio management only to clients with a signed and executed investment management agreement. The observations shared on this website are for general information only and should not be construed as advice to buy or sell any security. Securities reflected are not intended to represent any client holdings or any recommendations made by the firm. I observe the charts and graphs to visually see what is going on with price trends and volatility, it is not intended to be used in making any determination as to when to buy or sell any security, or which security to buy or sell. Instead, these are observations of the data as a visual representation of what is going on with the trend and its volatility for situational awareness. I do not necessarily make any buy or sell decisions based on it. Any opinions expressed may change as subsequent conditions change. Do not make any investment decisions based on such information as it is subject to change. Investing involves risk, including the potential loss of principal an investor must be willing to bear. Past performance is no guarantee of future results. All information and data are deemed reliable but is not guaranteed and should be independently verified. The presence of this website on the Internet shall in no direct or indirect way raise an implication that Shell Capital Management, LLC is offering to sell or soliciting to sell advisory services to residents of any state in which the firm is not registered as an investment advisor. The views and opinions expressed in ASYMMETRY® Observations are those of the authors and do not necessarily reflect a position of Shell Capital Management, LLC. The use of this website is subject to its terms and conditions.

You must be logged in to post a comment.