After yesterday’s close, the popular stock market indexes, including the S&P 500, Dow Jones Industrial Average, and NASDAQ were down around -3% for the day.

Adding volatility bands around the price trend and its 20 day moving average illustrates a volatility expansion as prices have spread out to a wider trading range. The S&P 500 stock index traded below its lower volatility band, which expands as the price action becomes volatile. Volatility bands and channels help to answer: Are prices high or low on a short term relative basis? The recent price action is relatively high at the upper band and low at the lower band. By the way, I observe the charts and graphs to visually see what is going on with price trends and volatility, it is not intended to be used in making any determination as to when to buy or sell any security, or which security to buy or sell. Instead, these are observations of the data as a visual representation of what is going on with the trend and its volatility for situational awareness. I do not necessarily make any buy or sell decisions based on it.
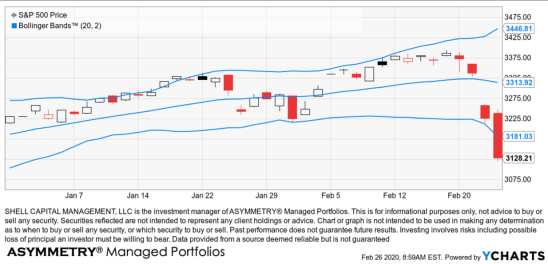
At this point, the stock index has traded below its band, demonstrating panic level selling pressure outside what I consider a normal range of price action.
Volatility channels are even more useful when combined with other indicators for confirmation. Next, I add a momentum measure for confirmation the index is oversold on a short-term basis. It can get more oversold, but a short term reversal now becomes likely if the desire to sell has become exhausted.
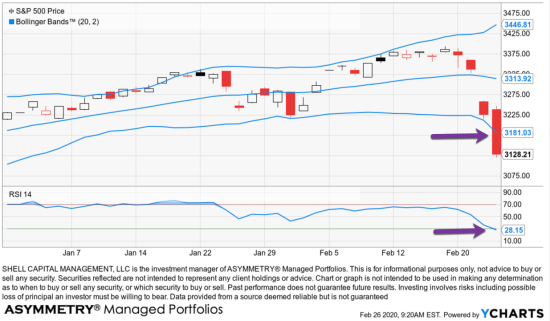
The potential good news for those with exposure to loss, in the short term, we may see a countertrend move back up to retrace some of the stock market losses. However, this will be the test to see if selling pressure has been exhausted or if prices have been driven down low enough to attract sufficient buying interest to push the price trends back up.
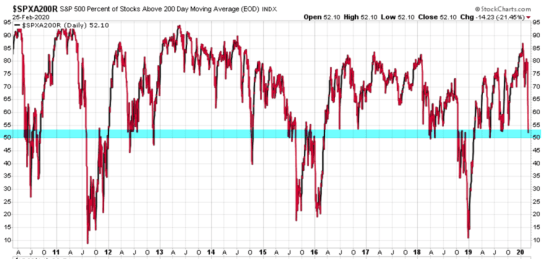
Another observation I’ll share is after the close, we recalculated the percent of S&P 500 stocks above their 200 day moving average using the end of day prices. The percent of stocks above their 200 day moving average is now at the 50-yard line, whit bout half of the SPX stocks in a longer-term uptrend and a half in a downtrend. Obviously, that’s more stocks now below the trend line than when I shared it yesterday.
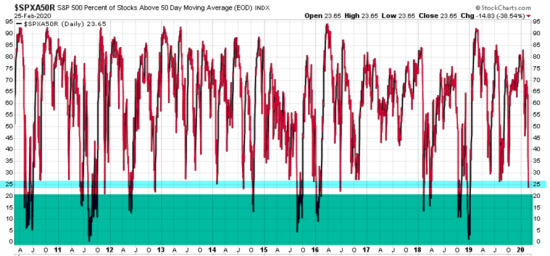
A more significant decline is seen in the percent of stocks above their 50-day moving averages, which fell 38% to only 23% of S&P 500 stocks trading above their shorter-term moving average trend line.
So, at least on a short term basis, selling pressure has pushed stocks down to the point more are in downtrends than uptrends.
Next, we’ll see if sellers have pushed prices low enough to attract significant buying demand. I expect to see at least a short term countertrend back up, as investors overreacted to the downside, but only time will tell if any countertrend up is sustainable long term. My longer-term indicators are neutral at this point, so there could be more selling if investors and traders anchor to prior highs wishing they’d sold previously and sell into an uptrend.
My objective is asymmetric returns, so I focus on asymmetric risk-reward. After prices seem to trend up too far, too fast, by my quantitative mathematical calculations, the asymmetric returns from future prices are limited, and the asymmetric risk is increased. After prices seem to fall too far, too fast, by my quantitative mathematical calculations, the asymmetric risk-reward profile becomes more positive. And, all of it is probabilistic, none of it is ever a sure thing.
It’s a process, not an event.
As I shared yesterday; Stock prices may not be finished falling, but some opportunities for asymmetric risk-reward may be present for those willing to take risks.
Need help? Contact us here.
Mike Shell is the Founder and Chief Investment Officer of Shell Capital Management, LLC, and the portfolio manager of ASYMMETRY® Global Tactical. Mike Shell and Shell Capital Management, LLC is a registered investment advisor in Florida, Tennessee, and Texas focused on asymmetric risk-reward and absolute return strategies and provides investment advice and portfolio management only to clients with a signed and executed investment management agreement. The observations shared on this website are for general information only and should not be construed as advice to buy or sell any security. Securities reflected are not intended to represent any client holdings or any recommendations made by the firm. I observe the charts and graphs to visually see what is going on with price trends and volatility, it is not intended to be used in making any determination as to when to buy or sell any security, or which security to buy or sell. Instead, these are observations of the data as a visual representation of what is going on with the trend and its volatility for situational awareness. I do not necessarily make any buy or sell decisions based on it. Any opinions expressed may change as subsequent conditions change. Do not make any investment decisions based on such information as it is subject to change. Investing involves risk, including the potential loss of principal an investor must be willing to bear. Past performance is no guarantee of future results. All information and data are deemed reliable but is not guaranteed and should be independently verified. The presence of this website on the Internet shall in no direct or indirect way raise an implication that Shell Capital Management, LLC is offering to sell or soliciting to sell advisory services to residents of any state in which the firm is not registered as an investment advisor. The views and opinions expressed in ASYMMETRY® Observations are those of the authors and do not necessarily reflect a position of Shell Capital Management, LLC. The use of this website is subject to its terms and conditions.

You must be logged in to post a comment.