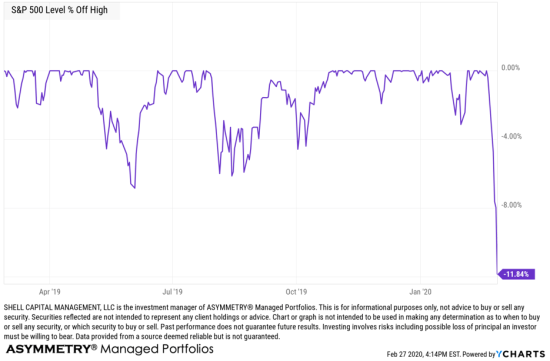
The stock index falls below its long-term trend, but just as stocks are getting oversold. The 200-day moving average was about 11% below the high February 19th, just eight days ago.
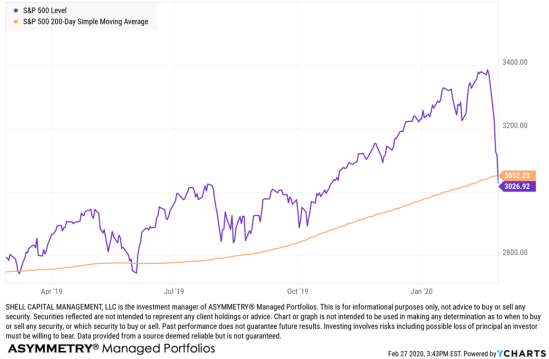
As you can see in the chart, this has been a sharp waterfall decline and one I’m glad we avoided so far. For those of us in a position of strength, we stalk the market actively looking for a lower-risk entry point that offers the potential for asymmetric risk-reward payoff. An asymmetric payoff is when we structure our positions so our potential for downside loss is limited to much less than the potential for capital gains.
The stock market is now getting more oversold on a short term basis.
Only 21% of S&P 500 stocks are above their 50 day moving average. That’s a lot of broken uptrend lines shifting into downtrends.
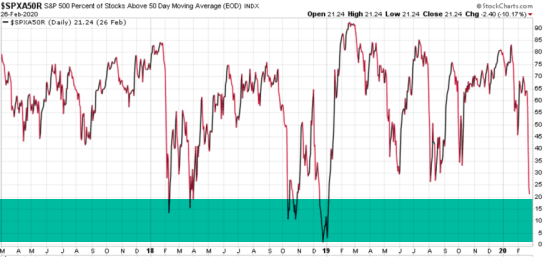
In the chart, I colored the “buy zone” in green. As you can see, it’s now down to a level I consider an indication that selling pressure may become exhausted as long as prices have been sold down to a low enough level to attract buying demand.
The stock market, and stock prices, are driven by supply and demand. It’s that simple. Measuring supply and demand isn’t so simple for most investors.
In the bigger picture, the longer-term trend lines are still at the 50-yard line, which is where all but one of the past five declines stopped. Of course, the one time stocks really got sold down was late 2018. Only time will tell if this becomes another period like that, but right now, those of us who had reduced or removed exposure to the market losses are probably looking to buy.
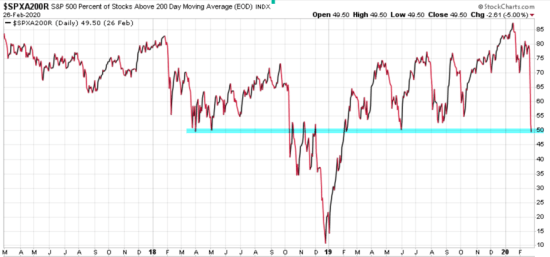
The longer-term trend lines are holding better, which is no surprise because stocks had trended up well above their longer trend lines. For example, the S&P 500 index was trading about 11% above its own 200 day moving average and it just now crossed below it. When many stocks are trending that far above their trend line, it takes more of a price decline to trigger the percent of stocks to fall.
Stocks market declines to tend to be asymmetric. Prices trend down faster than they trend up. After prices trend down, contagion sets in the lower prices fall. Prices then get driven down even more simply because investors are selling to avoid further loss. But, someone has to be on the other side of their panic selling. It’s those who had the cash to buy.
If you sell higher, you can buy lower.
Need help? Contact us here.
Mike Shell is the Founder and Chief Investment Officer of Shell Capital Management, LLC, and the portfolio manager of ASYMMETRY® Global Tactical. Mike Shell and Shell Capital Management, LLC is a registered investment advisor in Florida, Tennessee, and Texas focused on asymmetric risk-reward and absolute return strategies and provides investment advice and portfolio management only to clients with a signed and executed investment management agreement. The observations shared on this website are for general information only and should not be construed as advice to buy or sell any security. Securities reflected are not intended to represent any client holdings or any recommendations made by the firm. I observe the charts and graphs to visually see what is going on with price trends and volatility, it is not intended to be used in making any determination as to when to buy or sell any security, or which security to buy or sell. Instead, these are observations of the data as a visual representation of what is going on with the trend and its volatility for situational awareness. I do not necessarily make any buy or sell decisions based on it. Any opinions expressed may change as subsequent conditions change. Do not make any investment decisions based on such information as it is subject to change. Investing involves risk, including the potential loss of principal an investor must be willing to bear. Past performance is no guarantee of future results. All information and data are deemed reliable but is not guaranteed and should be independently verified. The presence of this website on the Internet shall in no direct or indirect way raise an implication that Shell Capital Management, LLC is offering to sell or soliciting to sell advisory services to residents of any state in which the firm is not registered as an investment advisor. The views and opinions expressed in ASYMMETRY® Observations are those of the authors and do not necessarily reflect a position of Shell Capital Management, LLC. The use of this website is subject to its terms and conditions.

You must be logged in to post a comment.