Something we have warned about for a while now is the elevated valuation level of stocks in general.
To be sure, I search for “Shiller PE” here on ASYMMETRY® Observations to mention the most recent times.
I promise I’m not just tooting my own horn here. The intent is to make the point that these things were present before this market crash and it’s starting to get cleared up. The same person who wrote about it then is now looking for the trend to change. But, to fully understand, we have to go back and see where we are coming from to know where we are now.
February 6, 2020 19 is the new 20, but is this a new low volatility regime?
I wrote:
- The current bull market that started in March 2009 is the longest bull market in history. It exceeded the bull market of the 1990s that lasted 113 months in terms of time, though still not as much gain as the 90s.
- The U.S. is in its longest economic expansion in history, breaking the record of 120 months of economic growth from March 1991 to March 2001, according to the National Bureau of Economic Research. However, this record-setting run observed GDP growth far slower than previous expansions.
The aged bull market and economic expansion can naturally lead to some level of complacency and expectation for less downside and tighter price trends. When investors are uncertain, their indecision shows up in a wide range of prices. When investors are smugger and confident, they are less indecisive and it’s usually after a smooth uptrend they expect to continue.
Is it another regime of irrational exuberance?
“Irrational exuberance” was the expression used by the former Federal Reserve Board chairman, Alan Greenspan, in a speech given during the dot-com bubble of the 1990s. The expression was interpreted as a warning that the stock market may have been overvalued. It was.
Irrational exuberance suggests investor enthusiasm drives asset prices up to levels that aren’t supported by fundamental financial conditions. The 90s ended with a Shiller PE Ratio over 40, far more than any other time in more than a century.
Is the stock market at a level of irrational exuberance?
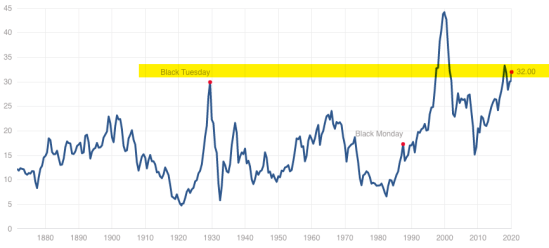
Maybe so, as this is the second-highest valuation in the past 150 years according to the Shiller PE.
Before that, on January 17, 2020 in
The aged bull market and economic expansion can naturally lead to some level of complacency and expectation for less downside and tighter price trends. When investors are uncertain, their indecision shows up in a wide range of prices. When investors are smugger and confident, they are less indecisive and it’s usually after a smooth uptrend they expect to continue.
Is it another regime of irrational exuberance?
“Irrational exuberance” was the expression used by the former Federal Reserve Board chairman, Alan Greenspan, in a speech given during the dot-com bubble of the 1990s. The expression was interpreted as a warning that the stock market may have been overvalued. It was.
Irrational exuberance suggests investor enthusiasm drives asset prices up to levels that aren’t supported by fundamental financial conditions. The 90s ended with a Shiller PE Ratio over 40, far more than any other time in more than a century.
Is the stock market at a level of irrational exuberance?
Maybe so, as this is the second-highest valuation in the past 150 years according to the Shiller PE.
Before that, on January 17, 2020 in What’s the stock market going to do next? I included:
THE BIG PICTURE
First, I start with the big picture.
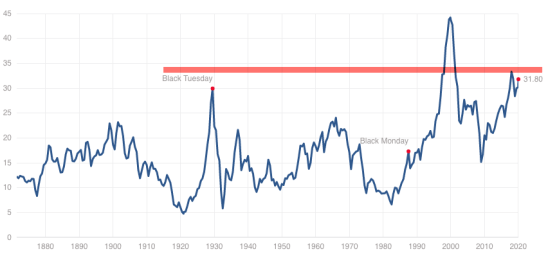
The S&P 500 is trading at 31.8 x earnings per share according to the Shiller PE Ratio which is the second-highest valuation level it has been in 150 years. Only in 1999 did the stock index trade at a higher multiple times earnings.
This price-earnings ratio is based on average inflation-adjusted earnings from the previous 10 years, known as the Cyclically Adjusted PE Ratio (CAPE Ratio), Shiller PE Ratio, or PE 10.
What is the P/E 10 and how is it calculated?
- Look at the yearly earning of the S&P 500 for each of the past ten years.
- Adjust these earnings for inflation, using the CPI (ie: quote each earnings figure in 2020 dollars)
- Average these values (ie: add them up and divide by ten), giving us e10.
- Then take the current Price of the S&P 500 and divide by e10.
The bottom line is, the stock market valuation has been expensive for a while now. The only time I factor in the price-earnings ratio is in the big picture. Although it isn’t a good timing indicator, it is considered a measure of the margin of safety for many investors and at this elevated level, there is no margin of safety by this measure.
As such, risk seems high in the big picture, which suggests investors should access their exposure to the possibility of loss in stocks and stock funds to be prepared for a trend reversal.
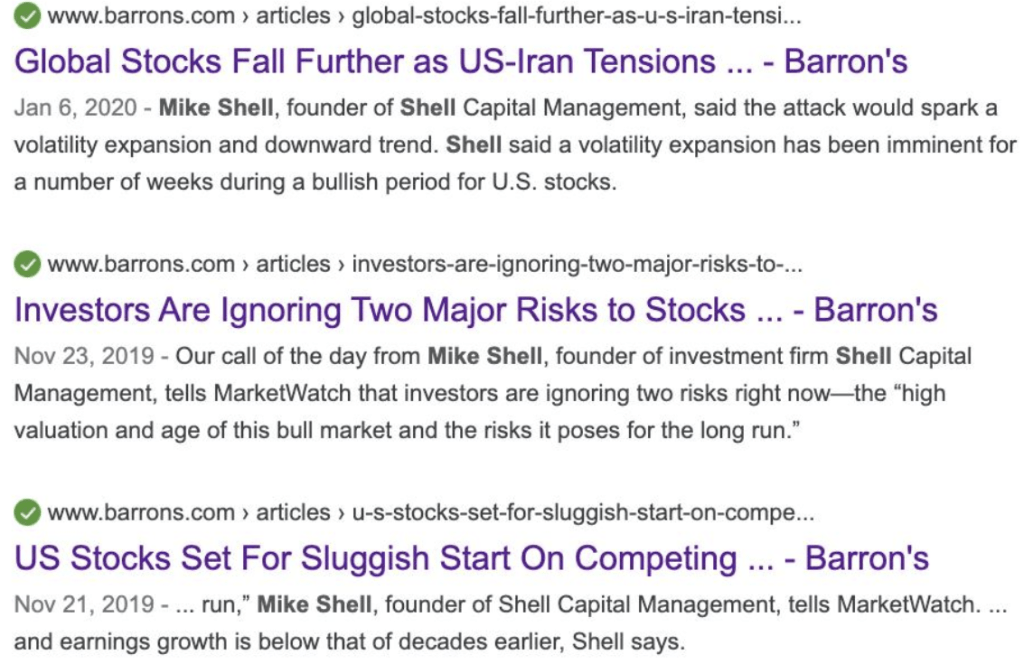
As a matter of fact, I was quoted three times in Barron’s and MarketWatch in November 2019 and January 2020 warning of the elevated risk level in stocks because of their valuation, the length of the bull market that is 11 years old, and what was a very low level of volatility.
I’m a true independent thinker, and have evidence of that as well. I’m sure my friends at Barron’s may not have liked it when I poke a little fun at the cover on January 18th and made it as clear as it could be! Here is what I wrote in Now, THIS is what a stock market top looks like!
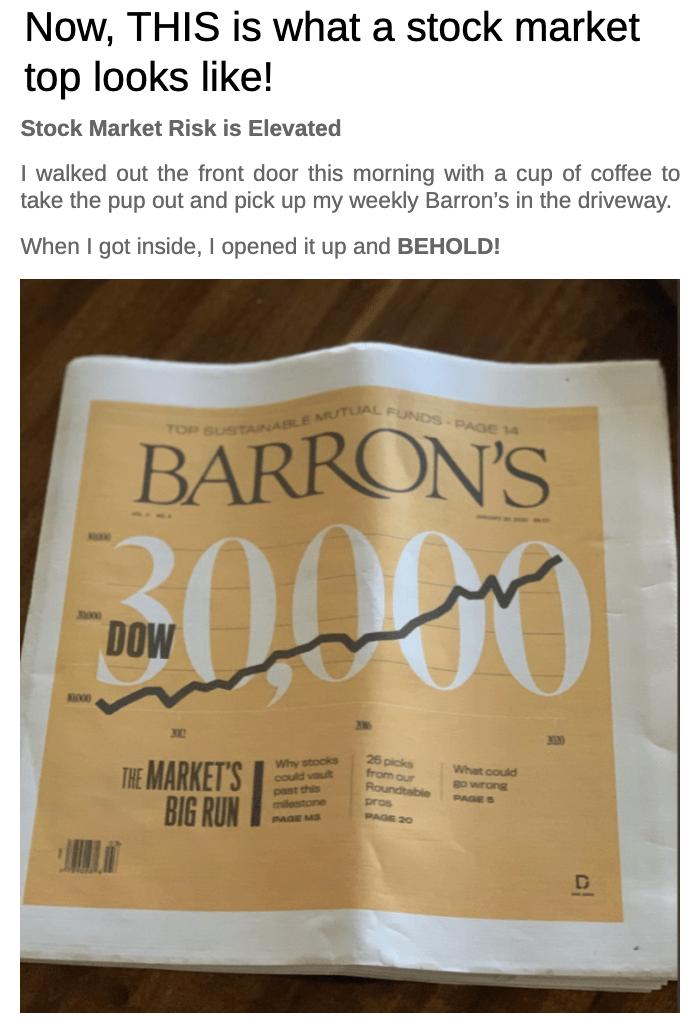
To be fair, I also included how Barron’s had been right before on their cover, but I was just using this as a confirming sign along with many other things I was already seeing.
I followed with;
My observations this week seem especially important because risk levels have become more elevated, yet individual investor sentiment is extremely optimistic.
As I’ve had very high exposure to stocks, I have now taken profits in our managed portfolios.
It’s a good time to evaluate portfolio risk levels for exposure to the possibility of loss and determine if you are comfortable with it.
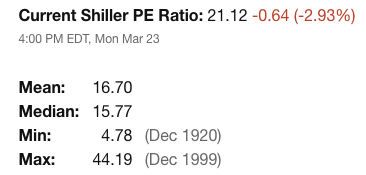
Here is the good news. After more than a -30% decline, the S&P 500 Shiller PE is down to 21, which is now within a more normal range, especially if we can assume low inflation. It’s still highly valued, but not the extremely overvalued 32 I warned about several times this year.
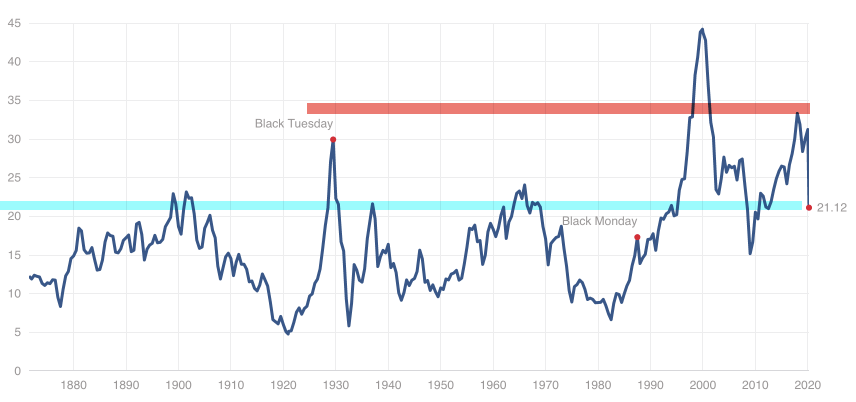
At 32 times earnings, it was the second most expensive time for stocks in American history. Second only to the late 1990’s and above Black Tuesday, just before the Great Depression.
The S&P 500 Shiller CAPE Ratio, also known as the Cyclically Adjusted Price-Earnings ratio, is defined as the ratio the the S&P 500’s current price divided by the 10-year moving average of inflation-adjusted earnings. Shiller PE was invented by Yale economist Robert Shiller and has become a popular way to understand long-term stock market valuations. It is used as a valuation metric to forecast future returns, where a higher CAPE ratio could reflect lower returns over the next couple of decades, whereas a lower CAPE ratio could reflect higher returns over the next couple of decades, as the ratio reverts back to the mean.
The mean is 16.70, so it still has a way to go for mean reversion.
The only good thing about falling stock prices is, if you have a lot of cash, as we’ve had, you get to buy stocks and equity ETFs at lower risk entry points. I’m not often a value investor, but I am when prices actually become fairly valued to undervalued.
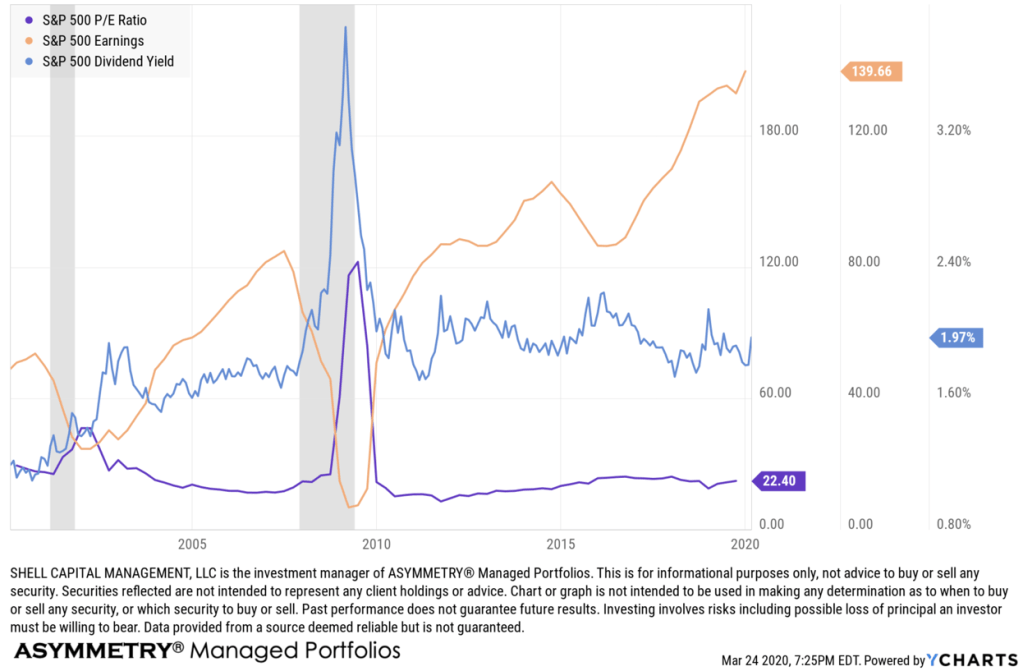
Another way to observe valuations of the big picture is the S&P 500 PE Ratio. The S&P 500 PE Ratio is the price to earnings ratio of the constituents of the S&P 500. The S&P 500 includes the 500 largest companies in the United States and can be viewed as a gauge for how the US stock market is performing. The price to earnings ratio is a valuation metric that gives a general idea of how a company’s stock is priced in comparison to their earnings per share. Historically, the S&P 500 PE Ratio peaked above 120 during the financial crisis in 2009 and was at its lowest in 1988. I marketed the high, low, and average in the chart.
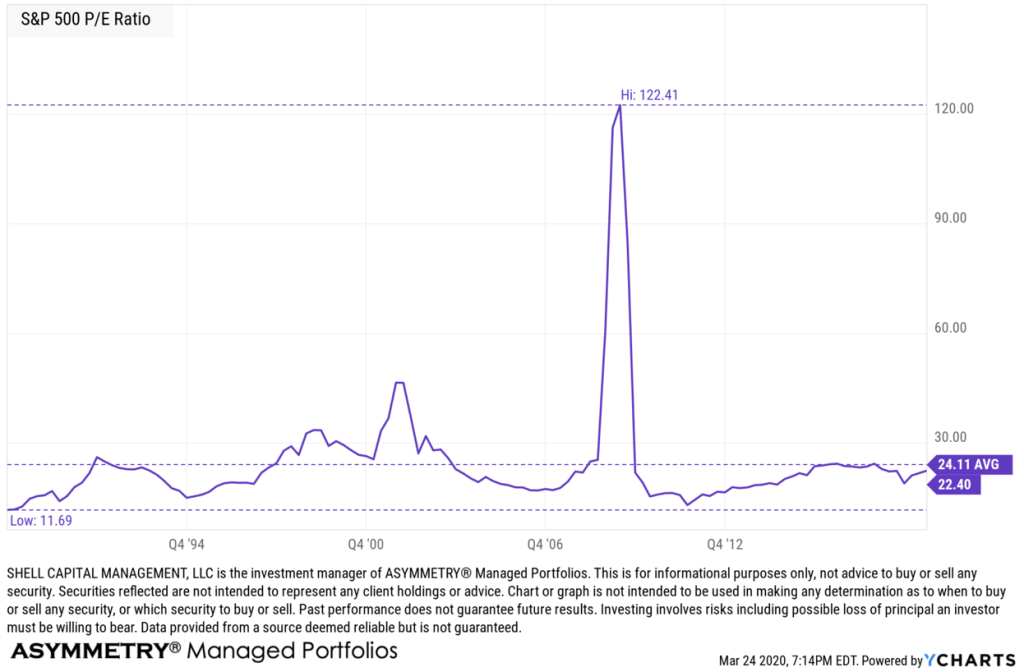
The trouble is, this PE metric did skyrocket in the last bear market. It’s because in recessions and bear markets, earnings decline. A picture is worth a thousand words, so here is the S&P earnings over the last twenty years with the recessionals in gray.
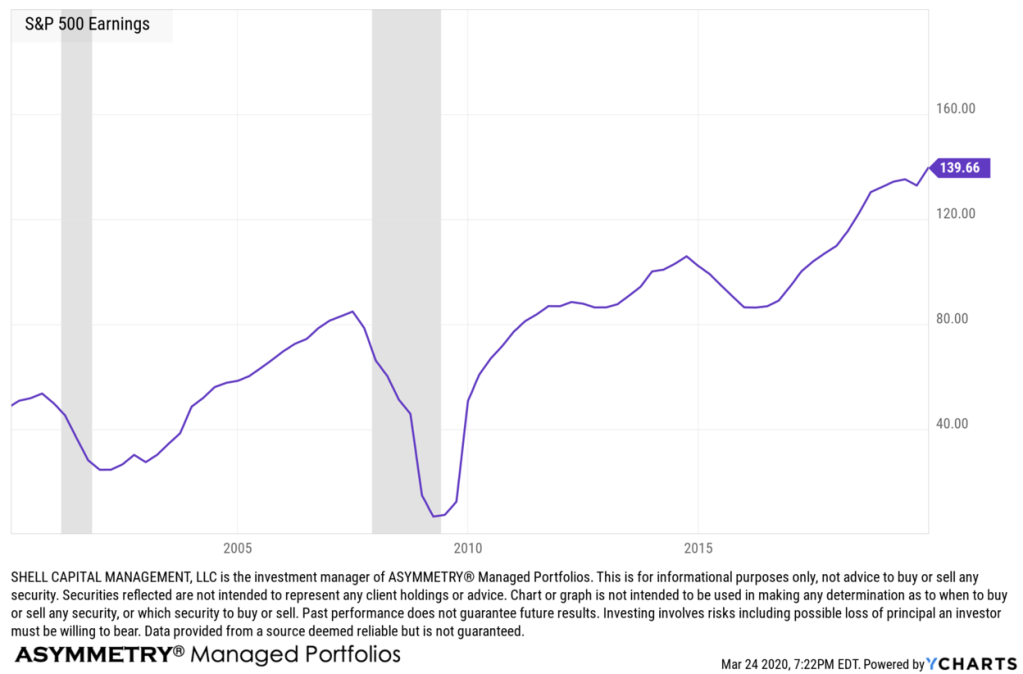
It all makes more sense when we see all three of the stock market return drivers in one chart. Earnings fall, price falls, dividend increases as the price decrease, and PE spikes up.
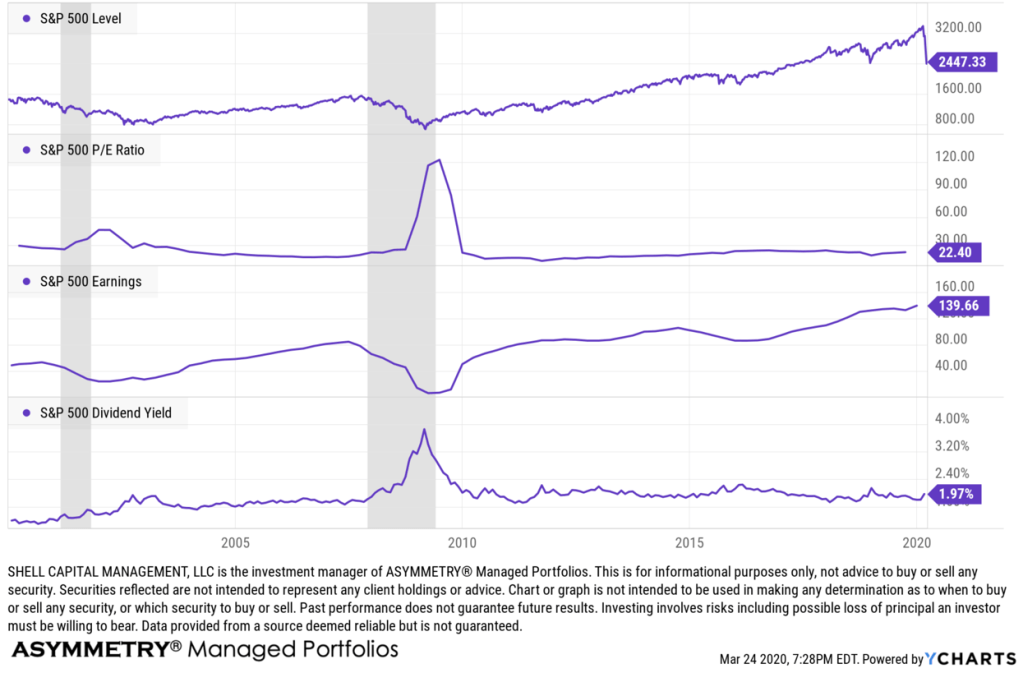
Next I show all four; price trend, PE trend, earnings cycle, and dividend yield.
So, the good news is, the US stock market is becoming less overvalued. The downside is, a recession seems imminent as earnings was already expected to slow. This is at least one less risk in the big picture, but we’ll see how it all unfolds from here.
Bear markets are difficult and with all the negative headlines right now, I know it’s hard for people to see light at the end of the tunnel. I don’t see it, either, but as a tactical investment manager, I increase and decrease exposure to the risk/reward and in a volatility expansion, I expect wider swings.
These are fascinating times and past bear markets have been the highlight of my professional investment management career, so sign up if you want to follow along with email notifications of new observations.
Let us know if we can help.
Mike Shell is the Founder and Chief Investment Officer of Shell Capital Management, LLC, and the portfolio manager of ASYMMETRY® Global Tactical. Mike Shell and Shell Capital Management, LLC is a registered investment advisor focused on asymmetric risk-reward and absolute return strategies and provides investment advice and portfolio management only to clients with a signed and executed investment management agreement. The observations shared on this website are for general information only and should not be construed as advice to buy or sell any security. Securities reflected are not intended to represent any client holdings or any recommendations made by the firm. Any opinions expressed may change as subsequent conditions change. Do not make any investment decisions based on such information as it is subject to change. Investing involves risk, including the potential loss of principal an investor must be willing to bear. Past performance is no guarantee of future results. All information and data are deemed reliable but is not guaranteed and should be independently verified. The presence of this website on the Internet shall in no direct or indirect way raise an implication that Shell Capital Management, LLC is offering to sell or soliciting to sell advisory services to residents of any state in which the firm is not registered as an investment advisor. The views and opinions expressed in ASYMMETRY® Observations are those of the authors and do not necessarily reflect a position of Shell Capital Management, LLC. The use of this website is subject to its terms and conditions.

You must be logged in to post a comment.