After yesterday’s continued selling pressure, only 7% of the S&P 500 stocks remain in uptrends as measured by the 50-day moving average.
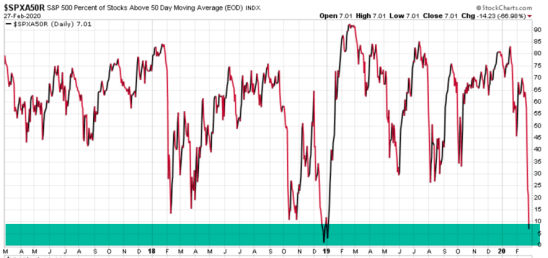
As most stocks are participating in the downtrend, this breadth measure is about as low as it was in December 2018.
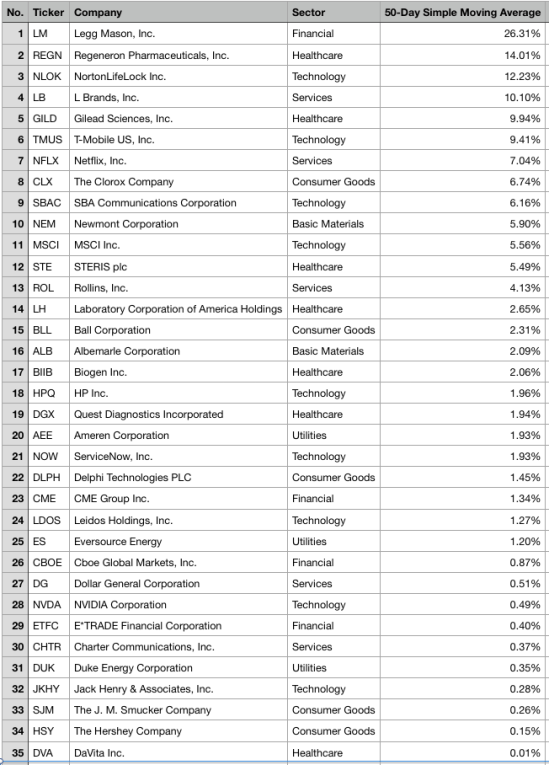
In case you are wondering, here are some of the few stocks in the index that are still above their trend line. I don’t consider this a buy list and we don’t own any of them directly.
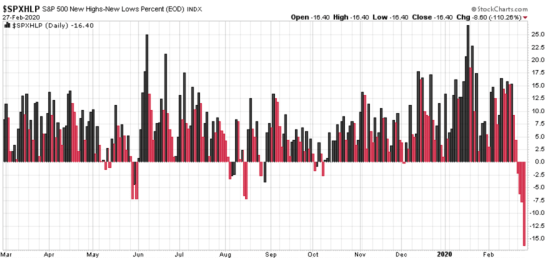
Another sign of a strong desire to sell is the new highs-new lows as a percentage. It’s as low as it’s been the past year, as new lows are dominating.
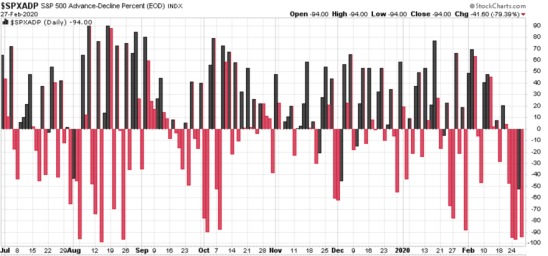
As expected, a chart of advance – declining stocks as a percentage is at the low end of its range and about as low as it can get as declining stocks are dominant.
When investors are panic selling, prices can always trend lower, but this data shows mathematically prices have reached an extreme level on the downside that now appears to be an overreaction. We should be close to seeing this panic selling dry up as selling becomes exhausted and these lower prices attract buyers. After that, we’ll see if any countertrend back up continues, or eventually reverses back down. As I’ve said recently, given this bull market is very aged and we’ve seen the longest economic expansion in history, I believe the years ahead will require tactical trading and risk management.
I hope this helps!
Mike Shell is the Founder and Chief Investment Officer of Shell Capital Management, LLC, and the portfolio manager of ASYMMETRY® Global Tactical. Mike Shell and Shell Capital Management, LLC is a registered investment advisor in Florida, Tennessee, and Texas focused on asymmetric risk-reward and absolute return strategies and provides investment advice and portfolio management only to clients with a signed and executed investment management agreement. The observations shared on this website are for general information only and should not be construed as advice to buy or sell any security. Securities reflected are not intended to represent any client holdings or any recommendations made by the firm. I observe the charts and graphs to visually see what is going on with price trends and volatility, it is not intended to be used in making any determination as to when to buy or sell any security, or which security to buy or sell. Instead, these are observations of the data as a visual representation of what is going on with the trend and its volatility for situational awareness. I do not necessarily make any buy or sell decisions based on it. Any opinions expressed may change as subsequent conditions change. Do not make any investment decisions based on such information as it is subject to change. Investing involves risk, including the potential loss of principal an investor must be willing to bear. Past performance is no guarantee of future results. All information and data are deemed reliable but is not guaranteed and should be independently verified. The presence of this website on the Internet shall in no direct or indirect way raise an implication that Shell Capital Management, LLC is offering to sell or soliciting to sell advisory services to residents of any state in which the firm is not registered as an investment advisor. The views and opinions expressed in ASYMMETRY® Observations are those of the authors and do not necessarily reflect a position of Shell Capital Management, LLC. The use of this website is subject to its terms and conditions.

You must be logged in to post a comment.