What really drives stock prices? The price of stocks, just like groceries, is driven by supply and demand of people “the market” buying and selling. What drives stock prices and the stock market really is no more complicated than that.
Unless you make it more complicated, then it is for you.
What drives stock prices? It is probably one of the most asked questions we get. It’s also one of the best questions, so I’ll share my observation of it as succinct as I can.
Many investors seem to believe stock prices, and therefore, the stock market is driven by the news of the day because they see the headlines. The press tries to construct a story of the cause and effect. But, if we look at the news headlines on any day, we observe vastly conflicting narratives and reasons for a stock market directional move.
To be sure, here are the headlines I found online today. According to headlines, recent price action and volatility are driven by everything from Trump’s talk on a China trade deal to an overvalued stock market to factory data to the fear of missing out.
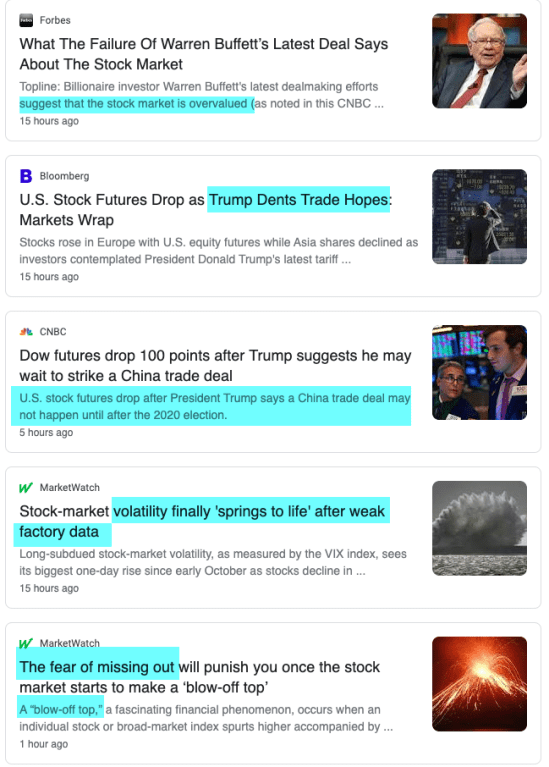
The answer is, “all of the above” drives the stock market.
The news is newly received or noteworthy information, especially about recent or relevant events. However, none of us can say which specific news actually drives stock prices.
If you really want to know what drives stock prices, it’s just the market, doing what it does.
All information and news have the potential to drive stock prices, as does investor sentiment. The price of stocks, just like groceries, is driven by supply and demand of people buying and selling. When emotion gets imbalanced, prices trend. Yes, there’s another asymmetry!
When supply and demand are symmetrical, the price stays the same.
When supply and demand are asymmetrical, the price trends in the direction of the most pressure and enthusiasm.
After yesterday’s close, I saw someone ask, “Why did the stock market do so bad today?”
I’m guessing he saw a headline like this:
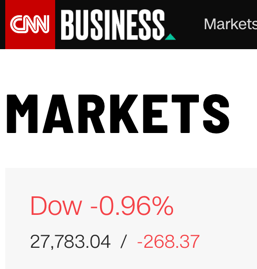
However, a Dow decline of -0.96% isn’t a significant drop, but if you anchor to the “-268 point drop” as most do, it may sound worse, to you.
I focus on the % change to normalize the movement. Normalizing with the percent change adjusts the values measured on different scales to a notionally standard scale. For example, the “-268 point drop” is one thing from an absolute level of 27,783, but a very different situation when the Dow was at 10,000. At today’s level of 27,783, it’s only -0.96%, but the same point drop when the index was 10,000 is -2.68%, nearly three times the single-day loss.
A -1% single-day decline in the stock index isn’t a lot by historical standards. If it feels like it is, the investor should either better inform themselves of market history or have little to no exposure to the stock market. I’ll help with the former below.
First, here are the stats. I’ll continue to use the Dow Jones Industrial Average index data.
So far, in 2019, the Dow has declined -1% or more on 18 days. When it declined -1% or more in a single day, the average drop that day was -1.7%. So, a -1% drop isn’t uncommon. It’s well within a normal range for a down day. I count about 231 trading days so far in 2019, excluding holidays, so 18 of those days falling -1% or more is nearly 10% of the days. And remember, the average drop those days was -1.7%, yesterday was only -1%.
Oh, and the worst day so far in 2019 was -3%, so it could be three times worse!
When we extend the lookback period to this time last year, the Dow declined -1% or more on 26 days. When it declined -1% or more in a single day, the average drop that day was -1.87%. Again, a -1% drop isn’t uncommon. Last December was a very volatile month.
2018 was more volatile than 2019, so far. In 2018, the Dow declined more than -1% on 35 days, and when it did, the average drop was -2%, and the worst day was -4.6%.
Investors tend to anchor to the recent past and extrapolate it into the future. That is, humans tend to expect what is happening now to continue. After a volatile 2018, most investors probably expected a volatile 2019. For many, the down days and downtrends in 2018 were a shocker after an abnormally quiet 2017. In 2017, the stock market trended up with little downside. We only saw 4 down days of -1% or more, and the average down day was only 1.3%, and the worse was 1.7%. You can probably see how many were stunned last year.
This may make you wonder when investor fear drives down stock prices, what is a “normal” down day?
It depends on the time frame and the market state over that time frame. Over the past three years, the Dow declined 57 days more than -1%, and the average down day was -1.9%, and the worst was -4.6%. That’s nearly 700 data points, so the sample size is likely enough to say we should expect a -2% down day is going to happen, and a -5% is possible.
To expand the sample size, I wondered how many -1% or more down days I’ve dealt with since I started managing our primary portfolio in May 2005. In the last fourteen years, the Dow has dropped -1% or more 427 days, and an average decline was -1.8%, and the worst down day was -9.4%! You can probably see why a -1% down day from my perspective isn’t a big deal, and the statistics of the data also confirms it’s well within a typical down day.
Of course, the trouble is larger downtrends being with down days. So, the investor’s concern isn’t just a single down day, but instead a series of down days, which is a downtrend. Before moving on to what drives stock prices and the stock market, let’s look at the downtrends.
Over the past year, the Dow Jones has declined more than -5% twice and -20% once starting last December. All of these downtrends include -1% down days. So, I’m not saying they don’t matter, but instead, the single -1% down day isn’t by itself significant.

Expanding the lookback period to the past 10 years, we see many downtrends of -5% or more. But, within those downtrends, there was only one -5.4% down day, but 245 down days over -1% with an average loss of -1.6%. Downtrends include these down days.

Next, we look all the way back to the beginning of the index data to observe its historical downside. The 1926 era Great Depression was by far the worst when the Dow Jones Industrial Average fell over -75%. It makes the 2007-09 period when it fell -50% look tame.

Clearly, if you invest in the stock market, you should expect to experience drops of -5% a few times a year, and -10% maybe once a year, and -20% or more at least every market cycle. If all you do is buy and hold stocks or stock funds, expect to experience a -50% because if history is a guide, it has happened before, so it could happen again.
You can probably see Why we row, not sail.
To understand what drives stock prices and how much of a loss is considered a large loss, we have to know the history. I hope I’ve shared it in a helpful way.
If there’s anything I hope individual investors get from my observations, it’s a better understanding of the risks of investing. The rewards of investing are well advertised, but the risks are what matters the most when our focus is asymmetric risk/reward. When prices of positions are trending in our favor increasing our investment account value, our concern isn’t that we are making too much money. Our interest is not giving up all the profit, which is a risk management function.
The exit, not the entry, always determines the outcome.
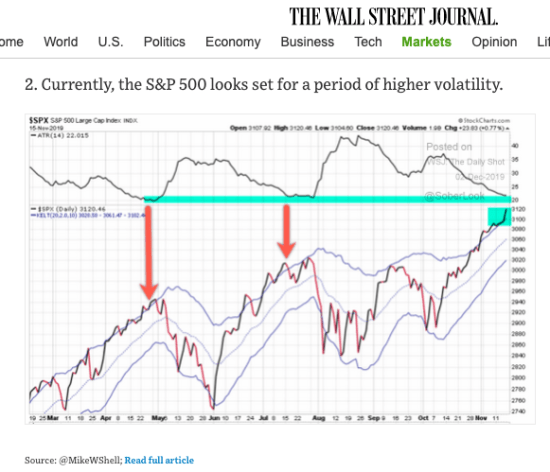
If you want to know what really caused the decline, I shared my opinion in a single chart that I believe sums it up best. It was good enough to make it in The Daily Shot in the Wall Street Journal. As the stock index has trended up quietly in recent weeks, volatility had contracted, as seen in the chart. As I shared, “Periods of low volatility are often followed by volatility expansions.”
A few weeks ago, I also observed investor sentiment had reached an extremely optimistic level as stated in Investor sentiment signals greed is driving stocks as the U.S. stock market reaches short term risk of a pullback.
Now that stock prices have fallen two days in a row, we’ll start to see the pendulum swing from extreme greed to a middle ground. If the stock market drops a lot more, investor sentiment will become fearful, just in time for a reversal back up again.
Some favor stories, others favor data and charts, I’m a math guy, so I prefer the data and visually seeing it in charts. I’m lucky to be able to write.
What we have here isn’t a failure to communicate, the news is everywhere. I think it’s a misunderstanding of what really drives stock prices down. It’s the desire and enthusiasm to sell.
Stock price trends, just like groceries, are driven by supply and demand of people buying and selling. When sentiment gets imbalanced, prices trend in the direction that has the most force and momentum.
Yes, it’s another asymmetry! Without the asymmetry, prices would stay the same.
In the spirit of ASYMMETRY® and asymmetric risk-reward payoffs, I’m naturally trying to get the most reward from my observations by helping as many people as possible, so share it! And enter your email on the right to get immediate notices of new ASYMMETRY® Observations. We do not sell or use your email address in any other way. Also, follow me on Twitter: @MikeWShell
Mike Shell is the Founder and Chief Investment Officer of Shell Capital Management, LLC, and the portfolio manager of ASYMMETRY® Global Tactical.
Mike Shell and Shell Capital Management, LLC is a registered investment advisor focused on asymmetric risk-reward and absolute return strategies and provides investment advice and portfolio management only to clients with a signed and executed investment management agreement. The observations shared on this website are for general information only and should not be construed as advice to buy or sell any security. Securities reflected are not intended to represent any client holdings or any recommendations made by the firm. Any opinions expressed may change as subsequent conditions change. Do not make any investment decisions based on such information as it is subject to change. Investing involves risk, including the potential loss of principal an investor must be willing to bear. Past performance is no guarantee of future results. All information and data are deemed reliable but is not guaranteed and should be independently verified. The presence of this website on the Internet shall in no direct or indirect way raise an implication that Shell Capital Management, LLC is offering to sell or soliciting to sell advisory services to residents of any state in which the firm is not registered as an investment advisor. The use of this website is subject to its terms and conditions.

You must be logged in to post a comment.