In Asymmetric Volatility, I used the range of weather temperatures to show that volatility is how far data points are spread out.
While it’s 72 degrees and sunny in Florida it can be below freezing in Boston with snow on the ground.
We observe asymmetric volatility in equity markets, too.
The equity market tends to crash down, but drift up. That is, uptrends tend to drift slower and less steep, and downtrends tend to fall faster and sharper and can become waterfall declines. We observe fewer geysers than waterfalls.
The drivers of this market dynamic seem to be mainly based on behavior and a reaction to price trends.
I could add that leverage has an impact, too. As markets have gone up for a while investors are more likely to use leverage to “get more aggressive”. Leverage levels tend to be highest at peaks. But, leverage and volatility feedback tend to be linked to panic selling leading to selling pressure. Prices fall more because they are falling.
I believe that upward price trends are primarily driven by underreaction to information. Even if we all get the same information at the same time, but we respond to it differently and at different times. Some get in the trend sooner, others enter later, some even wait until the end (and use leverage!).
Investors may underreact in downtrends, too. Many investors may not react to a loss of -5%, but -10% they may start to pay more attention and -20% some may panic. The deeper the fall, the more investors are likely to tap-out. By the time the stock market is down -20%, many may be selling to cut their loss. As selling pressure builds, selling leads to more selling as prices fall. If you are bold and -20% isn’t enough to tap you out, maybe -50% is.
If you are bold and -20% isn’t enough to tap you out, maybe -40% is. Or, -50%. I think everyone has a tap-out point. It could be losing it all.
Here is an example you may remember.
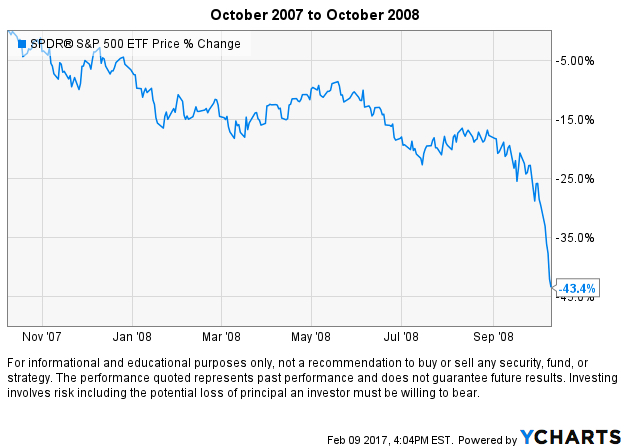
As the price trend made lower highs and lower lows, selling pressure continued and it led to a waterfall panic level decline. This kind of decline is what many “risk measurement” systems fail to acknowledge. Actually, they intentionally ignore them. If you use a risk measurement system that says it has a “95% Confidence Level”, these downtrends are the 5% it ignores. It acts like they won’t happen. It even does it on purpose.
That’s the very move you want to avoid.
You can probably see why I believe it is necessary to actively manage risk and apply drawdown control.
For the record, the period above wasn’t the full downtrend. I often see that period misquoted as “2008”.
It wasn’t just 2008.
The S&P 500 was just down -37% in the calendar year 2008.
The full decline was actually -55%. It began at the peak in October 2007 and didn’t end until March 2009.
It began at the peak in October 2007 and didn’t end until March 9, 2009.
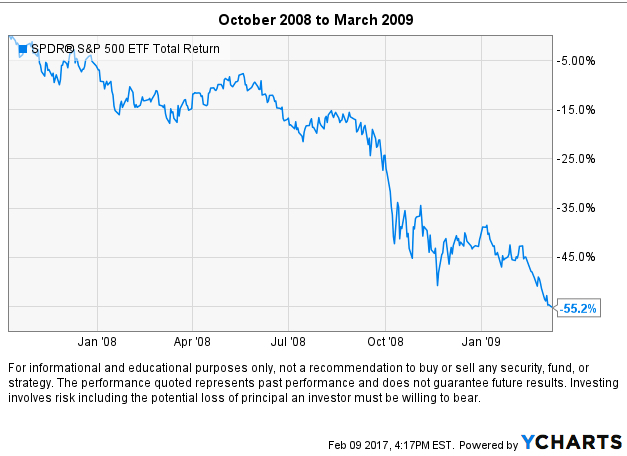
2009 ended positive, so many people don’t include it when they speak of this last bear market. Below is January 1, 2009, to March 9, 2009. It continued to decline nearly -30% in those two months after 2008.

Beware of those who understate the historical downside and the potential for downside.
They are the same people who will experience it again.

You must be logged in to post a comment.