I like to observe the return drivers of price trends. Though I primarily focus on the direction of the price trend and volatility, I also consider what drives the price trend.
Yesterday I suggested the stock market was at a point of pause and possible reversal back up in The stock market is holding its breadth… for now. I shared some examples of how the percent of stocks in a positive trend had declined to a point that could indicate the selling in the near term could be drying up.
So far, today’s sharp reversal up seems to confirm at least a short term low.
Up until today, the S&P 500 stock index was down about -6% off its high. In May it dropped -8% before reversing back up to a new high. I express these drawdowns in the % off high chart below. This is year-to-date, since January 1.

Just for reference, this -6% decline looks more similar to May when I expand the time frame to 1 year instead of just year-to-date. We also see the October to December waterfall decline was a much deeper -20%.

Of course, if you look close enough, the pattern prior to the much steeper and deeper part of that fall looks similar to now, with the price trend testing the prior low, recovering, then falling sharply another -10%. I’m not pointing this out to say it will happen again, but instead that it’s always a possibility, so risk management is essential.
What is driving this decline?
Fear.
It’s that simple.
Some are afraid of another recession signaled by an inverted yield curve, others of the Trump Tweets, others by the Fed lowering interest rates or not doing it fast enough. I’ve heard some hedge funds are afraid China will invade Hong Kong, others are concerned of the China tariffs. Some people probably wake up afraid and fear everything that can possibly happen, as such, they experience it as if it did.
I prefer to face my fears and do something about them.
Investors have reached an extreme level of fear in the past few weeks as evidenced by the -6% decline in the stock index. We can also see this reflected in the investor sentiment poll. The AII Sentiment Survey shows optimism is at an unusually low level and pessimism is at an unusually high level for the 2nd consecutive week.
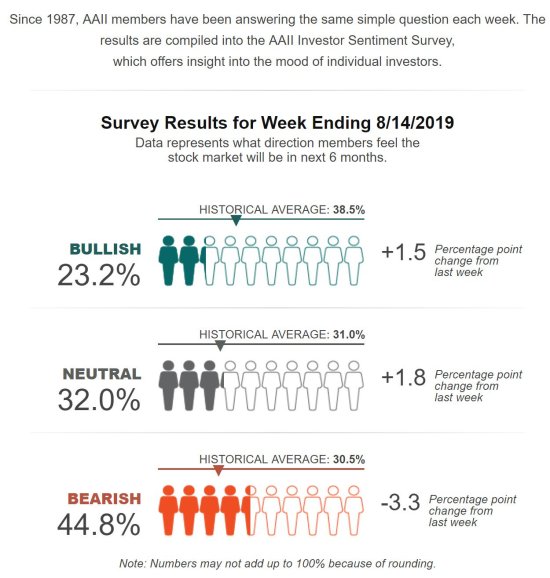
Such extreme levels of investor sentiment often proceed trend reversals. So, these extreme fear measures along with the breadth measures I shared yesterday, I’m not surprised to see the stock market reverse up sharply today.
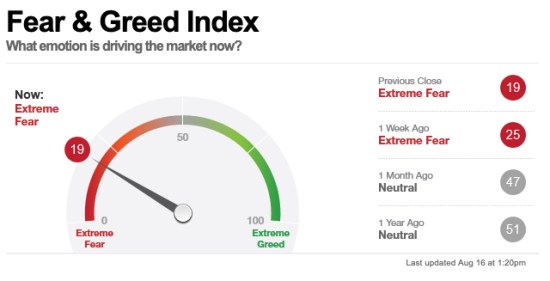
Another interesting measure is the Fear & Greed Index, which is a combination of multiple sentiment indicators believed to measure investor sentiment. The Fear & Greed Index has reached the “Extreme Fear” level, so by this measure, fear is driving prices.
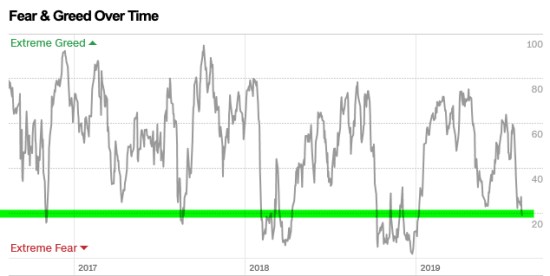
Over time, we can see how the Fear & Greed Index has oscillated up and down, swinging from fear to greed and back to fear again. I highlight the current level has reached the low point it typically does before it reverses up again, with the exceptions of the sharp panics in 2018.
I have my own proprietary investor sentiment models, but here I share some that are simple and publicly available. I’m not suggesting you trade-off of these, as I don’t, either, but instead use them to help modify your investor behavior. For example, rather than use these indicators to signal offense or defense, investors may use them to alert them to their own herding behavior. Most of the time, we are better off being fearful when others are greedy and greedy when others are fearful.
These measures aren’t quite robust enough to be timing indicators by themselves, my signals are coming from other systems and I’m using these to illustrate what’s driving it.
Over the past 12 months, as of right now the stock index is up 2.48%. That’s including today’s 1.5% gain.

Only time will tell if it holds the line, but as I’ve zoomed in to a 3-month time frame, we can see the first line of support that needs to hold.

We are long and strong at this point, so;
Giddy up!
Mike Shell is the Founder and Chief Investment Officer of Shell Capital Management, LLC, and the portfolio manager of ASYMMETRY® Global Tactical.
Mike Shell and Shell Capital Management, LLC is a registered investment advisor and provides investment advice and portfolio management exclusively to clients with a signed and executed investment management agreement. The observations shared on this website are for general information only and should not be construed as advice to buy or sell any security. Securities reflected are not intended to represent any client holdings or any recommendations made by the firm. Investing involves risk, including the potential loss of principal an investor must be willing to bear. Past performance is no guarantee of future results. All information and data is deemed reliable, but is not guaranteed and should be independently verified. The presence of this website on the Internet shall in no direct or indirect way raise an implication that Shell Capital Management, LLC is offering to sell or soliciting to sell advisory services to residents of any state in which the firm is not registered as an investment advisor. Use of this website is subject to its terms and conditions.

You must be logged in to post a comment.