The 2 Year U.S. Treasury has never been this low before.
2 Year Treasury Rate is at 0.13%, compared to 0.17% the previous market day and 2.30% last year. This is lower than the long term average of 3.32%.
2 Year Treasury Rate is the yield received for investing in a US government issued treasury security that has a maturity of 2 years. The 2 year treasury yield is included on the shorter end of the yield curve and is important when looking at the overall US economy. Historically, the 2 year treasury yield trended as low as 0.16% in the low rate environment after the Great Recession post 2008. Here is the chart.
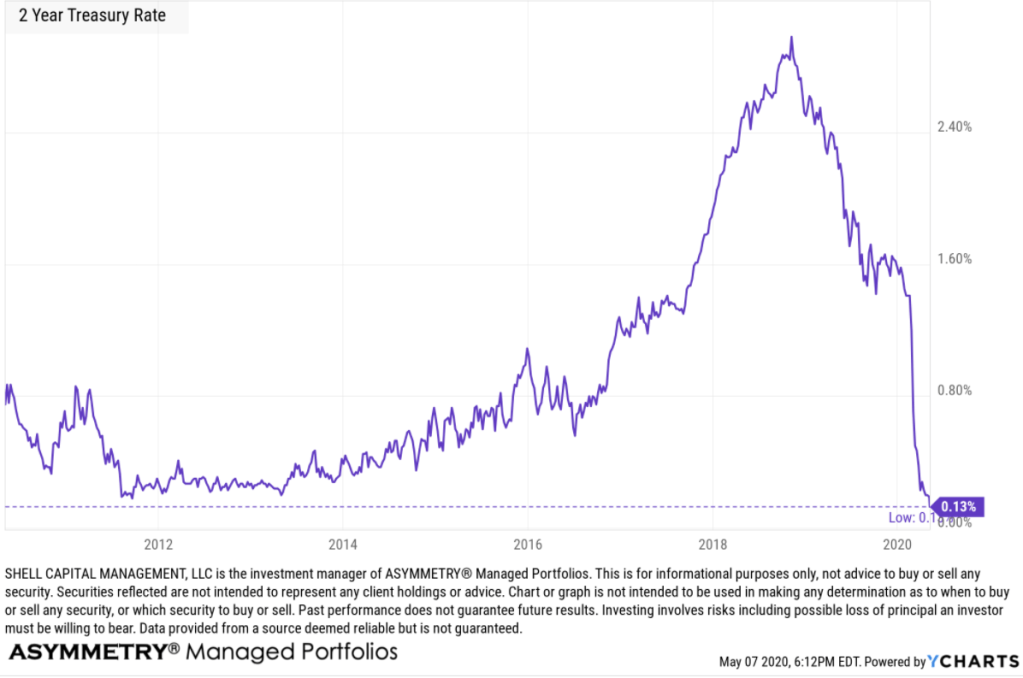
This is uncharted territory.
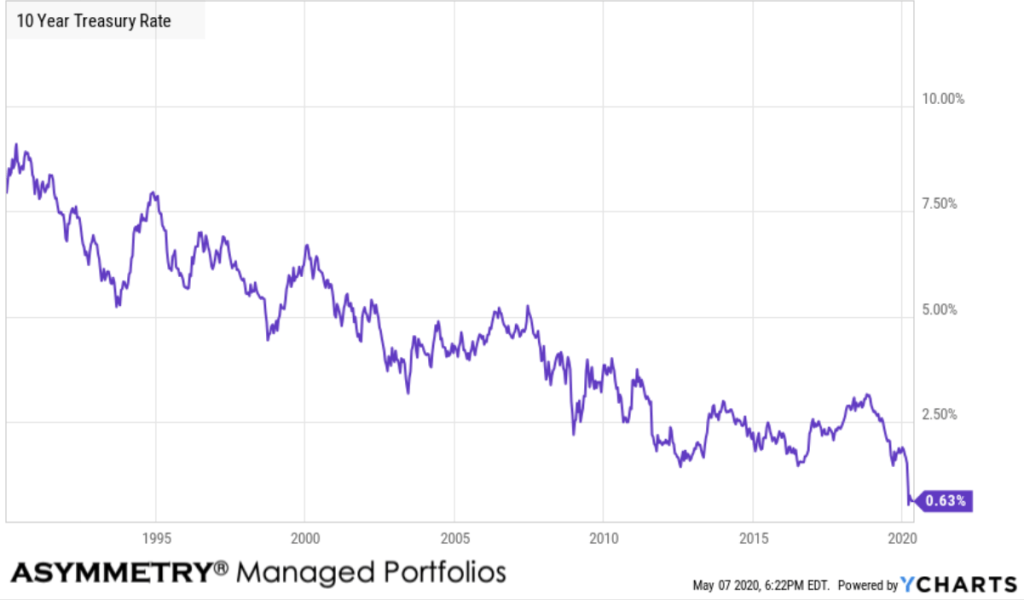
Here is the trend in the interest rate since 1990.

The 10 year treasury remains at an all time low.
On December 29, 2019, I shared my observations of the yield spread in “Asymmetry in yield spreads, inverted yield curve warning shot, and unemployment” when I said:
“A 10-2 treasury spread that approaches zero indicates a “flattening” yield curve. A flattening yield curve is when the shorter-term interest rate (2 years) is the same as longer-term interest rate (10 year).”
With the 2 year reaching an all time low, it’s a good time to revisit the yield curve.
10-2 Year Treasury Yield Spread is at 0.50%, compared to 0.55% the previous market day and 0.19% last year. This is lower than the long term average of 0.93%. But, it isn’t zero. Instead, the yield spread is trending up some. I labeled recessions in grey. The current recession hasn’t been called one yet by the historian economist, but it will be.
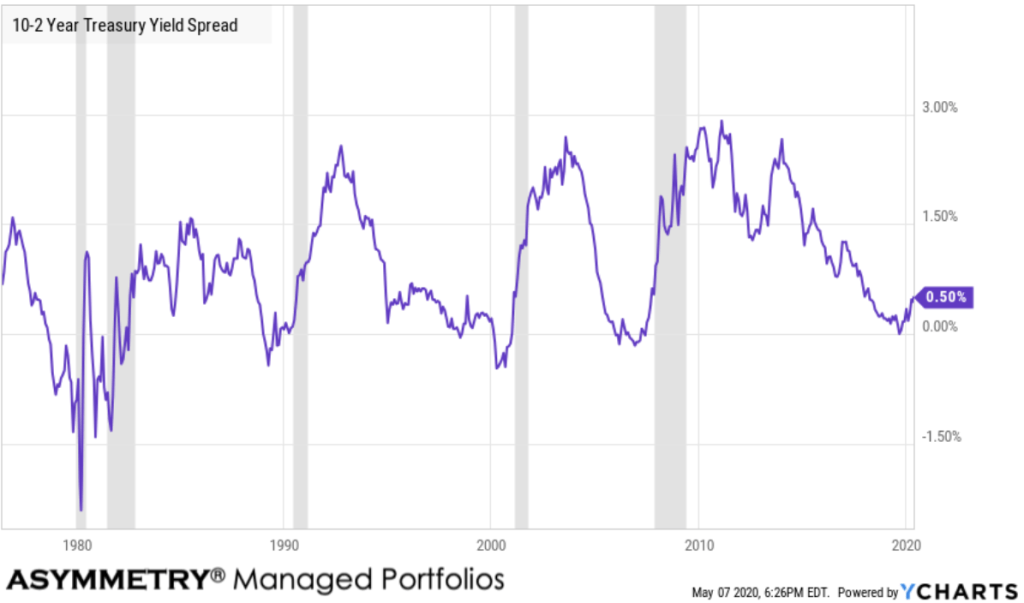
The 10-2 Treasury Yield Spread is the difference between the 10 year treasury rate and the 2 year treasury rate. A 10-2 treasury spread that approaches zero signifies a “flattening” yield curve. A negative 10-2 yield spread has historically been viewed as a precursor to a recessionary period. A negative 10-2 spread has predicted every recession from 1955 to 2018, but has occurred 6-24 months before the recession occurring, and is thus seen as a far-leading indicator. The 10-2 spread reached a high of 2.91% in 2011, and went as low as -2.41% in 1980.
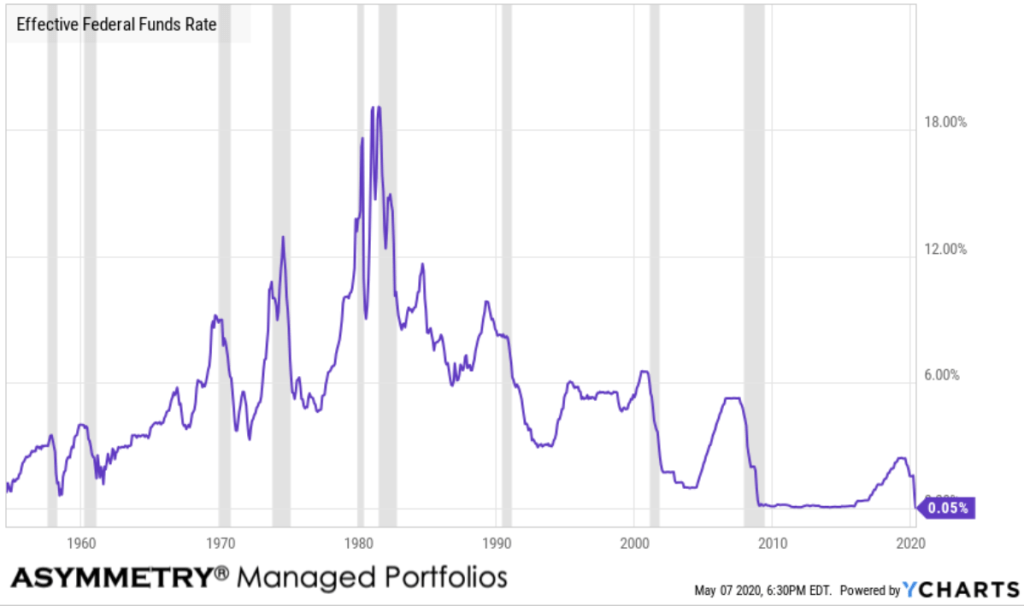
Interest rates in the U.S. are trending toward zero.
Effective Federal Funds Rate is at 0.05%, compared to 2.40% last year. This is lower than the long term average of 4.75%. The Effective Federal Funds Rate is as low as its ever been.
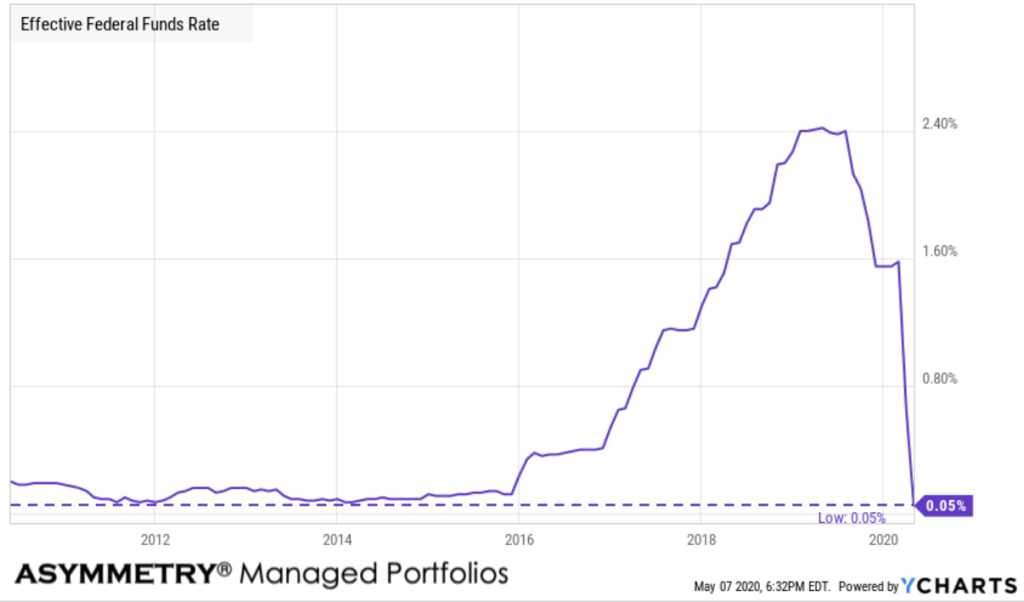
The Effective Federal Funds Rate is the rate set by the FOMC (Federal Open Market Committee) for banks to borrow funds from each other. The Federal Funds Rate is important because it can act as the benchmark to set other rates. Historically, the Federal Funds Rate reached as high as 22.36% in 1981 during the recession. Additionally, after the financial crisis in 2008-2009, the Federal Funds rate nearly reached zero when quantitative easing was put into effect.
Here is the Effective Federal Funds Rate going back to 1976.
Interest rates can’t be lowered in depressions.
They are already at or near zero.
Operating through the years ahead is going to require rowing, not sailing. It’s going to require rotating, rather than allocating. It’s going to require actively directing and controlling risk, rather than a passive buy and hope approach. We are entering a cycle that is long overdue, but it’s here, now, and I’m looking forward to operating through it tactically.
This is going to be big boy stuff here.*
You better git your mind right.
*Sorry ladies, saying big girl stuff wouldn’t be right.
Mike Shell is the Founder and Chief Investment Officer of Shell Capital Management, LLC, and the portfolio manager of ASYMMETRY® Global Tactical. Mike Shell and Shell Capital Management, LLC is a registered investment advisor focused on asymmetric risk-reward and absolute return strategies and provides investment advice and portfolio management only to clients with a signed and executed investment management agreement. The observations shared on this website are for general information only and should not be construed as advice to buy or sell any security. Securities reflected are not intended to represent any client holdings or any recommendations made by the firm. Any opinions expressed may change as subsequent conditions change. Do not make any investment decisions based on such information as it is subject to change. Investing involves risk, including the potential loss of principal an investor must be willing to bear. Past performance is no guarantee of future results. All information and data are deemed reliable but is not guaranteed and should be independently verified. The presence of this website on the Internet shall in no direct or indirect way raise an implication that Shell Capital Management, LLC is offering to sell or soliciting to sell advisory services to residents of any state in which the firm is not registered as an investment advisor. The views and opinions expressed in ASYMMETRY® Observations are those of the authors and do not necessarily reflect a position of Shell Capital Management, LLC. The use of this website is subject to its terms and conditions.

You must be logged in to post a comment.