Technical analysis is the study of financial market price trends.
What’s funny is that technical analysis has evolved into now being called quantitative analysis.
Technical analysis has long been a method of much debate, until the academics determined that past price performance may have an impact on future performance.
I’ve been a chartist and technician for over twenty years now, and I make no bones about it.
I’m also called an independent thinker, because I don’t care what others think of it. I do me, and you do you.
Academics previously didn’t think the study and measurement of past price trends had any edge to be gained. It’s probably because Eugene Fama said “markets are efficient.” So, if it comes from the ivy tower of university, it must be true?
It isn’t.
The efficient-market hypothesis is a hypothesis in financial economics that states that asset prices reflect all available information.
If markets are efficient, then all known information is already factored into prices, and so there is no way to “beat” the market because there are no undervalued or overvalued securities available.
That’s far from reality.
If the markets reflect all known information, and are efficient, then how could we explain a -34% decline in the S&P 500? and a -37% decline in the Dow Jones Industrial Average in just three weeks?
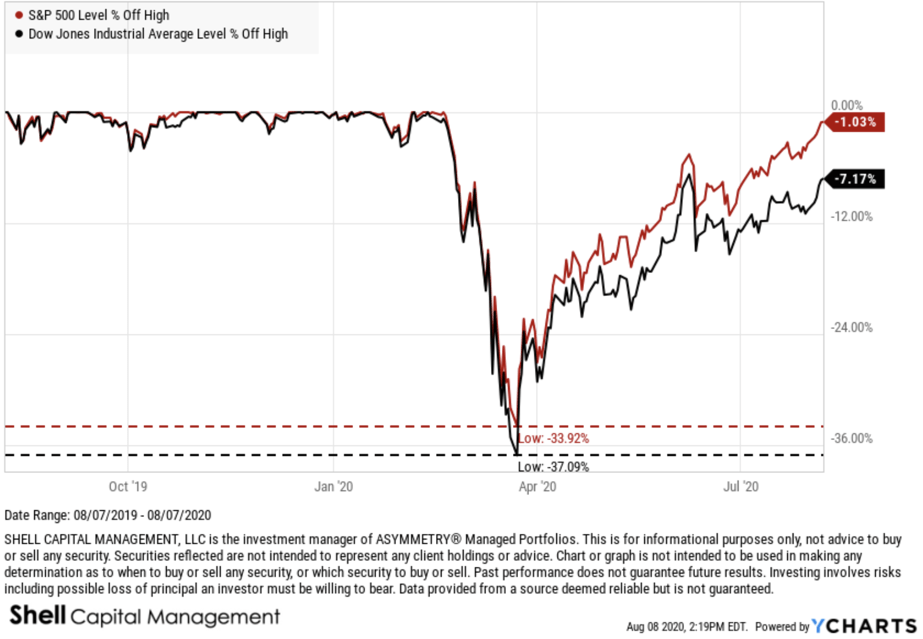
No, that’s gotta be an under-reaction or an overreaction, or both at different times.
It’s the under-reaction and overreaction to new information that causes prices to drift, or trend, directionally over time rather than just always spiking up or down. It’s always what drives momentum, which is know even accepted by academics who didn’t want to believe that past performance had any impact on the current or future price.
I know, it was a silly proposition. Who wouldn’t look at the past price history for perspective of its historical direction, momentum, and volatility.
I was attracted to charting early on in my career. As I earned an advanced accounting degree, including all the advanced accounting courses on top of the standard ones, which would qualify me for the CPA exam in Tennessee. I don’t know about other states, but Tennessee required 150 credit hours and at least five advanced accounting classes on top of the core accounting degree. It is basically a Master’s degree, since I think a B.S. is about 124 hours.
Anyway, I did it, and the more I learned accounting, the more I realized it wasn’t of much use in an auction market.
In theory, the price of a stock trades at some multiple of earnings and such. If it were so simple, we could easily determine with high probability what a stock should trade at, and it would be accurate.
But it isn’t.
I say that anything other than the price trend itself has the potential to lead you astray from its reality.
That includes fundamental valuation measures.
I know accounting and finance about as well as anyone, and as a student who was trading stocks, it didn’t take long to realize the above statement. If a stock is undervalued, there’s a reason the market doesn’t like it. You may not know the reason yet, but some large institutional investors may.
I prefer to follow the big money that moves the price trend. They aren’t always right, either, but all the really matters is the direction they drive the price.
Does it really matter why?
or who?
So I’m a realist. I’ve got a lot of stereotypes I guess.
As I show you the following charts, I like to also include what may be wrong about them. For example, I’m about to show you the price trend of the S&P 500 index, which includes in it about 500 stocks. So, when we look at the index price trend, we have to realize what it represents. If we make a judgment based on the trend of an index, we’re doing it with an understanding there are about 500 different company stocks moving around inside it that have an impact on the outcome.
It isn’t perfect, but neither is fundamental analysis.
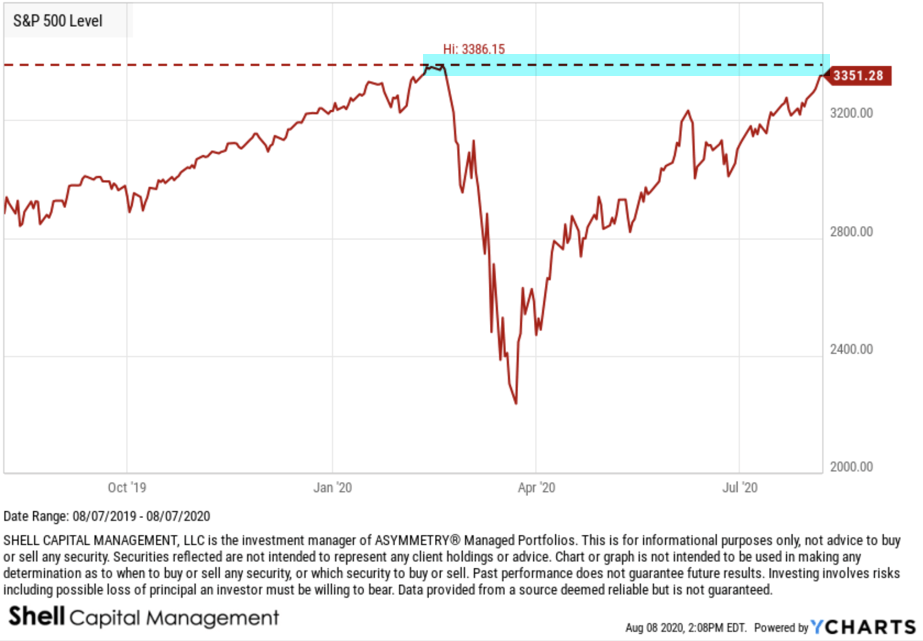
Here we go. What we have here is the popular stock index rubbing up on the top end of a range that represents the prior (February) high.
Technicians, or technical analysts, call this area “resistance”, but I disagree.
I call it potential resistance.
You see, it isn’t resistance until it is.
Resistance is an area on the chart where selling pressure overwhelms buying pressure enough to drive the price lower. A resistance level is identified by a previous price high or peak on price trend chart as I did above.
However, if resistance is where selling overwhelms buying, that hasn’t happened yet. So, it can’t yet be “resistance.”
All analysis requires some common sense and plain critical thinking.
Now, here is the problem. People always want to know of a catalyst that could cause a prevailing price trend to change.
People love a good story.
The reason I believe we’ll see some resistance here, if we’re going to, is because of my momentum measures are signaling the trend is entering the upper end of its range.
The last time the S&P 500 got into this zone was the first week of June.
The S&P 500 declined about -7% afterward.
So, if we’re going to see some pull back, I expect it will come soon.
Afterwards, we’ll then see if it eventually trends back up to a new all time high, or if it instead reverses down into more of a downtrend.
This is how it works. It’s a Bayesian probability, where we update the possibilities as we go.
At each new stage of a trend, the expected value changes.
Let’s see how it unfolds from here.
Mike Shell is the Founder and Chief Investment Officer of Shell Capital Management, LLC, and the portfolio manager of ASYMMETRY® Global Tactical. Mike Shell and Shell Capital Management, LLC is a registered investment advisor focused on asymmetric risk-reward and absolute return strategies and provides investment advice and portfolio management only to clients with a signed and executed investment management agreement. The observations shared on this website are for general information only and should not be construed as advice to buy or sell any security. Securities reflected are not intended to represent any client holdings or any recommendations made by the firm. Any opinions expressed may change as subsequent conditions change. Do not make any investment decisions based on such information as it is subject to change. Investing involves risk, including the potential loss of principal an investor must be willing to bear. Past performance is no guarantee of future results. All information and data are deemed reliable but is not guaranteed and should be independently verified. The presence of this website on the Internet shall in no direct or indirect way raise an implication that Shell Capital Management, LLC is offering to sell or soliciting to sell advisory services to residents of any state in which the firm is not registered as an investment advisor. The views and opinions expressed in ASYMMETRY® Observations are those of the authors and do not necessarily reflect a position of Shell Capital Management, LLC. The use of this website is subject to its terms and conditions.

You must be logged in to post a comment.