Investor sentiment is trend following.
Investors get more bullish as stock prices trend up, and more bearish as the stock market trends down.
See what I mean in Nothing Like a Price Trend to Change Investor Sentiment.
Investor sentiment is trend following.
Investors get more bullish as stock prices trend up, and more bearish as the stock market trends down.
See what I mean in Nothing Like a Price Trend to Change Investor Sentiment.
When we speak of trends, we want to recognize a trend can be rising or declining, high or low. These things are subjective, because there is infinite ways to define the direction of a trend, its magnitude, speed, and absolute level. So, we can apply quantitative analysis to determine what is going on with a trend.
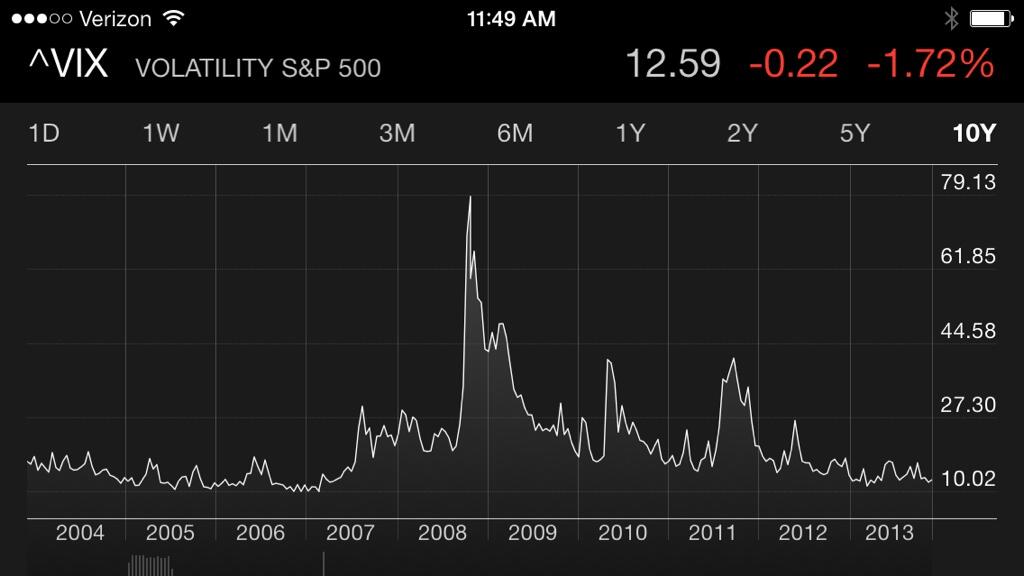
Below we see a quote for the CBOE Market Volatility Index (VIX). The VIX is a measure of the 30 day implied volatility of S&P 500 index options. It is a measure of how much premium options traders are paying on the 500 stocks included in the S&P 500. So, it is a measure of implied or expected volatility based on how options are priced, rather than a measure of actual historical volatility based on a past range of prices. Without going into a more detailed discussion of the many factors of VIX, I’ll add that the VIX is a fine example of an index that is clearly mean reverting. That is, the VIX oscillates between high and low ranges. Once it gets to a high level or low-level, it eventually reverts to its average. Said another way, it’s an excellent example of an index we can apply countertrend systems instead of trend following systems, because the VIX swings up and down rather than trending up or down for years.
The VIX has a long-term average of about 20 since its inception. At this moment, it is 11.82. It’s important to realize the flaw of averages here, because the VIX doesn’t actually stay around 20 – it instead averages 20 as it swings higher and lower.
I used the above image from CNNMoney because it shows the rate of change in the VIX over the past 5 years on the bottom of the chart. Notice that over the past 5 years (an arbitrary time frame) market volatility as measured by VIX has declined -63.78%. To get an even better visual of the decline and price action of the VIX, below is a chart of the volatility index going back to 2001.
Do you see a trend? Do you see high and low points?
We observe the current level is low by historical measures. In fact, it’s about as low at it has been. The last time the volatility index was this low was 2006 – 2007. That was just before it spiked as high as it has been during the 2007 – 2009 market crash. You can probably see what I mean by “mean reversion” and “countertrend”. When the stock market is rising, volatility gets lower and lower as investors become more complacent. Most investors actually want to get more aggressive and buy more stocks after they have already risen a lot for years, rather than realizing the higher prices go the more risky they become. We love trends, but they don’t last forever. What I think we see above is an indication that investors have become complacent, option premiums are cheap, because options traders aren’t factoring in high volatility exceptions. However, we also see that the VIX is just now down below 12.5, and area the last bull market reached in 2006 and that low volatility stayed low for over a year before it reversed sharply. Therein lies the challenge with counterrend trading: we don’t know exactly when it will reverse and trends can continue longer than we expect. And, there are meaningful shorter term oscillations of 20% or more in the VIX.
I also want to point out how actual historical volatility looks. Recall that the VIX is an index of market volatility based on how options are priced, so it implies the expected volatility over the next 30 days. When we speak of historical volatility, there are different measures to quantify the historical range prices have traded. Volatility speaks of the range of prices, so a price that averaged 100 but trades as high as 110 and low as 105 is less volatile than if it trades from 130 and 70. Below I charted the price chart of the S&P 500 since 2002. The first chart below it is ATR, which is Average True Range. ATR considers the historical high and low prices to determine the true range. A common measure is the standard deviation of historical returns. Standard deviation is charted below as STDDEV below the ATR. Below Standard Deviation is the VIX.
Notice that the measures of volatility, both historical and implied, increase when stock prices fall and decrease when stock prices rise. Asymmetric Volatility is the phenomenon that volatility is higher in declining markets than in rising markets. You can see why I say that volatility gets lower and lower as prices move higher and higher for several years. Then, observe what happens next. Right when investors are the most complacent, the trend changes. Prices fall, volatility spikes up. They feel more sure about things after prices have been rising, so there is less indecision reflected in the range of daily trading. When investors feel more uncertain, they become indecisive, so the range of prices spread out.
Based on these empirical observations, we conclude with the title of this article.
The VIX is an unmanaged index, not a security, so it cannot be invested in directly. We can gain exposure to the VIX through derivatives futures or options. This is not a recommendation to buy or sell VIX derivatives. To determine whether or not to take a long or short position in the VIX requires significantly more analysis than just making observations about its current level and direction. For example, we would consider the term structure and implied volatility vs. historical volatility and the risk/reward of any options combinations.
Implied volatility, the amount of “insurance premium” implied by the price of options, continues to suggest that investors are becoming very complacent. When the VIX is high or rising, it says the market expects the S&P to move up or down more. When the VIX is low or declining, it says the market expects the S&P 500 will not move up or down as much in the future. That is, the “insurance premium” priced into options on the S&P 500 stocks is low. That isn’t necessarily directional – it is an indication of the expected range, not necessarily direction. However, what I know about directional price trends is that after a price has been trending directionally for some time, as the S&P 500 stock index has, investors become more and more complacent as they expect that trend to continue. The mind naturally wants to extrapolate the recent past into the future and it keeps doing it until it changes. When we see that in the stock market, it usually occurs as a directional trend is peaking. Investors are caught off guard as they expected a tight range. If the range in prices widens, they probably widen even more because they are – and it wasn’t expected. Interestingly, people actually expect inertia and that is one of the very reasons momentum persists as it does. Yet, momentum may eventually move prices to a point (up or down) that it may move too far and actually reverse the other way.
If we believe the market is right, we would believe the current level accurately reflects the correct expecation for volatility the next 30 days. That is, we would expect today’s implied volatility of about 12 – 13% will match the actual historical volatility 30 days from now. In other words, 30 days from now the historical (backward looking) volatility is match the current implied volatility of 12.6%. If we believe the current volatility implied by option premiums is inaccurate, then we have a position trade opportunity. For example, we may believe that volatility gets to extremes, high or low, and then reverses. That belief may be based on empirical observation and quantitatively studying the historical data to determine that volatility is mean reverting – it may oscillate in a range but also swing from between one extreme to another. If we believe that volatility may reach extremes and then reverse, we may believe the market’s implied volatility is inaccurate at times and aim to exploit it through counter-trend systems. For example, in my world, volatility may oscillate in a range much of the time much like other markets, except it doesn’t necessarily have a bias up or down like stocks. There are times when I want to be short volatility (earning premium from selling insurance) and long volatility (paying premium to buy insurance). I may even do both at the same time, but across different time frames.
The point is, the market’s expectation about the future may be right most of the time and accurately reflect today what will be later. But, what if it’s wrong? If we identify periods when it may be more likely wrong, such as become too complacent, then it sets up a position opportunity to take advantage of an eventual reversal.
Of course, if you believe the market is always priced accurately, then you would never take an option position at all. You would instead believe that options are priced right and if you believe they are, you believe there is no advantage in being long or short them. I believe the market may have it right most of the time, but at points it doesn’t, so convergence trades applying complex trade structures with options to exploit the positive asymmetry between the probability and payoff offers the potential for an edge with positive expectation.
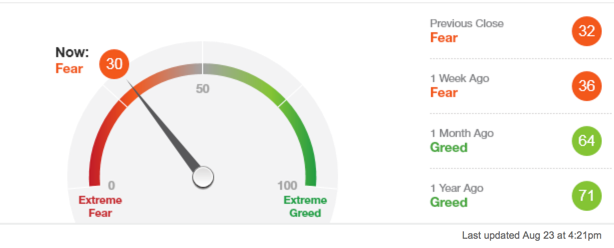
As I said in “Fear is the Current Return Driver“, investor sentiment has turned to “Fear” since the stock and bond markets have declined recently. Investors tend to get optimistic (and greedy) after prices have gone up and then fearful after prices go down. Now, I am not a contrarian investor. I want to be positioned in the direction of global markets and stay there until they change. My purpose of pointing out these EXTREMES in investor sentiment (fear and greed) is to illustrate how investors feelings oscillate between the fear of missing out (if global markets have gone up and they aren’t in them) and the fear of losing money (if they are in global markets and they are falling). Fear and greed is a significant driver of price trends and investment returns. When stock market investor sentiment readings get to an extreme it often reverses trend afterward. For example, as you can see in the Fear & Greed Index below, the dial is now at “Extreme Fear” as the return driver. When we see these extremes in fear it happens after prices have fallen. Prices can keep falling after it gets to such an extreme, but we often see the directional price trend reverse back up after an extreme fear measure. With that said, the purpose of this observation of extreme points of sentiment isn’t to be necessarily used as a timing indicator, but instead to recognize how extreme readings of investor sentiment are most often the wrong feeling at the wrong time. It isn’t the best timing indicator because, thought extreme readings often proceed a change in the price trend, these extreme readings can get a LOT more extreme and prices can keep moving far more than expected. So, all countertrend indicators have that risk. It’s like value investing: you think it’s oversold, or undervalued, but it gets a lot more oversold and a lot more undervalued. What I think is useful about observing extremes in sentiment are to understand how investors behave at certain points in a market cycle. If you find you have problems with this behavior, you may use to modify your behavior.

If you don’t understand this, or have question or comment, contact me directly or reply to this post if you don’t mind others to see your reply.
As I said in “Investor Sentiment is Bearish“, I’ll point out my observations about investor sentiment when it gets to an extreme and asymmetrically skewed to fear or greed. I pointed out the most recent AAII Investor Sentiment reading is bearish. Another simple gauge of investor sentiment is the Fear & Greed Index. As you can see, it hasn’t gotten to the extreme fear point, but fear has recently been the driver for stocks. Its reading was Greed just a month ago. Stock prices fell, investor sentiment shifted to fear. I believe many investors oscillate between the fear of missing out and the fear of losing money and I’ll share the observations as they occur as empirical evidence. When investor fear increases, eventually the last seller has sold and it pendulum swings back the other way.

You must be logged in to post a comment.