Several months ago I started sharing some of my observations about the VIX ( CBOE Volatility Index). The VIX had gotten to a level I considered low, which implied to me that investors were too complacent, were expecting too low future volatility, and option premiums were generally cheap. After the VIX got down to levels around 11 and 12 and then started to move up, I pointed out the VIX seemed to be changing from a downward longer term trend to a rising trend.
As I was sharing my observations of the directional trend and volatility of VIX that I believed was more likely to eventually go up than down, it seemed that most others were writing just the opposite. I know that many volatility traders mostly sell volatility (options premium), so they prefer to see it fall.
As you can see in the chart below, The VIX has increased about 140% in just a few weeks.
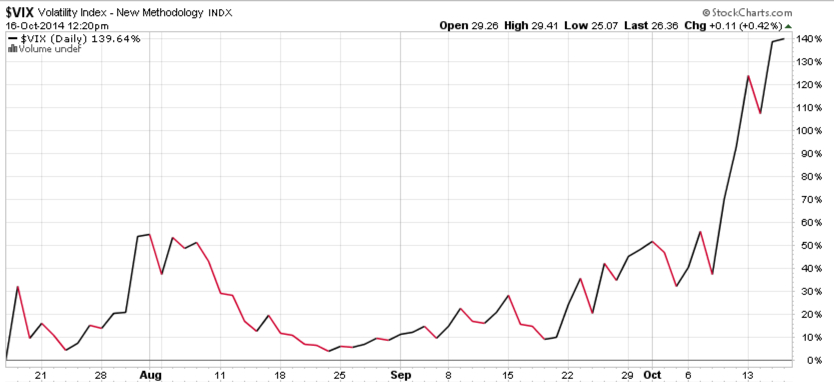
Chart courtesy of http://www.stockcharts.com
For those who haven’t been following along, you may consider reading the previous observations:
A VIX Pop Then Back to Zzzzzzzz? We’ll see
VIX Shows Volatility Still Low, But Trending
The VIX is Asymmetric, making its derivatives an interesting hedge
Is the VIX an indication of fear and complacency?
What does a VIX below 11 mean?
What does the VIX really represent?
Declining (Low) Volatility = Rising (High) Complacency

Pingback: The Volatility Index (VIX) is Getting Interesting Again « Asymmetry Observations