Here is the trouble with a seasonal strategy. According to Standard & Poors, the S&P 500 has gained 1.05 % in May, though it was a volatile month. So, “sell in May and go away” just missed out for no other reason other than it was May.
The second problem is best explained in the chart below. According to Standard & Poors, since 1946 (68 years) the S&P 500 has actually been positive during the “sell in May and go away” period May – October 64% of the time with an average gain of 1.3%. So, the expectation for the period is actually a positive return of .83% May to October.
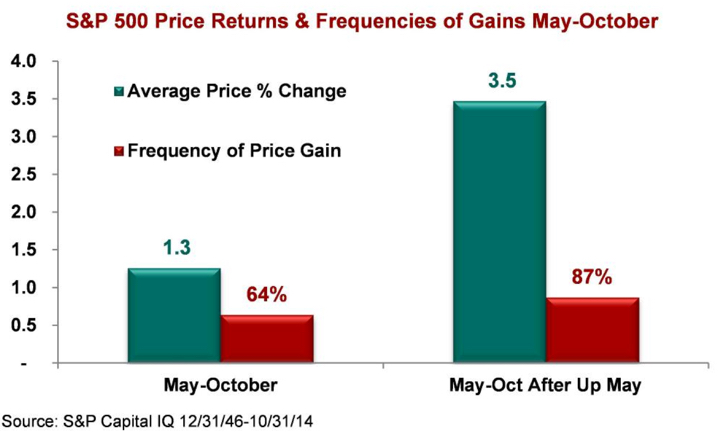
Another interesting observation in the chart is after a positive “up” May, the May to October period tends to increase 87% of the time an average of 3.5%. So, the expectation is 3.04%. Based on the probability and expectation, we would expect 2% more through October. Of course, the trouble is this stock index is trading at 27 times EPS which is overvalued territory, so this time could instead be the 13% of the time it declines instead, but the probability and expectation is what it is and we want to invest with it, not against it. I would rather focus on the actual direction of trends rather than what month it is.
One month or series of months is an arbitrary time frame, which is why a strategy based on specific time frames like “Sell in May and Go Away” are arbitrary – no matter what story is told to make it sound good.
This May it turned out it most of the other global markets were down materially in May like the Emerging Markets index -4.1%, Commodity Index -2.17%, and even the iShares iBoxx $ Investment Grade Corporate Bond declined -1.12%. So, anyone who was globally positioned across multiple markets during May did experience declines. Those who shifted from the S&P 500 index to bonds at the beginning of May actually lost what the stock index gained…
I prefer to focus on the actual direction of global price trends, no matter when they are. You can see what that looks like here.

Pingback: Is this the Inflection Point for Stocks? « ASYMMETRY® Observations
Pingback: No Inflection Point Yet, But… « ASYMMETRY® Observations