I just came across this Wall Street Journal article about trend following as I was searching for something.
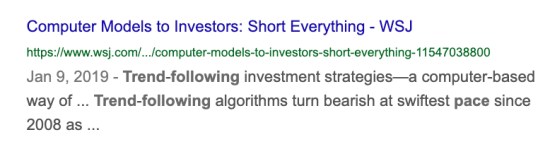
Jan 9, 2019 – Trend–following investment strategies—a computer-based way of … Trend–following algorithms turn bearish at swiftest pace since 2008 as …
Below that headline, when I clicked on it, was:
“Trend-following algorithms turn bearish at swiftest pace since 2008 as machines steer more trades”
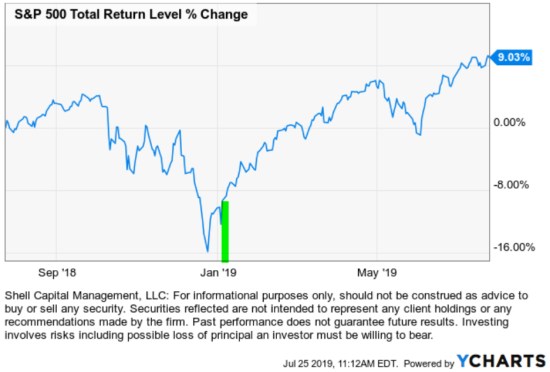
Clearly, since publication January 9th it wasn’t a productive signal from trend-following if we look at the S&P 500 stock index and mark the date of the article as I did with the green highlight below.
The last several years has been more challenging for trend following systems and investment managers applying the strategy. The challenge is more an issue for less experienced portfolio managers and their investors if they’ve never operated through periods when trends and volatility is more hostile for the strategy.
Trend following performed well during late 2007 to early 2009 period. Most investment managers executing the strategy were CTA’s applying it to futures contracts as “Managed Futures”, though a few of us were doing it with stocks and a global universe of ETFs.
This performance during the crash gave trend following a reputation of being a risk management strategy, or at least a crisis risk hedge. While trend following does have the potential to capitalize on sustained trends and avoid or profit from downtrends, periods of changing trends can be more of a challenge. It depends on the time frame we apply and how we use the signals from trend-following indicators.
According to CME about trend following:
“Trend following systems aim to identify and exploit sustained capital flows across asset classes as markets move back out of and into equilibrium, often after prolonged imbalances. Other CTA styles thrive on volatility and choppy price action that accompanies these flows, as well as a variety of other market phenomena.”
They go on to say:
“The market conditions that have traditionally been difficult for CTAs employing trend following strategies have been those in which there is no follow through on trends, such that prices are mean-reverting. As a result, many CTAs incorporated additional strategies in an effort to capture these types of market characteristics as a complement to their trend following.”
Trend following trading systems are primarily expected to prosper most during periods of strong, clear, and sustained price trends. Some market conditions may be difficult for these strategies. We’ve observed most trend-following strategies have experienced somewhat hostile conditions over the past five years.
A price trend is a price that drifts in one direction or another. Volatility refers to the day-to-day range in price swings. A market condition can be trending or non-trending, volatile or smooth. A condition of strong, clear, sustained, price trends with low volatility may be a more pleasant experience that is easier to stick with. Just the opposite is a market condition with no clear directional price trend that is very volatile in its day-to-day price swings. If the time frame doesn’t match up well, these trend following systems will get whipsawed as they enter a trend just before it reverses back down, or it exits a trend at a low price before it reverses up.
Volatile market conditions are typically hostile conditions for both passive and active strategies. A risk management objective may be to reduce exposure to volatility during these periods. Even a condition of strong, clear, and sustained price trends may be so volatile in its day-to-day range that it may shake us out of otherwise profitable positions. On the other hand, a smooth, clear, sustained price trend may be easier to stick with, but volatility is sometimes low at the end of a sustained trend as investors are complacent just before it reverses.
Although we’ve observed most trend-following and momentum strategies have experienced somewhat unfriendly conditions over the past five years, those of us who have applied them over many market cycles for two decades or more know the systems don’t always match the trends perfectly. However, we have confidence over enough market cycles and trends these methods can be robust and result in asymmetric returns. Sometimes the asymmetric returns are achieved by avoiding large losses as my own systems did 2007 to 2009 and other times by exposure that results in relative outperformance and alpha as I saw 2005 to 2008.
Investment programs can be designed to fit different market conditions, but no system will adapt perfectly to all conditions all the time. An expectation of perfection may be a risk to the investor’s capital if it causes the investor to abandon a good program during a losing streak or drawdown. What investors should focus on is what results the investment manager has achieved over long periods of full market cycles.
For me, I have known that no system will adapt perfectly to all conditions all the time, so I manage my systems to get closer to what I want. I have automated systems that we operated mechanically. That is, the computerized trading programs generate signals and trades that can be executed systematically without any thought or oversight if we wanted. However, I’ve been operating dozens of these systems for 16 years now and was a chartist for years before that. I’ve learned how the systems operated having observed thousands of their signals in real-time in real life. From that, along with already having some skill at charting price trends, I’ve developed intuition about when my systems may be in hostile conditions. As such, in my primary portfolio, I play a shell game with them – pun intended. That is, I observe market conditions such as trend direction, momentum, and volatility expansion and contraction and decide which system to apply, when. The variations are based on trend following vs. countertrend, trend time frames shorter-term to longer-term, and different equations and algorithms to define the trend. These systems are also applied to different universes of markets like individual stocks, sector ETFs, international, bonds, etc.
Back to the WSJ article:
Fortunately, I didn’t follow that trend.
For example, the chart below is the period leading up to the date of the Wall Street Journal article “Computer Models to Investors: Short Everything” so we know how the stock index looked at the time.

Charting the trend another way, here is the same index and time frame, but past on its % off high, which is the drawdown. We observe the stock market index declined nearly -20% from October 2018 to January 2019 and then recovered about 7% of the loss by the date WSJ published the article.
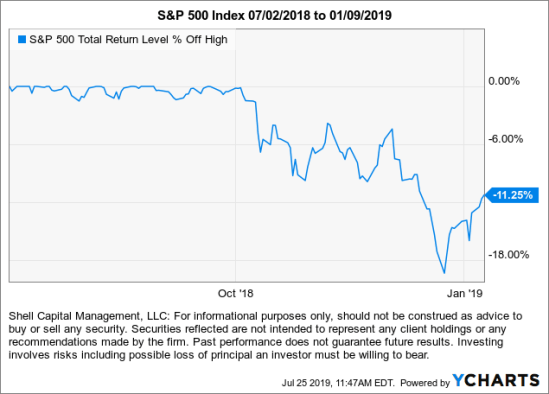
If an investment manager had gone short as the article suggested trend-following models signaled, they would be down about -17% since. Of course, those models could have signaled to reverse from short to long before now.
Fortunately, I didn’t follow that trend. I participated in the last 2018 downtrend more than I prefer, but I’ve since captured the gains in 2019 to make up for it. It’s because in late December I was buying when others were fearful. I increased exposure at lower prices and have held it since. I applied my countertrend strategy, not my trend following strategy. How did I know to do that? I didn’t know for sure, but my analysis suggested a high probability of an asymmetric entry as I shared in An exhaustive analysis of the U.S. stock market and then later in a following An exhaustive stock market analysis… continued.
I sometimes share my observations of market conditions here, but I always write them for myself. Having done this for over two decades now, I don’t underestimate the edge gained from the ability to revisit what I really observed and believed at the time and how it all unfolded. As I suggested in Investors follow the trend after the fact, count on it,

Here we are seven months later and investor sentiment has changed dramatically from absolute panic last December to optimistic and that’s driving prices higher. Investors see headlines of the stock indexes finally reaching all-time new highs again, which probably reinforces their optimism the higher it trends.
So, most trend-following models have already signaled “buy” and be participating in the uptrend. Again, no system will adapt perfectly to all conditions all the time. An expectation of perfection may be a risk to the investor’s capital if their expectations and ego cause them to abandon a good investment program during a losing streak or drawdown.
Self-discipline and persistence seem to be required by all strategies.
We’ll see how it all unfolds from here…
Mike Shell is the Founder and Chief Investment Officer of Shell Capital Management, LLC, and the portfolio manager of ASYMMETRY® Global Tactical.
Mike Shell and Shell Capital Management, LLC is a registered investment advisor and provides investment advice and portfolio management exclusively to clients with a signed and executed investment management agreement. The observations shared on this website are for general information only and should not be construed as advice to buy or sell any security. Securities reflected are not intended to represent any client holdings or any recommendations made by the firm.. Investing involves risk including the potential loss of principal an investor must be willing to bear. Past performance is no guarantee of future results. All information and data is deemed reliable, but is not guaranteed and should be independently verified. The presence of this website on the Internet shall in no direct or indirect way raise an implication that Shell Capital Management, LLC is offering to sell or soliciting to sell advisory services to residents of any state in which the firm is not registered as an investment advisor. Use of this website is subject to its terms and conditions.

You must be logged in to post a comment.