There are several things that unfold as a market begins the topping process. While large cap indexes may continue to make new highs, the market becomes more and more selective. We’ll see that in breadth indicators like bullish percent indexes, Advance Decline Lines, etc. As the market finds fewer and fewer stocks attractive, it becomes more selective, so fewer stocks remain in positive trends.
The current bull market in stocks is about 58 months old. As I explained in The REAL Length of the Average Bull Market the bull markets have averaged about 39 months and bear markets about 17 months. A full market cycle (average bull + bear) is 56 months. The current bull market, then, is longer than the historical average full market cycle. So, it makes a lot of sense to start watching for signs the topping process has started. It’s important to understand a bull markets end with a process of churning up and down and with fewer stocks participating in the last stage of advances.
Below is an example of fewer stocks participating. The S&P 500 Bullish Percent Index shows a composite of the 500 stocks in the S&P 500 index that are in a positive trend. The lower highs made over the past year is beginning to show fewer of those stocks are making buy signals as the S&P 500 index has made new highs. It appears the selectivity is in its early stage as the percent of stocks on a buy signal is still around 70%, but it’s falling. This is just one example of the kind of things I observe when watching for a topping process.
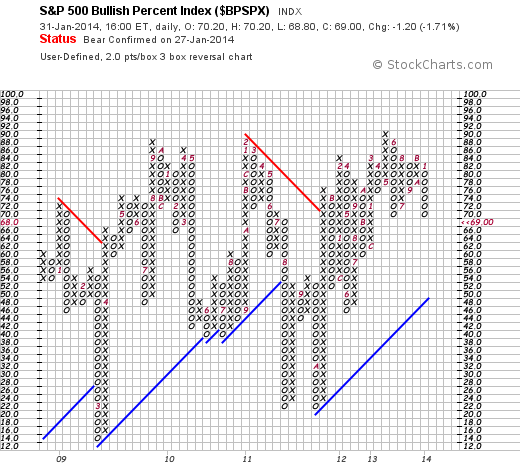
Source: https://stockcharts.com/def/servlet/SC.pnf?c=$BPSPX,P
Below I list a table of several other bullish percent’s for stock indexes. Using Point & Figure terminology, they are either a Bull Top (the chart is falling (in a column of Os) but above 70%) or Bear Confirmed (chart is falling (column of O’s) below 70% and has generated a P&F sell signal). I wouldn’t be surprised to see these get a lot lower in the months ahead. However, what makes it difficult for most people is the process is made up of advances and declines, not usually just a straight down move. The whipsaws up and down is what causes the most trouble.
| Index | Bullish% | Status | Status Change |
| Russell 2000 | 64.03% | Bear Alert | 30-Aug-13 |
| Dow Industrials | 63.33% | Bear Confirmed | 31-Jan-14 |
| NASDAQ 100 | 65.00% | Bear Confirmed | 29-Jan-14 |
| NYSE | 61.55% | Bear Confirmed | 27-Jan-14 |
| Optionable Stocks | 67.60% | Bear Confirmed | 31-Jan-14 |
| S&P SmallCap 600 | 67.55% | Bear Confirmed | 31-Jan-14 |
| AMEX | 63.31% | Bull Confirmed | 2-Jan-13 |
| NASDAQ Composite | 62.68% | Bull Confirmed | 2-Jan-13 |
| Wilshire 5000 | 66.29% | Bull Confirmed | 2-Aug-13 |
| S&P 100 | 70.71% | Bull Top | 13-Dec-13 |
| S&P 500 | 68.41% | Bull Top | 24-Jan-14 |
| S&P Composite 1500 | 70.30% | Bull Top | 28-Jan-14 |
| S&P MidCap 400 | 72.64% | Bull Top | 27-Jan-14 |

You must be logged in to post a comment.