Markets trend in cycles and trends come and go like seasons from spring to summer to fall to winter. I like to observe a range of price trends and behavioral trends from short term to very long term secular trends.
In the 1960s and 1970s, it was the Nifty 50. The Nifty 50 were 50 stocks institutional investors admired.
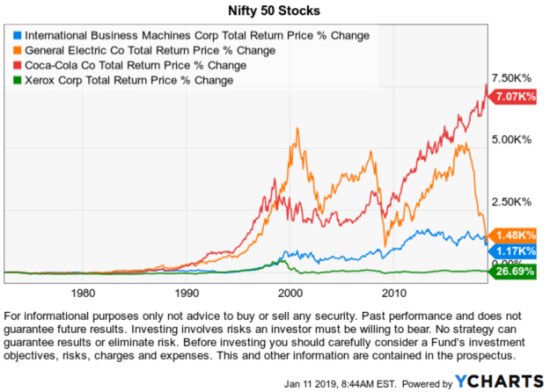
The Nifty 50 stocks got their reputation during the bull market of the 1960s and early 1970s. They were considered “one-decision” stocks because investors were told they could buy and hold the shares forever. Nifty 50 stocks included IBM, General Electric (GE), and Coca-Cola (KO). Some of the Nifty 50 have had problems the past decade, like Xerox and Polaroid. More recently, we can add General Electric to not so nifty list.
The secular bear market of the 1970s started with the 1973–74 stock market crash and lasted until 1982. Valuations of the Nifty 50 fell to low levels along with the rest of the stock market. Most of the Nifty 50 lagged the stock market indexes and then they weren’t so popular afterward. Trends can be fads and come and go, but the one thing we see driving fads in the stock market is their actual price trend. Stocks are loved at all-time highs, not so much after they decline.
Below are three of the better Nifty Fifty stocks. Buying and holding the stocks would require tremendous patience and acceptance of volatility and large drawdowns. Coca-Cola had the best momentum overall. But, who could have held through the drawdown from the late 1990s that lasted a decade? How about Xerox?
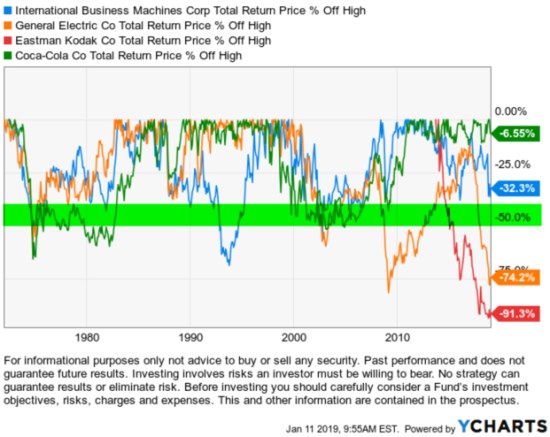
Below are the % off high drawedowns of these “Blue Chips.” A -50% more decline that lasts for years is something an investor would have to tolerate more than once to own the stocks long term. This is why buy and hold investing doesn’t work for most investors.
Then in the 1990s, it was the tech stocks especially those involved in the Internet. More specifically, the “.com” stocks was a whole new level of popularity and euphoria. The overall stock market reached its highest valuation levels, ever. Most of the .com stocks no longer exist. Some of the technology stocks involved in building the infrastructure still do, like Cisco (CSCO), Microsoft (MSFT), Oracle (ORCL), and Qualcomm (QCOM). But, many of the momentum stocks of the 1990s aren’t around to see their charts.
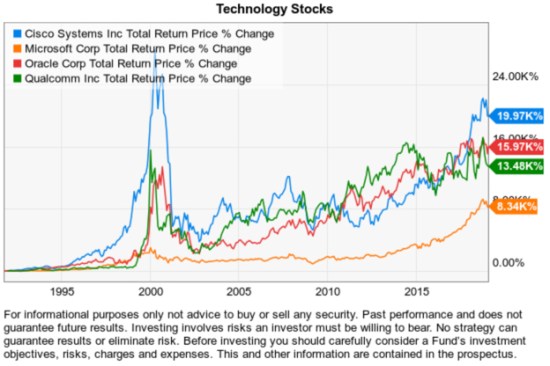
If investors only focused on is the right side of the chart, those several thousand percent gains look exciting. But, in the real world, even a -20% decline in the stock indexes as we saw in 2018 causes investor fear and panic selling. The investors holding the above stocks would probably need to be asleep at the wheel to have held them long term.
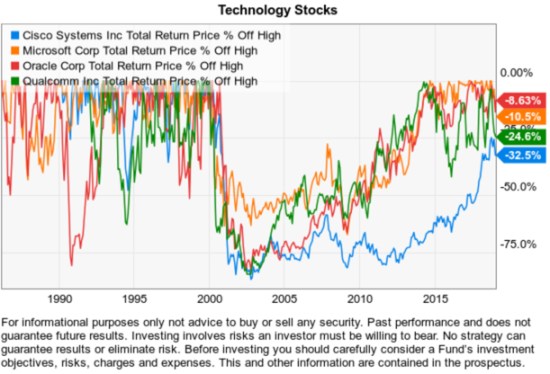
Looking at the total return alone isn’t sufficient, so I like to observe what I call the ASYMMETRY® Ratio, which is the total return chart above along with the drawdown. The ASYMMETRY® Ratio gives us a full picture of the asymmetric risk-reward if there is one. Clearly, the downside drawdowns were brutal by any measure. Maybe even more brutal than the Nifty 50.
Those are the momentum trends of the past.
Today we have the FAANG stocks. It stated as FANG and has since extended to FAANG. The FAANG stocks are Facebook (FB), Apple (AAPL), Amazon (AMZN), Netflix (NFLX), and Google (GOOG). They have been some of the most popular momentum stocks and for good reason. These are some of todays greatest companies. Who can imagine Netflix going away today? Who could have imaged online Netflix taking out Blockbuster? Who can imagine Amazon eventually taking out Netflix? What if Walmart (WMT) or Target (TGT) figure out a way to compete with both? The reality is, there is probably some small company out there we don’t know about that will be the next big winner. We don’t have to attempt to find the needle in the haystack, we can just focus on the price trends and they’ll show up eventually.
I shared my observations in FANG Stocks were the Leaders but now the Laggards so I won’t rehash it. My mission here is a short term update.
So far in 2019, all of the FAANG stocks are trending up except for Apple (AAPL). Only one of the FAANG stocks have had stronger momentum than the First Trust Dow Jones Internet ETF (FDN) which is a more diversified version of FAANG type internet industry stocks. The clear leader has been Netflix (NFLX). Here is a chart over the past month:

The ASYMMETRY® Ratio looking at the total return vs. % off high drawdown gives us a better picture of asymmetric risk-reward. Below is their total returns over the past year.
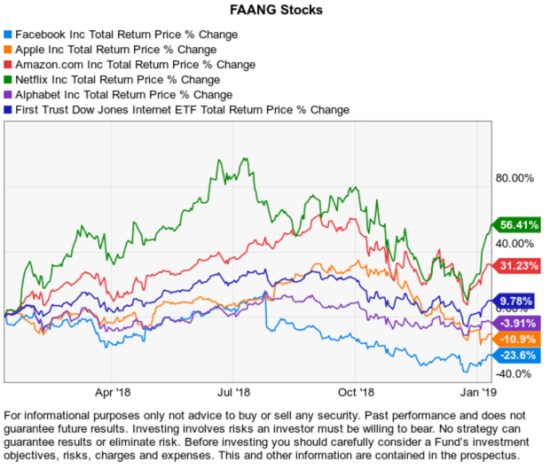
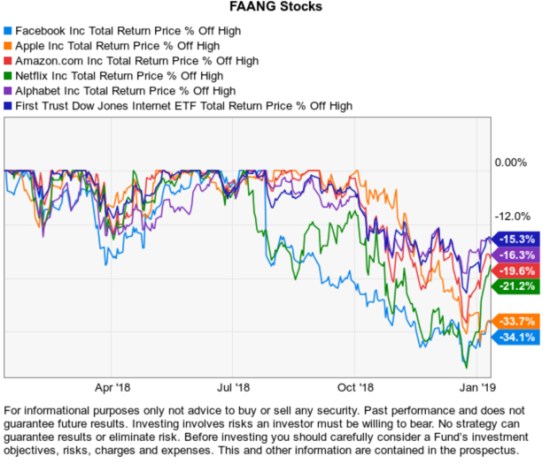
The FAANG stocks clearly have their downside risks and all of them are in drawdowns as we see below. However, they are recovering and the diversification of the ETF helped reduce its drawdown relative to the individual stocks.
We’ll see if the FAANG stocks resume their prior momentum we’ve seen over the past several years.
Mike Shell is the Founder and Chief Investment Officer of Shell Capital Management, LLC, and the portfolio manager of ASYMMETRY® Global Tactical.
The observations shared on this website are for general information only and are not specific advice, research, or buy or sell recommendations for any individual. Investing involves risk including the potential loss of principal an investor must be willing to bear. Past performance is no guarantee of future results. The presence of this website on the Internet shall in no direct or indirect way raise an implication that Shell Capital Management, LLC is offering to sell or soliciting to sell advisory services to residents of any state in which the firm is not registered as an investment advisor. Use of this website is subject to its terms and conditions.

You must be logged in to post a comment.