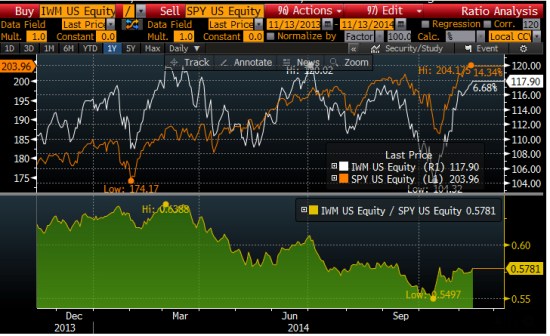
A quick follow up to my recent comments about the down trend in smaller company stocks in Playing with Relative Strength and Stock Market Peak? A Tale of Two Markets below is a chart and a few observations:
Source: Bloomberg/KCG
A few observations of the trend direction, momentum, and relative strength.
- The S&P 500 index (the orange line) of large company stocks has been in a rising trend of higher highs and higher lows (though that will not continue forever).
- The white line is the Russell 2000 small company index has been in a downtrend of lower highs and lower lows, though just recently you may observe in the price chart that it is at least slightly higher than its August high. But it remains below the prior two peaks over the past year. From the time frame in the chart, we could also consider it a “non-trending” and volatile period, but its the lower highs make it a downtrend.
- The green chart at the bottom shows the relative strength between S&P 500 index of large company stocks and the Russell 2000 small company index. Clearly, it hasn’t taken all year to figure out which was trending up and the stronger trend.
- Such periods take different tactical trading skills to be able to shift profitability. When markets get choppy, you find out who really knows what they’re doing and has an edge. I shared this changing trend back in May in Stock Market Peak? A Tale of Two Markets.
If you are unsure about the relevance of the big picture regarding these things, read Playing with Relative Strength and Stock Market Trend: reverse back down or continuation? and Stock Market Peak? A Tale of Two Markets.

You must be logged in to post a comment.