ASYMMETRY® Observations are Mike Shell’s observations of investor behavior causing directional price trends, global macro, tactical ETF trading, momentum stock trading, hedging, volatility trading, and risk management that creates asymmetric investment returns. An asymmetric return profile is a risk/reward profile with a positive asymmetry between profit and loss. Mike Shell is the founder of Shell Capital Management, LLC and the portfolio manager of ASYMMETRY® Global Tactical
When industry performance disperses this widely, the opportunity for asymmetric positioning multiplies. Whether through long/short pairs, structured options, or sector rotation with predefined exits, we may use this dashboard data to seek positive asymmetry—capping downside while preserving exponential upside. At Shell Capital, this is the edge we pursue in dynamic markets.
You wouldn’t know it from watching the VIX index alone, but something interesting is happening beneath the surface. The VIX futures curve — the structure that really drives volatility-linked products like VXX, VIXY, and UVXY — is showing signs of indecision. Here’s what it means for asymmetric hedging.
The stock market is a constant battle between buying pressure and selling pressure, and recently, that battle has shifted in a meaningful way. After a strong rally earlier in the year, we’ve now seen a notable change in the risk/reward asymmetry. Markets don’t move in a straight line, and shifts in trend strength often signal the potential for new opportunities—or new risks. Read more: The Stock Market Risk/Reward Asymmetry Has Shifted
Ray Dalio and Elon Musk see the U.S. debt problem for what it is: an unsustainable ticking time bomb.They aren’t just speculating—they’re using decades of experience in finance, economics, and business to sound the alarm.And when two of the sharpest minds in their fields are saying the same thing, it’s time to connect the dots.
Howard Marks has a unique ability to distill complex market dynamics into clear, actionable insights, and his latest memo, “On Bubble Watch,” is no exception. It’s a powerful reminder of the importance of recognizing the telltale signs of a market bubble, the psychology driving it, and the necessary caution that comes with it.
The ICE BofA US High Yield Index Option-Adjusted Spread (OAS) is a key measure of risk sentiment in the credit markets. Historically, extreme levels in credit spreads have preceded major shifts in market conditions, often serving as a leading indicator for broader financial stress or recovery.
Today, as we find ourselves in one of the tightest credit spread environments in decades, it’s worth asking: Are investors underpricing risk, and does it present an asymmetric opportunity?
For more than two decades, I’ve required a mathematical basis to maintain confidence in my decisions, especially during challenging periods inherent in every investment or trading strategy.
Many investors believe they are pursuing asymmetric opportunities when they buy stocks they think are undervalued or have more upside than downside.
But true asymmetry isn’t just about perceived valuation gaps—it’s about structuring risk in a way that limits the downside while allowing for uncapped or asymmetric upside.
The reality is, just buying a stock you think is undervalued doesn’t create asymmetry.
It may offer potential upside, but if there’s no predefined risk management, the downside remains open-ended.
Asymmetry isn’t about hoping you’re right—it’s about ensuring that even if you’re wrong, the damage is controlled, and if you’re right, the reward is exponentially greater.
The Flawed Assumption of “Undervalued” Stocks
Many investors assume they have an asymmetric opportunity when they buy a stock trading below what they believe to be its intrinsic value.
The thinking goes:
The downside is “limited” because the stock is already cheap.
The upside is large because the market will eventually recognize its value.
The problem?
Cheap stocks can get cheaper, and markets don’t always correct “mispricings” in a timely manner—if ever.
Many deep-value stocks stay undervalued for years, and some go to zero.
Buying something just because it “should” go up does nothing to limit risk.
A true asymmetric investment isn’t just about identifying opportunities with more upside than downside—it’s about structuring the position to ensure a capped downside and disproportionate upside.
There are several ways we do this:
Options Strategies: Buying call options allows for defined risk (the premium paid) with unlimited upside potential. Likewise, strategies like risk reversals or spreads can enhance asymmetry.
Stop-Losses & Exit Strategies: Setting a predefined exit point ensures the downside is controlled rather than open-ended.
Hedging & Position Sizing: Using hedges or maintaining proper position sizing ensures that no single position can derail a portfolio.
The Key Difference: Hope vs. Structure
The key distinction is that just buying something undervalued is based on hope, while structuring asymmetric trades is about controlling risk.
Hope is not a strategy—a predefined downside is.
If you enter a trade where: 1. Downside is capped (through predefined exits or contractual limits like options). 2. Upside is uncapped or exponentially larger (through compounding, leverage, or event-driven catalysts). 3. The approach is repeatable (not relying on luck but a systematic framework).
Then you are truly executing an asymmetric strategy.
But the process of creating asymmetric investment returns doesn’t stop there; it continues at the portfolio level.
Conclusion: Asymmetry Is Intentional, Not Accidental
Simply believing a stock has more upside than downside does not create asymmetric risk/reward—it’s just a market opinion. Asymmetry must be structured in advance, not assumed after the fact.
For investors who seek true asymmetric payoffs, the focus shouldn’t just be on finding “cheap” stocks but on structuring trades where the worst-case scenario is predefined and limited while the best-case scenario remains disproportionately large.
That’s the difference between hoping for a high return and engineering an asymmetric edge like we do.
Volatility in general, and VIX in particular, is widely thought to influence hedge fund returns. This article shows that not only is VIX negatively correlated to hedge fund returns, the correlation profile is asymmetric with the correlation being more negative in negative months for hedge funds. When hedge funds are delivering the worst quartile returns, the diversification benefit is best. Equally interestingly, when the diversification or protection is least needed, i.e. in highest quartile months, the correlation is positive. It is explored whether a small allocation to VIX can be constructively used for risk reduction or downside protection in broad based hedge fund portfolios. Standard mean variance measures suggest a static allocation of 0% to 10%, which is consistent with the common sense approach of allocation only a very small portion of the portfolio to volatility. This range, together with the mean reverting property of VIX, and the asymmetric correlation of VIX and hedge fund returns is used to explore a tactical allocation strategy that outperforms a simple static allocation of VIX or a portfolio with no VIX allocation on a risk adjusted basis, while reducing downside risks.
Bridgewater Associates, Inc.Co-CIO Karen Karniol-Tambour joins Positive Sum CEO Patrick O’Shaughnessy at the 2023 Sohn Investment Conference. Below is the interview she says the market is very asymmetric right now because of the asymmetry between the upside vs. the downside, and I agree.
I’ll summarize:
If the economy enters a recession, it’s very bad for stocks, and this time the Fed is unlikely to immediately respond by lowering rates since inflation is a problem. So, the downside risk is large. It’s already priced-in to the stock market, so it won’t be a big surprise. Not a lot of upside potential.
If the economy doesn’t enter a recession, the Fed will be in a tough decision point, because inflation is unlikely to come down without a recession. If the Fed doesn’t ease like it’s already price-in, the market is going to be disappointed.
It’s asymmetric because the downside potential is greater than the upside.
The interview:
Patrick O’Shaughnessy:
What do you think that prevailing valuations, let’s say, just on like the big asset classes tell us about what the market thinks is going on? Like, what does it seem like is in prices right now, if you will, as you look at S&P 500 you know, multiples or something very basic like that?
Bridgewater Co-CIO Karen Karniol-Tambour:
WellI think the stock market is telling you that there’s going to be a modest economic slowdown, a pretty contained economic slowdown, nothing like you know a significant recession or anything like that, With that slowdown alone, the Federal Reserve is going to find that sufficient to go ease from you know, 5% to 3% extremely quickly, and that its going to do that despite where inflation is today because inflation is going to go back to totally reasonable levels that they want very very quickly. You see that kind of across stock and bond pricing you know bond pricing is telling you in places to be fine we’re not there’s no inflation from anything like resembling long term and the Fed’s about to ease pretty significantly without a significant slowdown.
Where that sort of leaves you is if the market I believe is asymmetric it’s very asymmetric because it you actually get an economic slowdown; that’s obviously very bad for stocks. I don’t have to tell you that that would be you know pretty bad for stocks. But there’s really not much of a recession priced into them it would be pretty bad. Usually the way you get out of that (as I was saying) is that every time there’s a slowdown the Central Bank just comes and eases right away. Now, not only will it be much harder for them to ease because inflation’s been more a problem. Tension is there, but that easing is already priced in and so even if they do kind of bite the bullet and say “I’m not going to worry about inflation” and ease, it’s already in the market prices it’s not going to surprise the market so much.
Then, on the other hand, if the market doesn’t slow, if the economy doesn’t slow so much, if we don’t get that kind of recession if the equity prices are right that you’re not going to get a big recession and the fed’s going to be a tough spot because I don’t really see why inflation’s going to come down with no recession. You have a very very strong labor market if nothing slows and so if they don’t ease like it’s already price they’re going to be disappointing. So, every day once we hit summer the Federal Reserve doesn’t pivot and ease that’s effectively a tightening relative to what’s priced in that’s also disappointing.
That’s a lot of room for disappointment that can happen whether the economy is strong or weak.
Patrick O’Shaughnessy:
That’s all sort of like what I’ll call you know relatively near to intermediate term future how do you think about portfolio positioning in light of that general view when you know like you for a long time it’s paid to just be long risk and have a very simple portfolio because of everything you’ve discussed. How’s that different today like how would you how do you think about positioning against this asymmetric setup that you described
Karen Karniol-Tambour:
I think it’s one of the toughest times to be an investor in many years because you know as you’re saying risk assets has been so good and I think risk assets are about as unattractive as we’ve seen a very long time and they’ve and that’s we’re seeing that come to fruition they don’t just bounce back you don’t just get kind of automatic rallies no matter what so it’s a hard time to be an investor I think as an investor you have to think about diversification in a different way diversification just wasn’t that important because the one asset people hold “equities” was just the strongest outperformer and the different places investors can kind of look they can look at geographically so they can look at geographies that have less of this tension places like Japan or China where you’re in a different situation you’re not about to hit a big Central Bank tension Japanese Central Bankers are pretty excited about getting higher inflation they’ve won for a long time and it’s far from, you know, out of control.
She basically suggests U.S. stocks are overrated and Japan stocks, Emerging Markets stocks, and Gold, are underrated.
“Although the cheetah is the fastest animal in the world and can catch any animal on the plains, it will wait until it is absolutely sure it can catch its prey. It may hide in the bush for a week, waiting for just the right moment.
It will wait for a baby antelope, and not just any baby antelope, but preferably one that is also sick or lame; only then, when there is no chance it can lose its prey, does it attack.
That, to me, is the epitome of professional trading.
When I trade at home, I often watch the sparrows in my garden.
When I feed them bread, they take just a little piece at a time and fly away. They keep on flying back and forth, taking small bits of bread. They may have to make a hundred stabs at a piece of bread to get what a pigeon gets at one time, but that is why a pigeon is a pigeon.
You will never be able to shoot a sparrow, it is just too fast.
That is the way I day trade.
For example, there are times during the day when I am sure that the S&P is going up, but I don’t try to pick the bottom, and I am out before it tops. I just take the mid-range where the momentum is greatest.
We’re entering a point in the stock market trend that could be an inflection point. My market risk indicators are elevated, suggesting DEFENSE, but they’re imperfect. In bear markets, we’ll see lots of whipsaws and head fakes, and OVERBOUGHT and EXTENDED can continue.
Our objective is asymmetric risk/reward for asymmetric investment returns; we are unconstrained as to strategy or market.
A skillful trend follower wants to catch a trend early in its stage and capitalize on it until it ends, so if we want to identify them early, we must necessarily focus on short-term trends to see if they can become longer-term trends and asymmetric profits.
With that said, in the month of October 2022, eight of the eleven sectors tracked by S&P sector indices are in the green, and three are in the red.
Volatility measures the frequency and magnitude of price movements, both up and down, that a financial instrument experiences over a certain period of time. The more dramatic the price swings in that instrument, the higher the level of volatility. Volatility can be measured using actual historical price changes (realized volatility) or it can be a measure of expected future volatility that is implied by option prices.
A whipsaw in trading and investment management is when you enter a trend and it almost immediately reverses in the other direction, resulting in a loss.
Whipsaws are a normal part of any trend system because trends do reverse, and sometimes sooner than you expect.
“The breadth thrusts we’ve seen are typical of a new uptrend — unless* it’s a prolonged bear market. *IF this is the early stage of a prolonged bear market that is likely accompanied by a recession, then we’ll see many swings like this as it unfolds along the way.”
The stock index and the most weighted sectors like technology and consumer discretionary are very close to breaking price levels that should be short-term support.
Any further decline will increase the odds the U.S. is in the early stage of a prolonged bear market, which will include many swings up and down of 10 to 20% lasting several weeks.
Such swings lead to whipsaws for many tactical traders as they enter just in time to catch the top, and/or sell just in time the trend reverses in the other direction.
I’ve tactically operated through this many times before over more than two decades, and I’ve historically shown my edge during these conditions.
I have a hunch we’re going to hear the word “whipsaw” a lot in the coming months, so let’s go ahead and kick it off with The Whipsaw Song I had fun with back in April 2008 when Ed Seykota published it.
Give it a listen!
Mike Shell is the Founder and Chief Investment Officer of Shell Capital Management, LLC, and the portfolio manager of ASYMMETRY® Managed Portfolios. Mike Shell and Shell Capital Management, LLC is a registered investment advisor focused on asymmetric risk-reward and absolute return strategies and provides investment advice and portfolio management only to clients with a signed and executed investment management agreement. The observations shared on this website are for general information only and should not be construed as investment advice to buy or sell any security. This information does not suggest in any way that any graph, chart, or formula offered can solely guide an investor as to which securities to buy or sell, or when to buy or sell them. Securities reflected are not intended to represent any client holdings or recommendations made by the firm. In the event any past specific recommendations are referred to inadvertently, a list of all recommendations made by the company within at least the prior one-year period may be furnished upon request. It should not be assumed that recommendations made in the future will be profitable or will equal the performance of the securities on the list. Any opinions expressed may change as subsequent conditions change. Please do not make any investment decisions based on such information, as it is not advice and is subject to change without notice. Investing involves risk, including the potential loss of principal an investor must be willing to bear. Past performance is no guarantee of future results. All information and data are deemed reliable but are not guaranteed and should be independently verified. The presence of this website on the Internet shall in no direct or indirect way raise an implication that Shell Capital Management, LLC is offering to sell or soliciting to sell advisory services to residents of any state in which the firm is not registered as an investment advisor. The views and opinions expressed in ASYMMETRY® Observations are those of the authors and do not necessarily reflect the position of Shell Capital Management, LLC. The use of this website is subject to its terms and conditions.
The stock market is now reaching its first short-term higher probability of a countertrend pullback.
The S&P 500 stock index tapped its 200-day average and reached a short-term overbought level based on relative strength and volatility and is now stalling.
The S&P 500 Equal Weight, which gives an equal weighting to all 500 stocks instead of more exposure to the largest companies based on capitalization, crossed above its 200-day average but was reaching an overbought level at the same time.
So, it’s not surprising to see these market proxies roll over at this level.
Two weeks ago I pointed out in The stock market is at an inflection point the S&P 500 was stalling as if there is resistance at this price level, and there’s a lot of potential supply for those in a loss trap, and it was getting overbought as measured by the relative strength index. The index trended up a few more percent before pulling back today.
I don’t normally trade the S&P 500 index, I just use it as a proxy for the overall stock market.
For portfolio management, I get more granular into the sectors inside, and the stocks.
I also include global markets like commodities, bonds, and other alternatives, to provide a global unconstrained opportunity set to find potentially profitable trends.
Trend systems just want to be fed some trends, so the system can extract the parts it wants from the parts it doesn’t want. It’s best to provide a wide range of uncorrelated price trends for trend systems to create a unique return stream from them.
From the broad index like the S&P 500 it’s useful to look inside to see the percentage of stocks that are trending above their 50-day and 200-day averages to gauge the strength of participation in the uptrend.
The percent of S&P 500 stocks trending above the 50-day average has quickly trended up to the red zone.
Multiple overbought levels in breadth and relative strength oscillators are a sign of strength, not weakness.
The breadth thrusts we’ve seen are typical of a new uptrend — unless* it’s a prolonged bear market. *IF this is the early stage of a prolonged bear market that is likely accompanied by a recession, then we’ll see many swings like this as it unfolds along the way.
However, once most stocks are already in uptrends, the enthusiasm to buy may have run out, so I consider the level above 80% to be a higher risk zone. If we are looking for a lower risk entry, it’s below 30%. A strong breadth thrust like this is bullish when it starts and is typical off the lows after stocks have already trended down as much as they have.
At this point, despite the S&P 500 being down 1.5% today, it appears to be a normal pullback from overbought levels. Our relative strength index signals the index was moving up with such velocity it was a little too far, too fast, which is good in the longer term but increased the odds of a retrench in the short term.
I reduced exposure earlier this week, and the price action next week will determine if we reduce further or buy the dip at lower prices.
In the big picture, we’re strolling into the seasonally weakest month for the stock market after a big rally and no shortage of risks to the short-term uptrend, so it’s essential to determine an exit, hedge, or reduce exposure.
On the positive side, the recent decline in volatility and new uptrends suggest systematic trend-following investment programs could provide inflows of several billion dollars a day in stocks for the next few months if it continues.
While everyone else is trying to figure out what’s going to happen next with inflation, rates, and other global macro issues, we focus on keeping our hard-earned capital invested in the direction of the trend.
If the trends change, so will we.
Mike Shell is the Founder and Chief Investment Officer of Shell Capital Management, LLC, and the portfolio manager of ASYMMETRY® Managed Portfolios. Mike Shell and Shell Capital Management, LLC is a registered investment advisor focused on asymmetric risk-reward and absolute return strategies and provides investment advice and portfolio management only to clients with a signed and executed investment management agreement. The observations shared on this website are for general information only and should not be construed as investment advice to buy or sell any security. This information does not suggest in any way that any graph, chart, or formula offered can solely guide an investor as to which securities to buy or sell, or when to buy or sell them. Securities reflected are not intended to represent any client holdings or recommendations made by the firm. In the event any past specific recommendations are referred to inadvertently, a list of all recommendations made by the company within at least the prior one-year period may be furnished upon request. It should not be assumed that recommendations made in the future will be profitable or will equal the performance of the securities on the list. Any opinions expressed may change as subsequent conditions change. Please do not make any investment decisions based on such information, as it is not advice and is subject to change without notice. Investing involves risk, including the potential loss of principal an investor must be willing to bear. Past performance is no guarantee of future results. All information and data are deemed reliable but are not guaranteed and should be independently verified. The presence of this website on the Internet shall in no direct or indirect way raise an implication that Shell Capital Management, LLC is offering to sell or soliciting to sell advisory services to residents of any state in which the firm is not registered as an investment advisor. The views and opinions expressed in ASYMMETRY® Observations are those of the authors and do not necessarily reflect the position of Shell Capital Management, LLC. The use of this website is subject to its terms and conditions.
During the waterfall decline in March 2020, the Cboe S&P 500 5% Put Protection IndexSM (PPUT) successfully hedged off stock market beta, but it hasn’t done the same in 2022.
The green highlight shows the Cboe S&P 500 5% Put Protection IndexSM in black and S&P 500 stock index in red. Clearly, the systematic put protection index helped to hedge off downside risk in the SPX during the waterfall decline of March 2020, but that same hedge hasn’t protected long beta portfolios in 2022.
Cboe S&P 500 5% Put Protection IndexSM (PPUT) tracks the value of a hypothetical portfolio of securities (PPUT portfolio) designed to protect an investor from negative S&P 500 returns. The PPUT portfolio is composed of S&P 500® stocks and of a long position in a one-month 5% out-of-the-money put option on the S&P 500 (SPX put).
Let’s see what happened over these two very different outcomes, and I’ll share my observations of what changed that impacted the outcomes.
Using data from YCharts, we see the full year 2020 in the chart comparing the S&P 500 Total Return Index (SPX) to the Cboe S&P 500 5% Put Protection IndexSM (PPUT) which is long the SPX, but adds one-month 5% out-of-the-money put option on the S&P 500 (SPX puts) options to hedge.
For the systematic put hedge strategy, 2020 was a fine example of risk management resulting in not only drawdown control, but also how avoiding large losses can increase the portfolio return in some conditions.
The S&P 500 declined over -30% around March 2020 as COVID spread, but the 5% SPX put lowered the drawdown to -16.52%.
That’s asymmetry and a key part of creating asymmetric investment returns.
The 5% put hedging strategy limited the downside by 50%, then went on to allow the long-only exposure to the S&P 500 to nearly double the stock index.
Naturally, the incredible performance of this very simple systematic hedging strategy tracked by PPUT got some attention after it performed so well. But, no method is perfect, and all strategies are fallible.
Fast forward to 2022, and the outcome has been completely different. Investors and traders who relied on a 5% monthly put option have fully participated in the downside of the SPX this year.
This phenomenon has driven many to ask, why such a radically different outcome?
I’ll attempt to explain my observations as succinctly as possible because understanding derivatives like options is the most complex task in the capital markets for most people.
For more than two decades, I’ve focused on alternative trading strategies in pursuit of asymmetric payoffs that lead to asymmetric investment returns.
Asymmetry isn’t just about finding low-risk positions that offer a higher expected payoff, like a 2-to-1 reward to risk.
Instead, asymmetry is even more focused on limiting the downside in hopes to avoid the negative asymmetry of loss.
Losses compound against us exponentially the deeper we allow losses to get.
So, my focus has been actively trading momentum growth stocks, tactically trading more systematically a global universe of ETFs, and volatility trading/hedging, all of which are unconstrained in my primary portfolio.
So, I have a unique perspective on this topic.
The short and sweet answer to why this time was so different than 2020 is a function of these issues.
During the waterfall decline of March 2020, prices spread out (to the downside) very quickly. It was one of the sharpest waterfalls in history. When prices spread out, I call it a volatility expansion, and rising vol increases the premium for options. For the same reason, the VIX spiked to > 80 in March 2020, but it’s been constrained under 40 so far in 2022.
This year, the stock indices have declined over -20%, but it’s been a much slower grind down. SPX is down about -20% over six months instead of down over -30% in three weeks. The speed of prices spreading out is volatility, and volatility is a significant driver of option premiums. Think of it this way: home insurance in Florida is expected to be cheaper before a catastrophic hurricane when people are complacent than after the hurricane does its damage. The good news is, that options pricing allows for better timing of relative value if you have a system for it.
Another difference is the luck of roll and expiration dates for this systematic strategy that executes about every 30 days. My friend Russell Rhoads, who is one of the most well-known VIX experts, pointed out to me that the ability to use a series that expires on days that don’t contribute to the VIX calculation would have been helpful this year. That is, the systematic strategy of buying 30-day SPX put options has the potential to fall on days that aren’t efficient. The roll is a risk.
Finally, we believe most institutional money managers were already hedged. This has been a long drawn-out decline, a lower vol downtrend, so it’s given time for money managers to add protection, so demand for puts hasn’t been a spike, but instead more methodical.
The bottom line is the asymmetric volatility phenomenon has impacted the put option hedging strategy.
The asymmetric volatility phenomenon suggests that prices trend down faster and sharper than they trend up, which can be an advantage of put option hedging, or a disadvantage when it’s calmer like this year.
All of the above has also kept the VIX below 40 this year.
Mike Shell is the Founder and Chief Investment Officer of Shell Capital Management, LLC, and the portfolio manager of ASYMMETRY® Managed Portfolios. Mike Shell and Shell Capital Management, LLC is a registered investment advisor focused on asymmetric risk-reward and absolute return strategies and provides investment advice and portfolio management only to clients with a signed and executed investment management agreement. The observations shared on this website are for general information only and should not be construed as investment advice to buy or sell any security. This information does not suggest in any way that any graph, chart, or formula offered can solely guide an investor as to which securities to buy or sell, or when to buy or sell them. Securities reflected are not intended to represent any client holdings or recommendations made by the firm. In the event any past specific recommendations are referred to inadvertently, a list of all recommendations made by the company within at least the prior one-year period may be furnished upon request. It should not be assumed that recommendations made in the future will be profitable or will equal the performance of the securities on the list. Any opinions expressed may change as subsequent conditions change. Please do not make any investment decisions based on such information, as it is not advice and is subject to change without notice. Investing involves risk, including the potential loss of principal an investor must be willing to bear. Past performance is no guarantee of future results. All information and data are deemed reliable but are not guaranteed and should be independently verified. The presence of this website on the Internet shall in no direct or indirect way raise an implication that Shell Capital Management, LLC is offering to sell or soliciting to sell advisory services to residents of any state in which the firm is not registered as an investment advisor. The views and opinions expressed in ASYMMETRY® Observations are those of the authors and do not necessarily reflect the position of Shell Capital Management, LLC. The use of this website is subject to its terms and conditions.
Nothing drives investor sentiment like a strong price trend.
The S&P 500 stock index is down over -20% this year, and it was down -24% YTD just two weeks ago.
The stock index peaked at the end of last year and is down about -13% over the past 12 months.
But that’s not all.
This time it’s different.
I’ve been warning here for years all the Fed intervention would eventually have to stop, and it would also drive down bond prices, too.
The ICE US Treasury 20+ Year Index is down -23% this year, so long-term U.S. Treasury bonds are down even more than the stock index.
The ICE US Treasury 20+ Year Index peaked July 27, 2020, and has since declined by -32%, far more than stocks.
As warned, bonds are no longer a crutch for declining stocks.
Bonds have been worse.
The Federal Reserve FOMC and U.S. Treasury are no longer accommodating higher stock and bond prices, or applying the “Fed Put” as we call it.
Since 2008, the Feds have stepped in to support the economy and the markets by providing unpreceded liquidity, which has eased selling pressure in waterfall declines and made the market more optimistic.
Fed intervention has resulted in a windfall for stock and bond investors since.
You can no longer rely on the Fed to step in to support market prices.
The challenge today is we’ve never seen the Fed provide such support for stocks and bonds as it has post-2008, so the windfall stock/bond investors have received has now come due.
I had been warning of it:
It’s eventually going to be payback time for the windfall stock market investors have received over the last decade – if you don’t actively manage risk for drawdown control.
Stocks had reached the second-highest most expensive valuation in 140 years, and as you can see in the above chart, and stayed there for the last decade.
High valuations could previously be justified by low inflation, but clearly, that’s no longer the case.
Nothing drives investor sentiment like a strong price trend.
As prices are trending up, investors and traders get more and more bullish, optimistic, and confident.
As prices fall into downtrends, investors and traders get more and more bearish, pessimistic, unsure, doubtful, and outright scared.
Although we tilt more optimistic or pessimistic as a personality trait, by and large investor behavior changes more in downtrends than uptrends.
The prospect theory says that investors value gains and losses differently, placing more weight on perceived gains versus perceived losses.
Prospect theory is also known as the loss-aversion theory.
With Prospect Theory, the work for which Daniel Kahneman won the Nobel Prize, he proposed a change to the way we think about decisions when facing risk, especially financial. Alongside Tversky, they found that people aren’t first and the optimal utility maximizes, but instead react to changes in terms of gains and losses.
In short, Prospect Theory suggests investors are loss-averse, so our risk reward preferences are asymmetric.
We prefer asymmetric investment returns; we want more of the upside, and less of the downside.
Clearly, want can’t receive asymmetric investment returns from just buying and holding risky markets, bonds included.
I believe asymmetric investment returns are pursued by our focus on asymmetric payoffs and positive mathematical expectation over many trades.
ASYMMETRY® is about more upside than downside, an average, over a period of many buys and sells.
ASYMMETRY® is about producing higher average gains than losses, or a positive expectancy.
Back to investor sentiment.
AAII Investor Sentiment remains very asymmetric, though it has shifted more neutral, it remains BEARISH.
The Fear & Greed IndexFear & Greed Index, which is driven by 7 market indicators instead of a sentiment survey, remains in the EXTREME FEAR zone.
EXTREME levels of FEAR or GREED are usually a contrary indicator, but in a prolonged bear market, bearish sentiment is like a pressure cooker.
Investors who hold their losses too long get caught in a LOSS TRAP.
A loss trap is like the Chinese Finger Pull game.
The harder you pull, the tighter the loss trap.
It’s why I predefined my risk in advance, to cut losses short rather than allow losses to grow large and larger.
The LOSS TRAP is not fun, and can be very costly.
Don’t let smaller losses become larger and larger losses, or you’ll be caught in the trap, and the harder you resist, the tighter it gets.
The Fear & Greed Index peaked on November 9th and has since printed lower highs and lower lows; a downtrend.
At this point, the prolonged trend in investor fear suggests this may be the early stages of a prolonged bear market, so govern yourself accordingly.
It’s why I tactically trade market trends.
It’s why I actively manage my risk in each position and across the entire portfolio for drawdown control.
The windfall buy-and-hold passive investors have received from the U.S. stock market from Fed action is due for payback.
Our ASYMMETRY Managed Portfolio has been positive for the year.
Though past performance is never a guarantee of future results, this is when I’ve historically revealed an edge.
When the wind is blowing, we can cast the sail ride and enjoy the ride.
But when the wind stops blowing, we have to get out the oars or risk sinking.
We are a fiduciary money manager fully committed to guiding our clients.
Mike Shell is the Founder and Chief Investment Officer of Shell Capital Management, LLC, and the portfolio manager of ASYMMETRY® Managed Portfolios. Mike Shell and Shell Capital Management, LLC is a registered investment advisor focused on asymmetric risk-reward and absolute return strategies and provides investment advice and portfolio management only to clients with a signed and executed investment management agreement. The observations shared on this website are for general information only and should not be construed as investment advice to buy or sell any security. This information does not suggest in any way that any graph, chart, or formula offered can solely guide an investor as to which securities to buy or sell, or when to buy or sell them. Securities reflected are not intended to represent any client holdings or recommendations made by the firm. In the event any past specific recommendations are referred to inadvertently, a list of all recommendations made by the company within at least the prior one-year period may be furnished upon request. It should not be assumed that recommendations made in the future will be profitable or will equal the performance of the securities on the list. Any opinions expressed may change as subsequent conditions change. Please do not make any investment decisions based on such information, as it is not advice and is subject to change without notice. Investing involves risk, including the potential loss of principal an investor must be willing to bear. Past performance is no guarantee of future results. All information and data are deemed reliable but are not guaranteed and should be independently verified. The presence of this website on the Internet shall in no direct or indirect way raise an implication that Shell Capital Management, LLC is offering to sell or soliciting to sell advisory services to residents of any state in which the firm is not registered as an investment advisor. The views and opinions expressed in ASYMMETRY® Observations are those of the authors and do not necessarily reflect the position of Shell Capital Management, LLC. The use of this website is subject to its terms and conditions.
Implied volatility is indicating another possible volatility expansion.
The VIX index is a calculation designed to produce a measure of a constant 30-day expected volatility of the U.S. stock market, derived from real-time, mid-quote prices of S&P 500® Index (SPX) call and put options.
The VIX had drifted below its long-term average of around 20, but as you can see in the chart, it’s printed a lower high.
As the VIX remains elevated and in an uptrend as defined as higher lows and higher highs, it suggests the market expects stock prices to be more volatile.
In Following the Trend of Inflation and Risk of Bonds I mentioned we are closely monitoring the 10-2 Year Treasury Yield Spread because an inverted yield curve has a track record of predicting future recessions 6 – 24 months in advance.
The 10-2 Year Treasury Yield Spread is declining fast and has now trended to 0.24%, meaning the 2 Year U.S. Treasury Yield is nearly the same yield as the Year 10 U.S. Treasury Yield.
For information about our proactive investment management, active risk management, hedging your risks, and ASYMMETRY® Managed Portfolios, contact us.
Mike Shell is the Founder and Chief Investment Officer of Shell Capital Management, LLC, and the portfolio manager of ASYMMETRY® Managed Portfolios. Mike Shell and Shell Capital Management, LLC is a registered investment advisor focused on asymmetric risk-reward and absolute return strategies and provides investment advice and portfolio management only to clients with a signed and executed investment management agreement. The observations shared on this website are for general information only and should not be construed as advice to buy or sell any security. Securities reflected are not intended to represent any client holdings or any recommendations made by the firm. Any opinions expressed may change as subsequent conditions change. Please do not make any investment decisions based on such information, as it is subject to change. Investing involves risk, including the potential loss of principal an investor must be willing to bear. Past performance is no guarantee of future results. All information and data are deemed reliable but are not guaranteed and should be independently verified. The presence of this website on the Internet shall in no direct or indirect way raise an implication that Shell Capital Management, LLC is offering to sell or soliciting to sell advisory services to residents of any state in which the firm is not registered as an investment advisor. The views and opinions expressed in ASYMMETRY® Observations are those of the authors and do not necessarily reflect a position of Shell Capital Management, LLC. The use of this website is subject to its terms and conditions.
We measure investor sentiment in many ways from indicators that illustrate the result of investor actions from trading such as the Cboe Volatility Index® (VIX®), the first index to measure the market’s expectation of future volatility. Volatility can be measured using actual historical price changes (realized volatility) or it can be a measure of expected future volatility that is implied by option prices. The VIX Index is a measure of expected future volatility as implied by options.
The VIX Index is a calculation designed to produce a measure of constant 30-day expected volatility of the U.S. stock market, derived from real-time, mid-quote prices of S&P 500® Index (SPX℠) call and put options. On a global basis, it is one of the most recognized measures of volatility — widely reported by financial media and closely followed by a variety of market participants as a daily market indicator.
Currently, the VIX has trended around 30, which I consider a volatility expansion. As you can see in the chart, the long-term average is around 20, so levels above average are periods expected to see a wider range of prices as prices, and more indecision.
When the VIX is elevated, it suggests the market is paying more for the protection of options, so many consider the VIX a “fear gauge.”
The good news is stock market returns have historically been higher after VIX trends above 30. Because it’s a sentiment indicator, the market eventually gets so bearish investors who desire to sell have already sold, and those who want to hedge (with options) have hedged.
Today’s VIX at 30 is far from an extreme spike we’ve seen before, but still elevated.
We’re going to venture far beyond the VIX today.
The VIX is one of 7 indicators included in the CNN Fear & Greed Index we have been monitoring for years. The Fear & Greed Index isn’t designed for market timing per se, but it can be a useful reminder of your own sentiment. At the extremes, you may consider feeling more contrarian and following the most famous contrarians mantra:
“Be fearful when others are greedy, and greedy when others are fearful.” – Warren Buffett
Right now, the Fear & Greed Index suggests Extreme Fear is driving the stock market.
Looking inside the Fear & Greed Index the CBOE Volatility Index (VIX) at 30 is part of the weight of the evidence used to drive the gauge. It uses a moving average applied to the VIX level and as of yesterday, it has changed from “Extreme Fear” to Neutral as implied volatility declined.
Another option-related indicator included is the CBOE 5-day average Put/Call Ratio. It now says, “during the last five trading days, volume in put options has lagged volume in call options by 65.73% as investors make bullish bets in their portfolios. This is a lower level of put buying than has been the norm during the last two years and is a neutral indication.”
Put options are used mostly to hedge portfolios against price declines. When investors hedge more, it’s a signal they are bearish, and when they hedge less, it’s assumed by and large they are less bearish.
Below is the trend of the Fear & Greed over time. As you can see, it’s down to the Extreme Fear level, which proceeds a low in the stock market, and eventually a new uptrend.
Once investors who want to sell have sold, we eventually see prices trend down to a low enough level it attracts buying demand.
To get an indication of when this may be near, we look at a wide range of investor/trader sentiment indicators, but also the price chart itself for clues.
I like to use the Fear & Greed Index here because it’s publically and freely available so anyone can observe and follow it, but there are many more we monitor that isn’t.
Advisor Sentiment from Investors Intelligenceis one of my favorite investor sentiment indicators.
As you can see in the chart, bearish investment advisors now outnumber the bulls. The bull-bear spread narrowed to -4.6% and the first negative level since early April 2020. This is an extreme reading of bearishness, and historically precedes a reversal of a downtrend as it suggests those who have sold have sold, leaving buying demand in the dominant position.
According to Investors Intelligence, this extreme reading signals a lower risk level than before for tactical trading opportunities.
However, the caveat is it could absolutely get much worse because every eventual -50% decline in the stock market necessarily involves such extreme fear to drive prices lower. So, it’s essential to understand contrarian indicators are a windsock, but no indicator is flawless.
Sentiment indicators could remain extremely bearish for months in a long-lasting waterfall decline.
It’s essential to realize bearish sentiment necessarily proceeds large declines in the stock market, but eventually, the extreme pessimism signals the desire to sell may have faded enough for the demand to buy to become dominant.
When a market is falling, the prices trends are eventually driven down to a low enough point to attract new buying demand, and the trend reverses.
Indicators can be helpful to gauge sentiment and behavior, but nothing drives sentiment like a change it the price trend.
The price trend is the final arbiter.
“The trend is your friend until the end when it bends.” – Ed Seykota
Aguing with the trend is like arguing with a guard rail on a motorcycle. You can test it and try it, but it’s probably going to be a bad outcome.
A simple interpretation of the price trend of the stock market using the S&P 500 Index as a proxy is what was a low volatility primary uptrend has changed to a downtrend as defined by its lower highs, and lower lows.
Below we see my line in the sand, which shows the index is at a level it’s seen several times before.
For now, the stock market is attempting an uptrend.
If the S&P 500 declines below 4200 I’ll consider it a continuation of the downtrend.
The moving average of the price is a common technical indicator used for trend following. The 50 day and 200 day are the most popular. As you can see, the S&P 500 is also defined as a downtrend using these trend following indicators.
The SPX is down about -9% from its high, and was down as much as -12% as of last week. That’s far from a major decline, but enough to help drive a lot of fear of a further loss of value.
The bottom line is investor and advisor sentiment has reached an extreme level of pessimism that could proceed at least a short-term retracement of the stock market decline.
“Over the weekend, as his military laid siege to Ukraine for the fourth day, President Vladimir Putin ordered Russia’s nuclear forces into a higher state of alert, the first time the Kremlin has done so since the Russian Federation was established in 1991.”
And then there are actions from The Federal Open Market Committee (FOMC) of the Federal Reserve. Few things drive prices and sentiment more than changing interest rates.
Next up, I’ll take a look at what the stocks inside the index is doing to gauge how far they’ve trended and how far they may go.
Let’s see how it all plays out, but right now, we’re seeing early evidence of a possible capitulation, at least in the short term, barring no unknown, unknown, or nuclear attack.
In the meantime, I’m taking advance of some asymmetric risk-reward opportunities in our tactical trading.
For information about our proactive investment management, active risk management, hedging your risks, and ASYMMETRY® Managed Portfolios, contact us.
Mike Shell is the Founder and Chief Investment Officer of Shell Capital Management, LLC, and the portfolio manager of ASYMMETRY® Managed Portfolios. Mike Shell and Shell Capital Management, LLC is a registered investment advisor focused on asymmetric risk-reward and absolute return strategies and provides investment advice and portfolio management only to clients with a signed and executed investment management agreement. The observations shared on this website are for general information only and should not be construed as advice to buy or sell any security. Securities reflected are not intended to represent any client holdings or any recommendations made by the firm. Any opinions expressed may change as subsequent conditions change. Please do not make any investment decisions based on such information, as it is subject to change. Investing involves risk, including the potential loss of principal an investor must be willing to bear. Past performance is no guarantee of future results. All information and data are deemed reliable but are not guaranteed and should be independently verified. The presence of this website on the Internet shall in no direct or indirect way raise an implication that Shell Capital Management, LLC is offering to sell or soliciting to sell advisory services to residents of any state in which the firm is not registered as an investment advisor. The views and opinions expressed in ASYMMETRY® Observations are those of the authors and do not necessarily reflect a position of Shell Capital Management, LLC. The use of this website is subject to its terms and conditions.
In How We’ll Know if a Recession is Imminent I said if the 10-2 Year Treasury Yield Spread crosses below zero, and the yield curve becomes inverted, that’s what will signal a recession is probably imminent, but a recession may not be identified until 6 – 24 months later.
We can’t wait until a recession is called to manage our investment risks; the stock market has historically been the leading indicator, declining well in advance.
After U. S. inflation was reported today that inflation accelerated last month to a 7.5% annual rate to a 40-year high, U.S. Treasury Yields trended up to 2%.
Since the 10-2 Year Treasury Yield Spread is the difference between the 2 year U. S. Treasury and the 10 year U. S. Treasury, the spread will tighten as the shorter-term interest rate converges with the longer-term rate.
Recently both yields have been increasing, but the 10-2 Year Treasury Yield Spread is still falling.
The U.S. inflation momentum is driven by rising price trends for autos, household furniture, appliances, as well as for other long-lasting goods we buy.
For example, here is the U. S. Consumer Price Index for used cars and trucks.
It is well known certain consumer prices have been trending up since the pandemic, so the question for the second-level thinker is whether or not these rising inflation trends are already reflected in the prices of stocks and bonds.
So far this year, 2022 has started off with stock markets trending down.
For example, the S&P 500 declined nearly -10% in the few weeks before retracing about half the loss over the past two weeks.
Longer downtrends often retrace about half of their decline before turning down again, so we’ll soon see if this is the early stage of a deeper decline for stocks or a continuation of the primary uptrend.
The Nasdaq 100, which is weighted heavier in large-cap growth stocks and the technology sector, has reacted to more selling pressure down -14% before retracing some of the decline.
Emerging country stocks as measured by the MSCI Emerging Markets Index have finally shown some relative strength against U. S. stocks.
The MSCI Emerging Markets Index trended up at first, then only declined about -3%, and is now positive YTD.
Rising interest rates have a direct negative impact on bond prices, and that is especially true for longer-term bonds.
If you buy and hold bonds, you’re going to learn the risks of bonds and bond funds in a rising rate regime.
Many investors today haven’t invested long enough to have experienced the possible losses that can be driven by this kind of rising inflation, rising interest rates, regime.
Investing involves risks you must be willing to bear, and if you aren’t willing and able to take the risk, you may consider reducing or hedging your risks.
For information about our proactive investment management, active risk management, hedging your risks, and ASYMMETRY® Managed Portfolios, contact us.
Mike Shell is the Founder and Chief Investment Officer of Shell Capital Management, LLC, and the portfolio manager of ASYMMETRY® Managed Portfolios. Mike Shell and Shell Capital Management, LLC is a registered investment advisor focused on asymmetric risk-reward and absolute return strategies and provides investment advice and portfolio management only to clients with a signed and executed investment management agreement. The observations shared on this website are for general information only and should not be construed as advice to buy or sell any security. Securities reflected are not intended to represent any client holdings or any recommendations made by the firm. Any opinions expressed may change as subsequent conditions change. Please do not make any investment decisions based on such information, as it is subject to change. Investing involves risk, including the potential loss of principal an investor must be willing to bear. Past performance is no guarantee of future results. All information and data are deemed reliable but are not guaranteed and should be independently verified. The presence of this website on the Internet shall in no direct or indirect way raise an implication that Shell Capital Management, LLC is offering to sell or soliciting to sell advisory services to residents of any state in which the firm is not registered as an investment advisor. The views and opinions expressed in ASYMMETRY® Observations are those of the authors and do not necessarily reflect a position of Shell Capital Management, LLC. The use of this website is subject to its terms and conditions.
I focus most of my attention on my own positions or those on my lists for portfolio management.
Nothing is more telling than what the stocks on my lists that meet certain fundamental earnings growth and technical criteria are doing.
Nothing is more important than the trend, momentum, and volatility of our actual positions.
However, it doesn’t mean we don’t also observe all the other stocks, bonds, commodities, and currencies for signs of strength or weakness.
Even though it may not impact my exposures or drive any change in our positions, I still enjoy taking the time to see what “the market” is doing, overall, in the big picture. That’s what I mostly share here, for informational purposes only.
Below is a chart of the percent of U. S. stocks trending about the 50-day moving average, an intermediate-term trend signal.
Percent of U.S. Stocks Trending Above the 50 Day Moving Average
A few observations of asymmetry are:
Only 30% of stocks are trending above the 50 day moving average.
As we can see in the charge giong back 20 years, its at the low end of its historical range.
In signficant stock market declines, it gets much worse. For example, in March 2020, more than 90% of stocks were in downtrends, the worst in two decades, including 2008.
About 8 times this Market Breadth indicator stopped at this level before trending back up, as stocks trended back up.
About 13 times this Market Breadth indicator didn’t stop here at this level, but instead kept trending loweer as stocks trended lower.
Overall, my observation from this asymmetry (imbalance) is many stocks have already entered downtrends.
Overall, stock market participation started showing weakness after the May 2020 advance, then improved into late 2010 before reaching a peak, and it’s been trending down since.
We may start to hear some call it a “Stealth Bear Market,” a phrase used to describe stock market conditions when the overall indexes are by and large trending higher, but many stocks are trending lower.
A “Stealth Bear Market” may define a trend like this because the S&P 500 stock index has been trending up, as the percent of stocks participating in the uptrend has declined.
Regardless of what we call it, the bottom line is most stocks are already in downtrends, so we’ve been stalking to see when they start trending back up again.
I think it’s essential to actively manage risk and adapt to changing market trends. If you need help, contact us. We manage accounts titled in your own name at an independent custodian of Goldman Sachs.
Mike Shell is the Founder and Chief Investment Officer of Shell Capital Management, LLC, and the portfolio manager of ASYMMETRY® Global Tactical. Mike Shell and Shell Capital Management, LLC is a registered investment advisor focused on asymmetric risk-reward and absolute return strategies and provides investment advice and portfolio management only to clients with a signed and executed investment management agreement. The observations shared on this website are for general information only and should not be construed as advice to buy or sell any security. Securities reflected are not intended to represent any client holdings or any recommendations made by the firm. Any opinions expressed may change as subsequent conditions change. Do not make any investment decisions based on such information, as it is subject to change. Investing involves risk, including the potential loss of principal an investor must be willing to bear. Past performance is no guarantee of future results. All information and data are deemed reliable but are not guaranteed and should be independently verified. The presence of this website on the Internet shall in no direct or indirect way raise an implication that Shell Capital Management, LLC is offering to sell or soliciting to sell advisory services to residents of any state in which the firm is not registered as an investment advisor. The views and opinions expressed in ASYMMETRY® Observations are those of the authors and do not necessarily reflect a position of Shell Capital Management, LLC. The use of this website is subject to its terms and conditions.
And time is different, too, because of rising inflation and interest rates, which means falling bond prices.
So bonds aren’t going to be a crutch in a falling stock market.
Why do I think it’s a bubble?
A picture is worth 1,000 words.
S&P 500 Shiller CAPE Ratio was created by Yale University economist Robert Shiller as a way to understand long-term stock market valuations.
The S&P 500 Shiller CAPE Ratio, also known as the Cyclically Adjusted Price-Earnings ratio, is calculated as the ratio of the S&P 500’s current level divided by the 10-year moving average of inflation-adjusted earnings.
The S&P 500 Shiller CAPE Ratio may be used as a valuation method to forecast future expected returns.
– Higher CAPE ratio could indicate lower returns over the next couple of decades, – Lower CAPE ratio could reflect higher returns over the next couple of decades, as the ratio reverts back to the mean.
S&P 500 Shiller CAPE Ratio is at a current level of 39.60, and as you can see in the chart, it suggests the stock market is the second most expensive since 1881, the last 140 years. It’s more than 200% higher than its long-term average, and far from the low levels that historically preceded long-term bull markets.
The current risk for investors is it plays out similar to the past but without bonds trending up, acting as a crutch to hedge some of the stock market losses.
There’s never been a more critical time to row, not sail, so we’ve got out the oars.
It’s an exciting time to be an investment advisor and portfolio manager. We are empowered with a broader, more robust suite of tools to define and manage risk than at any other time in history.
Is this the beginning of a bear market?
Maybe, we’ll see, only time will tell.
Even if it is the early stage of a bear market, it’ll likely unfold with many swings up and down along the way.
But I think we’ll see all the speculation unwind in the years ahead.
For the tactical trader, investment success isn’t so much what the market is doing to you, but what you are doing with the market.
Mike Shell is the Founder and Chief Investment Officer of Shell Capital Management, LLC, and the portfolio manager of ASYMMETRY® Managed Portfolios. Mike Shell and Shell Capital Management, LLC is a registered investment advisor focused on asymmetric risk-reward and absolute return strategies and provides investment advice and portfolio management only to clients with a signed and executed investment management agreement. The observations shared on this website are for general information only and should not be construed as advice to buy or sell any security. Securities reflected are not intended to represent any client holdings or any recommendations made by the firm. Any opinions expressed may change as subsequent conditions change. Do not make any investment decisions based on such information, as it is subject to change. Investing involves risk, including the potential loss of principal an investor must be willing to bear. Past performance is no guarantee of future results. All information and data are deemed reliable but are not guaranteed and should be independently verified. The presence of this website on the Internet shall in no direct or indirect way raise an implication that Shell Capital Management, LLC is offering to sell or soliciting to sell advisory services to residents of any state in which the firm is not registered as an investment advisor. The views and opinions expressed in ASYMMETRY® Observations are those of the authors and do not necessarily reflect a position of Shell Capital Management, LLC. The use of this website is subject to its terms and conditions.
“Purpose is a more powerful motivator than money. When you are not paid as much as you would like, your purpose will provide you a reason to continue producing excellence in your work. When you have more money than you ever thought possible, your purpose will provide you with a reason to continue producing excellence in your work.” – William J. O’Neil
“The market has a simple way of whittling all excessive pride and overblown egos down to size. After all, the whole idea is to be completely objective and recognize what the marketplace is telling you, rather than try to prove that the thing you said or did yesterday or six weeks ago was right. The fastest way to take a bath in the stock market or go broke is to try to prove that you are right and the market is wrong.”
The S&P 500 Equal Weight Index is like the S&P 500, except the 500 stocks are equally weighted instead of market cap weighted. For example, the stock exposure of the S&P 500 everyone quotes is based on market capitalization of the stocks, so the largest stocks are weighed heavier than smaller stocks.
Below are the top 10 holdings of the S&P 500 and their weightings. The top 10 out of about 500 holdings is 28% of the index.
All of the 500 holdings of the S&P 500 Equal Weight Index are allocated at 0.25% no matter how large or small the company.
Said another way, the Equal Weight Index gives much more exposure to smaller stocks.
Up until now, the S&P 500 was trending with greater momentum than the Equal Weight Index.
As of today, the S&P 500 Equal Weight has finally trended above its prior high and breaking out of a base going back to May.
It’s a positive sign for stocks.
One of the bearish signs we’ve seen lately has been poor breadth of participation as measured by the percent of stocks above their 50 day moving average.
The S&P 500 Percent of Stocks Above 50 Day Moving Average is an indicator showing the percentage of stocks in the S&P 500 that closed at a higher price than the 50-day simple moving average.
We’ve heard a lot of concern on Wall Street about the divergence between the S&P 500 and the percent of the stocks in the index above their 50-day average price. The red arrow shows the falling breadth indicator S&P 500 Percent of Stocks Above 50 Day Moving Average signaling only about 54% of the stock are in a short term uptrend.
Such divergence is normally considered bearish, but not so this time.
Those who are concerned about this bearish divergence may consider instead comparing the percent of stocks above the 50 day to the Equal Weight Index because the S&P 500 Percent of Stocks Above 50 Day Moving Average itself is equally weighted, not cap-weighted. It’s a percentage and cares nothing about the size of the company.
With that in mind, here is the S&P 500 Equal Weight Index giving each stock the same 0.25% weighting compared to the S&P 500 Percent of Stocks Above 50 Day Moving Average, which gives each stock the same weight.
What I see here is the S&P 500 Equal Weight price trend peaked in early May, but it was preceded by a divergence in the S&P 500 Percent of Stocks Above 50 Day Moving Average. That is, the S&P 500 Percent of Stocks Above 50 Day Moving Average started trending down in April as the index was making new highs for a few more weeks. It signaled some of the stocks had peaked and started trending down, and then the whole index finally paused and has trended sideways for two months, until today.
I’m not real bullish right now about the stock market, and we had reduced our exposure significantly, but this is a positive sign. I’ll be watching for more stocks to trend up showing increasing participation so if this continues the wind will be in the markets sails again.
Mike Shell is the Founder and Chief Investment Officer of Shell Capital Management, LLC, and the portfolio manager of ASYMMETRY® Global Tactical. Mike Shell and Shell Capital Management, LLC is a registered investment advisor focused on asymmetric risk-reward and absolute return strategies and provides investment advice and portfolio management only to clients with a signed and executed investment management agreement. The observations shared on this website are for general information only and should not be construed as advice to buy or sell any security. Securities reflected are not intended to represent any client holdings or any recommendations made by the firm. Any opinions expressed may change as subsequent conditions change. Do not make any investment decisions based on such information as it is subject to change. Investing involves risk, including the potential loss of principal an investor must be willing to bear. Past performance is no guarantee of future results. All information and data are deemed reliable but is not guaranteed and should be independently verified. The presence of this website on the Internet shall in no direct or indirect way raise an implication that Shell Capital Management, LLC is offering to sell or soliciting to sell advisory services to residents of any state in which the firm is not registered as an investment advisor. The views and opinions expressed in ASYMMETRY® Observations are those of the authors and do not necessarily reflect a position of Shell Capital Management, LLC. The use of this website is subject to its terms and conditions.
“So understand that chart reading and technical analysis is not some arcane science. It’s not black magic or astrology. Very simply, it is learning to read the cardiograms of the market’s health. Your physician runs X rays, blood tests, and EKGs on you before making a diagnosis. The competent technical analyst does the same to the market. Neither one is a witch doctor, though I have some reservations about certain MDs I’ve known.”
Stan Weinstein’s Secrets For Profiting in Bull and Bear Markets – January 1, 1988
I’ve been busy making improvements to my systems the past several months, so I haven’t shared any of my market observations with the public.
Although we’ve certainly had many requests for it, I’ve waited until I notice a material change in the risk level.
I think we are now entering a materially higher risk level.
First, I’ve gotten a call from two different friends, two days in a row, who have no investment management experience, and both were asking my opinion about investing in speculative stocks.
Ruh-roh.
Talking with other hedge fund managers lately, I’ve mentioned the investor sentiment reminds me of 1999. Back in the late 90s everyone was a stock market genius, and that seems to be the belief again as price trend up confirming their expertise.
We know how that played out, and it will again.
Those who don’t believe it have a lesson to learn, and they will.
I prefer to follow the trend until the end when it bends, but sometimes trends, which are driven by an under-reaction that takes time to catch up can eventually result in an overreaction and an extreme. This uptrend hasn’t yet reached a major extreme by some measures, but it’s getting there enough to be a warning of a higher risk level.
As of now, the percent of S&P 500 stocks trending above their average price of the past 50 days has reached about 90%, so most of the stocks are already in an intermediate term uptrend. Broad participation in an uptrend is a positive sign, but once most of the stocks are already trending up, I start to wonder when the trend will pause and reverse. This breadth indicator signals investor sentiment at the extremes, and it’s reached the point we should be prepared for an interruption of this uptrend. Of course, the market can remain irrational longer than you can remain solvent, so this doesn’t require a reversal, it’s a warning shot across the bow.
Next up is the percent of S&P 500 stocks above the 200 day moving average, which is a longer term uptrend signal. Here we highlight it reaching its highest level in over a year at 95% of the stocks in a long term uptrend. Again, it’s a positive sign that all but 5% of these stocks are in an uptrend, but once they’ve mostly trended up like this, it’s prone to be the end of the cycle.
Anyone who has been following along with my observations the past two decades know I love me some volatility trading, so my systems monitor for volatility expansions and contractions. What we have here is, a volatility contraction seen in the CBOE Volatility Index (VIX) fading down to the 17 handle range.
After prices have trended up for a while, I’ve observed the price trends tighten up as investors become more and more confident the trend will continue. Once something happens to cause a reaction, we’ll see prices spread out, which is volatility, and specially, a volatility expansion. The 17 range is far from an extreme low in the expected volatility over the next 30 days, which is what VIX indicates based on options prices, but as seen in the charge above, it’s trended to a new low.
Volatility contractions are eventually followed by volatility expansions. As soon as something surprises the market, we’ll probably see indecision, which leads to prices spreading out as investors and traders try to figure out what’s going to happen next.
Looking at a longer time frame of the past decade, here we see volatility can contract down to the 12% range, so an overall tightening of the range of prices can always continue longer than expected.
Next up is the fundamental valuation of the stock index. I’m not a fundamental analyst, despite my advanced accounting degree. I learned the hard way a long time ago a stock price can trend far away from anyones perception of fundamental value.
If you’re an analyst at Goldman Sachs researching a company to see if they can pay for the loan the investment bank is considering giving them, you want to discover the potential to pay, and it’s a fundamental analysis to make an educated guess. When that company has stock trading on an exchange, it’s an auction market determined by supply and demand, which is driven by sentiment as much as anything. Many momentum stocks like Tesla are bid up based on enthusiasm for what may eventually be, not what is today.
With that said, I do believe the fundamental valuation level does have some predictive ability in the long run. When the S&P 500 Shiller CAPE Ratio is at its second highest level in 139 years, it suggest to me the corrections may be deeper in magnitude and quicker to unfold. We’ve seen that these past several years, and I expect to see it more.
Because stocks are generally expensive based on the price to earnings ratio, it suggests we row, not sail.
If you wait for the wind to keep blowing, you may find yourself in the middle of the ocean running out of resources to stay afloat.
I prefer to get out the oars and start rowing to get where we want to be.
Speaking of the price to earnings ratio of S&P 500 stocks, here is another interesting observation. The S&P PE Indicator shows the average P/E Ratio for stocks in the S&P 500. It’s essentially a fundamental breadth indicator, similar to the percent of SPX stocks above their moving averages, which is price based breadth. This indicator is calculated by dividing the closing value of the S&P 500 by the trailing twelve months (TTM) of GAAP earnings for SPX, and multiplying the result by 100.
As you can see in the chart, it’s in uncharted territory of the past decade.
Of course, a high price to earnings ratio may be more justified as long as inflation is low, as it is now. If inflation begins to trend up, it’ll likely put longer term pressure on these price trends.
For these reason and more, I think it’s a good time to reduce exposure to the possibility of loss and/or hedge off downside risk.
I hope this helps!
Mike Shell is the Founder and Chief Investment Officer of Shell Capital Management, LLC, and the portfolio manager of ASYMMETRY® Global Tactical. Mike Shell and Shell Capital Management, LLC is a registered investment advisor focused on asymmetric risk-reward and absolute return strategies and provides investment advice and portfolio management only to clients with a signed and executed investment management agreement. The observations shared on this website are for general information only and should not be construed as advice to buy or sell any security. Securities reflected are not intended to represent any client holdings or any recommendations made by the firm. Any opinions expressed may change as subsequent conditions change. Do not make any investment decisions based on such information as it is subject to change. Investing involves risk, including the potential loss of principal an investor must be willing to bear. Past performance is no guarantee of future results. All information and data are deemed reliable but is not guaranteed and should be independently verified. The presence of this website on the Internet shall in no direct or indirect way raise an implication that Shell Capital Management, LLC is offering to sell or soliciting to sell advisory services to residents of any state in which the firm is not registered as an investment advisor. The views and opinions expressed in ASYMMETRY® Observations are those of the authors and do not necessarily reflect a position of Shell Capital Management, LLC. The use of this website is subject to its terms and conditions.
Mike Shell is the Founder and Chief Investment Officer of Shell Capital Management, LLC, and the portfolio manager of ASYMMETRY® Global Tactical. Mike Shell and Shell Capital Management, LLC is a registered investment advisor focused on asymmetric risk-reward and absolute return strategies and provides investment advice and portfolio management only to clients with a signed and executed investment management agreement. The observations shared on this website are for general information only and should not be construed as advice to buy or sell any security. Securities reflected are not intended to represent any client holdings or any recommendations made by the firm. Any opinions expressed may change as subsequent conditions change. Do not make any investment decisions based on such information as it is subject to change. Investing involves risk, including the potential loss of principal an investor must be willing to bear. Past performance is no guarantee of future results. All information and data are deemed reliable but is not guaranteed and should be independently verified. The presence of this website on the Internet shall in no direct or indirect way raise an implication that Shell Capital Management, LLC is offering to sell or soliciting to sell advisory services to residents of any state in which the firm is not registered as an investment advisor. The views and opinions expressed in ASYMMETRY® Observations are those of the authors and do not necessarily reflect a position of Shell Capital Management, LLC. The use of this website is subject to its terms and conditions.
“The trend is your friend, until the end when it bends.”
Stock indexes making higher highs and higher lows is a good thing – until it isn’t.
I run a combination of systems. Most of them are trend following in nature, meaning the objective is to enter a trend early in its stage to capitalize on it until it changes.
But when trends reach an extreme it’s time to take note.
For me, what follows is what I consider market analysis, which doesn’t necessarily result in an specific trades, per se, but instead, it’s my intellectual exercise to understand what’s going on. And it’s nice to have an idea of when a trend may be ready to change.
In law,weight of evidence “refers to the measure of credible proof on one side of a dispute as compared with the credible proof on the other.
It is the probative evidence considered by a judge or jury during a trial.
In this case, the jury are active investors in the market.
Probative evidence is having the effect of proof, tending to prove, or actually proving. So, when a legal controversy goes to trial, the parties seek to prove their cases by the introduction of evidence. If so, the evidence is deemed probative.
Probativeevidence establishes or contributes to proof.
The weight of evidence, then, is based on the believability or persuasiveness of evidence.
Since we never know the future in advance, when we engage in market analysis, we necessarily have to apply the weight of the evidence to establish the probability.
After monitoring price trends and a range of indicators intended to measure the strength of a trend for more than two decades, I’ve got a feel for the weight of the evidence. So, my confidence in these observations has increased over time, even as imperfect as it is.
Let’s see some evidence to weight.
By the first of June, 98% of the S&P 500 stocks were trending up, above their short term trend 50 day moving average. Since then, we’ve seen some divergence between the stocks in an uptrend and the stock index.
It tells us fewer stocks are participating in the uptrend.
The advantage of monitoring breadth measures like % of stocks above a moving average or bullish percent is it’s a high level barometer that may highlight what is changing. Sometimes, it’s what is diverging.
In this case, the price trend of the stock index is diverging with the percent of stocks in a positive trend.
One of the warning signs in January and February was this same divergence between the uptrend in $SPY and the breadth of participation of the individual stocks in the index.
When I see divergence, it reminds me to look inside to see what has changed.
It’s usually explained by sector rotation.
For example, over the past month, Technology and Communications have shown relative strength, but the momentum in Consumer Discretionary and Utilities are the laggards.
As a new trend gets underway, some of the component sectors within the S&P 500 diverge, so we also see it show up in the percent of stocks trending up vs. down.
After watching quantitive technical indicators like this since the 90s, I can also tell you we commonly see a breadth thrust in the early stages of a new uptrend. We did in January to February 2019 after the waterfall decline at the end of 2018.
A breadth thrust is bullish confirmation.
How long the trend may last, well, we’ve always preferred to see more stocks parts-cation in an uptrend than less. The theory is a broad uptrend that lifts all boats has more true momentum. An example of elevated breadth was 2017, when the stock index trended up with very little volatility or setbacks.
But if you look real close, that yellow highlight of 2017 also shows the percent of stocks above their 50 day moving average oscillated between the 50 and 95% zone throughout the year. It’s an oscillator, so it swings between 0% and 100%, but the fact it stayed above 50% in 2017 was a signal of internal strength. It often swings wider in a typical year, but 2017 was far from typical.
The bottom line is, what we have here, now, is fewer of the S&P 500 stocks trending up, which means more are crossing down below their intermediate trend trend line.
So, my interpretation is the trends are weakening, and it’s likely to be more reflected in the stock index eventually.
Investor sentiment is another essential measure.
Nothing drives investor sentiment like a price trend. As prices trend up, people get more bullish (or greedy) and as prices trend down, they feel more fear (of losing more money.)
The Fear & Greed Index tracks seven indicators of investor sentiment. It’s gradually dialing back up to Greed, but not yet Extreme Greed.
But when we take a look inside, and understand how it works, I see the main holdout is VIX . At around 22, the VIX still indicates a moderate level of FEAR, but we have to consider VIX is fading from its highest level, ever, so its absolute level may not be as indicative.
On the other hand, the level of the Put/Call Ratio is among the lowest levels of put buying seen during the last two years, indicating EXTREME GREED on the part of investors.
Junk Bond Demand has reached EXTREME GREED. Investors in junk bonds are accepting 2.05% in additional yield over safer investment grade bonds. This spread is much lower than what has been typical during the last two years and indicates that investors are pursuing higher risk strategies.
The 3rd EXTREME GREED indicator is the S&P 500 is 15.28% above its 125-day average. This is further above the average than has been typical during the last two years and rapid increases like this often indicate extreme greed, according to the Fear & Greed Indicator.
Aside from neutral $VIX, some other moderate hold outs of the 7 indicators include breadth. The Fear & Greed Indicator uses the McClellan Volume Summation Index, which measures advancing and declining volume on the NYSE. It has fallen from EXTREME GREED just over a week ago.
Stock Price Strength is another moderate GREED level. It says the number of stocks hitting 52-week highs exceeds the number hitting lows and is at the upper end of its range, indicating greed.
Safe Haven Demand is at a bullish investor sentiment level. Stocks have outperformed bonds by 6.87% during the last 20 trading days, close to the strongest performance for stocks/bonds in the past 2 years – investors are rotating into stocks from the relative safety of bonds.
THE BOTTOM LINE IS: The seven indications of investor sentiment are dialing up to a very optimistic level, signaling investors are bullish on stocks.
Though some of it isn’t yet extreme, when we put it in context, anything can happen from here, but its now at a higher risk zone.
Another measure of investor sentiment is put volume. Puts are listed options on stocks and indexes that may be used to hedge the downside. The CBOE Total Put Volume is at the lowest level this year, which suggests there isn’t a lot of hedging taking place.
The NAAIM Exposure Index represents the average exposure to US Equity markets reported by the members of the National Association of Active Investment Managers. They are fully invested for the first time since December. Their exposure to the stock market has followed the trend of the stock index.
Another sentiment poll is the Advisors Sentiment, which was devised by Abe Cohen of Chartcraft in 1963 and is still operated by Chartcraft, now under their brand name of Investors Intelligence. This survey has been widely adopted by the investment community as a contrarian indicator. They say since its inception in 1963, the indicator has a consistent record for predicting the major market turning points. It has reached that point.
Speaking of Abe Cohen, another indicator he developed in the mid 1950s is the Bullish Percent Index. He originally applied it to stocks listed on the NYSE, but we have been doing the same for other listed stocks and sectors since. The NYSE Bullish Percent is an example of another gauge of overall market risk. A common analogy applied to the NYSE Bullish Percent is that of a football game: level of the bullish % represents the current field position and the “end-zones” are above 70% and below 30%.
Currently, at 70%, it has entered the higher risk zone, suggesting it’s time to put the defensive team on the field.
Many of these indicators are measuring the same thing; investor sentiment.
After everyone has already gotten bullish and put their money to work in stocks, we have to wonder where future demand for shares will come from.
It’s been a nice run, but stars are aligning to look more and more bearish in my opinion. Uptrends are great, but all good things eventually come to an end.
If we want to protect our profits, it is probably time to reduce expose or hedge.
And that’s likely right about the time most people are excited about their stocks and wanting to buy more.
What could go wrong?
As of this writing, we have a CAT 4 hurricane just hours from hitting Texas and Louisiana, the Fed meeting tomorrow, and China firing missiles into disputed sea.
That’s the weight of the evidence as I see it.
You can be the judge if the evidence is believable and persuasiveness enough, but the final arbiter will be the price trend in the coming weeks.
Mike Shell is the Founder and Chief Investment Officer of Shell Capital Management, LLC, and the portfolio manager of ASYMMETRY® Global Tactical. Mike Shell and Shell Capital Management, LLC is a registered investment advisor focused on asymmetric risk-reward and absolute return strategies and provides investment advice and portfolio management only to clients with a signed and executed investment management agreement. The observations shared on this website are for general information only and should not be construed as advice to buy or sell any security. Securities reflected are not intended to represent any client holdings or any recommendations made by the firm. Any opinions expressed may change as subsequent conditions change. Do not make any investment decisions based on such information as it is subject to change. Investing involves risk, including the potential loss of principal an investor must be willing to bear. Past performance is no guarantee of future results. All information and data are deemed reliable but is not guaranteed and should be independently verified. The presence of this website on the Internet shall in no direct or indirect way raise an implication that Shell Capital Management, LLC is offering to sell or soliciting to sell advisory services to residents of any state in which the firm is not registered as an investment advisor. The views and opinions expressed in ASYMMETRY® Observations are those of the authors and do not necessarily reflect a position of Shell Capital Management, LLC. The use of this website is subject to its terms and conditions.
I pay more attention to macroeconomic trends when we are in a recession.
Though my tactical investment decisions are driven by the direction of price trends, momentum, sentiment, and volatility, it’s useful to take a moment to see what in the world is going on.
Clearly, employment and payrolls seem to be one of the main macroeconomic risks right now.
The July ADP employment report showed private employment increased by 167,000, far less than the expectations of the street of 1.2 million. It’s a big disappointment.
Today, we see the US Continuing Claims for Unemployment Insurance is at a current level of 16.11 million, down from 16.95 million last week, which is a change of -4.98% from last week and -35% from the peak in May.
For a long term perspective, here is US Continuing Claims for Unemployment Insurance going back to 1967, the past 53 years. It averaged 2.8 million over the period, reached 10 times higher than average, and is still 5 times higher than the long term average.
Of course, the average over 53 years doesn’t mean much when such an outlier is present, but maybe it helps put the trend into perspective.
Prior to now, the highest continuing claims for unemployment insurance from the Department of Labor was 6.6 million. That’s 10 million less than now. So, for perspective, todays level is nearly three times what it was at the peak in 2009. Said another way, the worst claims for unemployment insurance in 2009 was only 1/3 of today.
But hey, today’s 16.1 million is better than the peak at 25 million just a few months ago.
By the way, that 25 million was more than four times the highest level it reached in 2009.
So yeah, employment is an issue that certainly has my attention as a macroeconomic trend guy.
Next up is US Initial Claims for Unemployment Insurance. US Initial Jobless Claims, as tracked and reported by the US Department of Labor, provides data on how many new people have filed for unemployment benefits in the previous week. It allows us to gauge economic conditions in regard to employment.
As more new people file for unemployment benefits, fewer people in the economy have jobs. Of course, initial jobless claims tended to peak at the end of recessionary periods such as the last cycle peak on March 21, 2009 when it reached 661,000 new filings.
US Initial Claims for Unemployment Insurance is at a current level of 1.186 million, which is nearly double the 2009 peak, but it’s -83% below the stunning March 2020 high of 6.8 million.
I know I just shared some of these numbers a few days ago, but these are updated data this morning.
The next big issue I think we’ll see comes tomorrow.
If tomorrows payroll numbers are similar to these ADP numbers, the job growth will be way below Wall Street expectations of 1.5 million.
We’ll see how it unfolds in the morning.
In the meantime, the resiliency of US stock market has been remarkable. Though anyone paying attention knows the driver is the US government intervention, the S&P 500 has now recovered from its -34% loss in March.
The Dow Jones Industrial Average remains about -5% from the February peak.
The equal weight S&P 500, which gives far more weighting to the smaller and mid size stocks, is about -6.4% from its prior high.
To the layman, it would seem the stock market has all but recovered.
If we didn’t know better, the bear market is over.
Do we know better? or is it over?
Will 2020 go down as the sharpest decline in modern history and the fastest recovery?
We’ll see.
But, over the long run, the stock market is driven by fundamentals. The challenge with fundaments like earnings growth, dividend yield, and the price-to-earnings multiple (optimism) they trade at.
Here is a chart of the rate of change of the S&P 500 price trend normalized with the Shiller S&P 500 CAPE Ratio, which is a measure of valuation. I’ve pointed out many times the valuation level was extremely high, though it has been since 2013. Look when it peaked in the relative chart compared to the SPX at the start of 2018.
What’s happened since then?
Swings.
Massive swings.
And sharp sudden drawdowns.
While the S&P 500 Shiller CAPE Ratio is now down to about 30, which is -10% below where it was at the start of 2018, the valuation level is still as high as it was before the Great Depression.
The markets are going to swing up and down and motivate a lot of mistakes along the way, but if history is a guide, we may be in for a much longer bear market and recession than is currently reflected.
You can probably see why my investment strategy is unconstrained, so I can go anywhere, including cash and treasuries, and apply different tactics for tactical decisions in pursuit of asymmetric risk/reward.
It’s never perfect, but I just keep doing what I do.
In hindsight, I’ve been underinvested in stocks the past few weeks, but we’ll see how it plays out from here.
Mike Shell is the Founder and Chief Investment Officer of Shell Capital Management, LLC, and the portfolio manager of ASYMMETRY® Global Tactical. Mike Shell and Shell Capital Management, LLC is a registered investment advisor focused on asymmetric risk-reward and absolute return strategies and provides investment advice and portfolio management only to clients with a signed and executed investment management agreement. The observations shared on this website are for general information only and should not be construed as advice to buy or sell any security. Securities reflected are not intended to represent any client holdings or any recommendations made by the firm. Any opinions expressed may change as subsequent conditions change. Do not make any investment decisions based on such information as it is subject to change. Investing involves risk, including the potential loss of principal an investor must be willing to bear. Past performance is no guarantee of future results. All information and data are deemed reliable but is not guaranteed and should be independently verified. The presence of this website on the Internet shall in no direct or indirect way raise an implication that Shell Capital Management, LLC is offering to sell or soliciting to sell advisory services to residents of any state in which the firm is not registered as an investment advisor. The views and opinions expressed in ASYMMETRY® Observations are those of the authors and do not necessarily reflect a position of Shell Capital Management, LLC. The use of this website is subject to its terms and conditions.
US coronavirus new cases per day are in a downtrend, and trend in US hospitalizations is following the downtrend in new cases.
Taking a closer look, here is the past 30 days.
US cases per day is -31% off its high and US currently hospitalized is down about -5% from its peak.
Sure, the reported data has its fair share if issues, but we are probably observing a large enough sample size of the population to draw meaningful statistical inference.
Of course, nothing is more important than deaths per day, so here is a logarithmic chart. I’m using a logarithmic scale to respond to the skewness of the larger values by normalizing the scale of the trend based on percent change.
The equation for COVID is new tests administered drives new reported cases, which leads to hospitalizations with a lag, and then deaths lag hospitalizations.
Since we are observing a trend change from a peak level, we can expect to see deaths peak in about two weeks.
Of course, the trends of this virus are driven by human behavior.
So, the future direction depends on all of us, and each of us individually.
Mike Shell is the Founder and Chief Investment Officer of Shell Capital Management, LLC, and the portfolio manager of ASYMMETRY® Global Tactical. Mike Shell and Shell Capital Management, LLC is a registered investment advisor focused on asymmetric risk-reward and absolute return strategies and provides investment advice and portfolio management only to clients with a signed and executed investment management agreement. The observations shared on this website are for general information only and should not be construed as advice to buy or sell any security. Securities reflected are not intended to represent any client holdings or any recommendations made by the firm. Any opinions expressed may change as subsequent conditions change. Do not make any investment decisions based on such information as it is subject to change. Investing involves risk, including the potential loss of principal an investor must be willing to bear. Past performance is no guarantee of future results. All information and data are deemed reliable but is not guaranteed and should be independently verified. The presence of this website on the Internet shall in no direct or indirect way raise an implication that Shell Capital Management, LLC is offering to sell or soliciting to sell advisory services to residents of any state in which the firm is not registered as an investment advisor. The views and opinions expressed in ASYMMETRY® Observations are those of the authors and do not necessarily reflect a position of Shell Capital Management, LLC. The use of this website is subject to its terms and conditions.
I’m hearing a lot of talk about the CBOE Equity Put/Call Ratio tapping an extreme low again. At 0.38, the ratio between equity puts and calls has once again reached its lowest level of the past year.
For a broader perspective, here is the CBOE Equity Put/Call Ratio going back to 2006. Indeed, the current ratio between equity puts and calls is as low as it gets. The lowest level was in 2010, when it reached 0.32, barely lower than the current 0.38 reading. Yes, indeed, the CBOE Equity Put/Call Ratio reaching an extremely low level. In fact, it’s as low as it has ever been going back to 2006.
Normally, we consider such a low level to be an example of extreme complacency and GREED DRIVING THE MARKET. For example, the CBOE Equity Put/Call Ratio is the first of seven indicators used in the Fear & Greed Index.
When the ratio is trending down and at a low level, it’s because equity Call option volume is greater than the equity Put option volume. When there’s more trading volume in equity calls, we assume options traders buying speculative calls, so they are bullish. VERY bullish now.
When the market is so one-sidedly bullish, it’s a contrarian indicator suggesting over-enthusiasm. That is, we assume the calls are mostly speculative positions and puts are defensive, so the demand is on the long side. It’s an imperfect assumption, but I generally agree.
I pointed out a similar extreme read out early June, when Call Volume spiked up to a historically high level. Indeed, the stock market had a -6% down day afterward. This time is a little different, and the chart shows why. Call volume isn’t nearly as high, relatively speaking.
Call volume isn’t as high as it was in June, but put volume is also lower. So, the ratio is at the same low level at 0.38, but the absolute volume is different. It’s still probably an indication of enthusiasm and complacency, but it may not have the delta it had last time.
Keep in mind, even though a call option gives the buyer the right, but not the obligation, to buy a stock at a specified price within a specific time period, call volume also includes sellers of call options. So, the dominant demand could be the selling of call options instead of buying them, but every seller needs a buyer, and the prevailing direction of the trend hints as to the dominant side the market is enthusiastic about.
We can say the same about put option volume. While a put option gives the buyer the right, but not the obligation, to sell a stock at a specified price within a specific time period, put volume also includes sellers of call options. Buying a put option is bearish, but selling a put option is bullish.
Still, the general direction of put/call volume is that equity call volume is assumed to be mostly speculative bets on the stock to rise and put volume is primarily speculative (or hedging) bets on the stock to fall.
So, an observation of put and call volume includes a combination of the options market belief the stocks will trend up, but also less desire to protect against stocks going down.
This time, as seen in the chart, the primary difference in the current Put/Call Ratiois a lower level of put volume, requiring less of an uptrend in call volume to drive the ratio up.
I hope this helps!
Don’t miss out. Get an email of new ASYMMETRY® Observations:
Join 525 other subscribers
Mike Shell is the Founder and Chief Investment Officer of Shell Capital Management, LLC, and the portfolio manager of ASYMMETRY® Global Tactical. Mike Shell and Shell Capital Management, LLC is a registered investment advisor focused on asymmetric risk-reward and absolute return strategies and provides investment advice and portfolio management only to clients with a signed and executed investment management agreement. The observations shared on this website are for general information only and should not be construed as advice to buy or sell any security. Securities reflected are not intended to represent any client holdings or any recommendations made by the firm. Any opinions expressed may change as subsequent conditions change. Do not make any investment decisions based on such information as it is subject to change. Investing involves risk, including the potential loss of principal an investor must be willing to bear. Past performance is no guarantee of future results. All information and data are deemed reliable but is not guaranteed and should be independently verified. The presence of this website on the Internet shall in no direct or indirect way raise an implication that Shell Capital Management, LLC is offering to sell or soliciting to sell advisory services to residents of any state in which the firm is not registered as an investment advisor. The views and opinions expressed in ASYMMETRY® Observations are those of the authors and do not necessarily reflect a position of Shell Capital Management, LLC. The use of this website is subject to its terms and conditions.
I’m in Florida, which happens to be one of the states with the highest momentum in COVID – 19 cases. So, I’m going to share my observations as I flip through the data. I’m more of a data scientist, not an epidemiologist, so my focus is purely on the direction of these trends, and their rates of change. There are many limitations or challenges in interpreting the visualization. The data source labeled on the chart is deemed reliable but is not guaranteed, and the case data is limited by test availability.
What you believe is true, for you.
I say that, because we are observing about as much bias from this data as we see every day trading global capital markets.
No matter what I show in my observations, you’ll most likely still believe what you already did.
It’s confirmation bias.
Confirmation bias is the tendency to interpret new evidence as confirmation of one’s existing beliefs or theories.
The Coronavirus has become so politically charged, we see many people judging the trends based on their political affiliation, rather than pure data science.
That’s not the case for me.
My concern is to understand the trends to make a judgment on what is going on.
Let’s see what we see.
First, let’s start with Florida COVID – 19 Cases. The trend is up.
Amazingly, the visual doesn’t change a lot when I switch from an arithmetic chart above to the logarithmic chart below. The log chart below emphasizes the rate of change, rather than the absolute number change. Even the logarithmic chart is trending notably higher, so we not only have an uptrend, but it’s been gaining momentum. That is, the steepness of the recent uptrend is just as steep as it started months ago. We’d like to see it slow down, peak, and then reverse downward.
Florida COVID – 19 Hospitalizations uptrend continues. Again, this is the arithmetic chart, so it shows the absolute change.
Next, I shifted the Florida COVID – 19 Hospitalizations chart to a log scale, to emphasize the rate of change. The rate of change slowed down for a while, but is clearly pointing up.
I pointed out an upside breakout in the trend of new cases on June 12th. Since then, new cases per day have increased from 1,698 per day to 15,300 new cases yesterday in Florida. That is, the cases per day have increased by 708% since the trend breakout 30 days ago. We are now in a new paradigm, so take your precautions accordingly. I’m hoping this is the peak, and we’ll see it turn down from here.
Florida Coronavirus Tests Administered Per Day is also in an uptrend and spiked up. Some of this recent uptrend could be due to data backlogs from the July 4th holiday weekend, but it is what it is.
Deaths per day on Florida due to COVID has generally remained stable, oscillating around average for months. On average, about 43 Floridians per day are dying of Coronavirus. This is an absolute number, but we’ll look at some ratios and rates of change.
Florida COVID-19 Deaths are at 4,346 now. Though the trend is up, everything is relative, and we are talking about 4,346 out of a population of 21.48 million to put it in perspective.
There have been 2.58 million COVID tests reported in Florida, and this is one trend we want to see continue upward. The more testing, the better prepared we are. If you are asymptomatic, you could be spreading the virus to your friends and family, unknowingly.
Now, for some good news.
The Florida COVID – 19 Death Rate is at an all-time low. To calculate the death rate, weuse the formula: Florida Coronavirus Deaths x 100.00 / Florida Coronavirus Cases. At this time, 1.6% of cases in Florida have died from the virus, and the rate has trended down. However, keep in mind deaths lag testing and cases by three to four weeks, so we may see this trend up as new cases become more mature.
Also, note the death rate was higher and increasing early on because the virus got into some assisted living and nursing homes. More recently, the average age of cases has fallen, so fewer younger people have been hospitalized and died from COVID. So, the rate of change has since been slowing.
Next up, we’ll observe some ratios, since everything is relative.
Here, I apply some of the same techniques to these trends I’ve been applying to global markets for over two decades. When looking at ratios in world markets, we call it “relative strength”, as one of the data streams is trending with greater momentum than the other.
Florida COVID cases relative to tests administered shows us about 10.5% of the tests administered are counted as positive tests. Below we see it represented as a ratio between the two. When the trend is rising, as it is now, more cases are positive. I marked the current level since it’s notably back at its prior high. Last month, only about 5% of tests were positive cases.
The next chart is drawn with per day cases vs. test data, so it’s noisier. The above chart was a cumulative total amount. I’m monitoring all of them.
How many Florida COVID – 19 cases are in the hospital?
One observation is hospitalizations relative to cases. From this trend, we can conclude about 7% of cases are hospitalized, but the trend is down since late May and early June.
Florida finally started reporting COVID cases currently hospitalized last week. We have 7,542 COVID cases in the hospital in Florida.
If we compare currently hospitalized cases relative to hospitalizations we start to get an idea of what percent of hospitalized is currently still hospitalized. The sample size is small here since they only started reporting recently, but we’ll be looking for this trend to fall.
What percent of cases are currently hospitalized? We can get an idea of the trend by comparing Florida cases currently hospitalized to cases. Again, the sample size is small, but it’s trending down at about 3%.
As time passes and we get more and more data, we’ll see directional trends and rates of change.
I’ve been focused on data science, statistics, and probably most of my life. If there is anything I think we’ve learned in 2020 is a shortfall in people’s understanding of the maths.
Many times I’ve heard people state silly things about the data being incomplete, or imperfect.
But we rarely every have perfect data, or complete data.
I’ve heard mathematically ignorant people make fun of statistics and probability, yet most everything around is is based on those very things.
The reality is, we live in an imperfect world, we live with uncertainly about most everything.
Many events can’t be predicted with certainty.
The best we can do is determine how likely they are to happen, using the concept of probability.
Probability is simply how likely something is to happen.
When we are unsure about the outcome of something, we can talk about the probabilities of certain outcomes—how likely they are.
The analysis of events with probability is called statistics.
Statistics is a mathematical body of science that pertains to the collection, analysis, interpretation or explanation, and presentation of data. It’s a branch of math.
So, we’ve got a lot of new uptrends in cases and such down south, hopefully we are seeing it peak and trend down.
It’s uncertain, so all we can do is monitor the data for directional trends and changing momentum. When the rate of change picked up last month, I suggested we’d see an uptrend in cases, as we did.
We want to see the rate of change slow down, then the spread dies off and trends down. Until we do, prepare, and protect yourself accordingly.
In the meantime, I encourage everyone to study maths like probability and statistics.
We don’t have to be sure about anything, if we are pretty sure about something, and place our bets accordingly.
Mike Shell is the Founder and Chief Investment Officer of Shell Capital Management, LLC, and the portfolio manager of ASYMMETRY® Global Tactical. Mike Shell and Shell Capital Management, LLC is a registered investment advisor focused on asymmetric risk-reward and absolute return strategies and provides investment advice and portfolio management only to clients with a signed and executed investment management agreement. The observations shared on this website are for general information only and should not be construed as advice to buy or sell any security. Securities reflected are not intended to represent any client holdings or any recommendations made by the firm. Any opinions expressed may change as subsequent conditions change. Do not make any investment decisions based on such information as it is subject to change. Investing involves risk, including the potential loss of principal an investor must be willing to bear. Past performance is no guarantee of future results. All information and data are deemed reliable but is not guaranteed and should be independently verified. The presence of this website on the Internet shall in no direct or indirect way raise an implication that Shell Capital Management, LLC is offering to sell or soliciting to sell advisory services to residents of any state in which the firm is not registered as an investment advisor. The views and opinions expressed in ASYMMETRY® Observations are those of the authors and do not necessarily reflect a position of Shell Capital Management, LLC. The use of this website is subject to its terms and conditions.
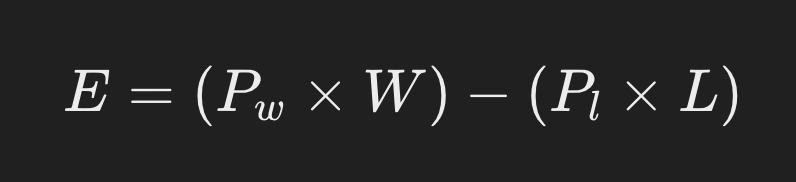


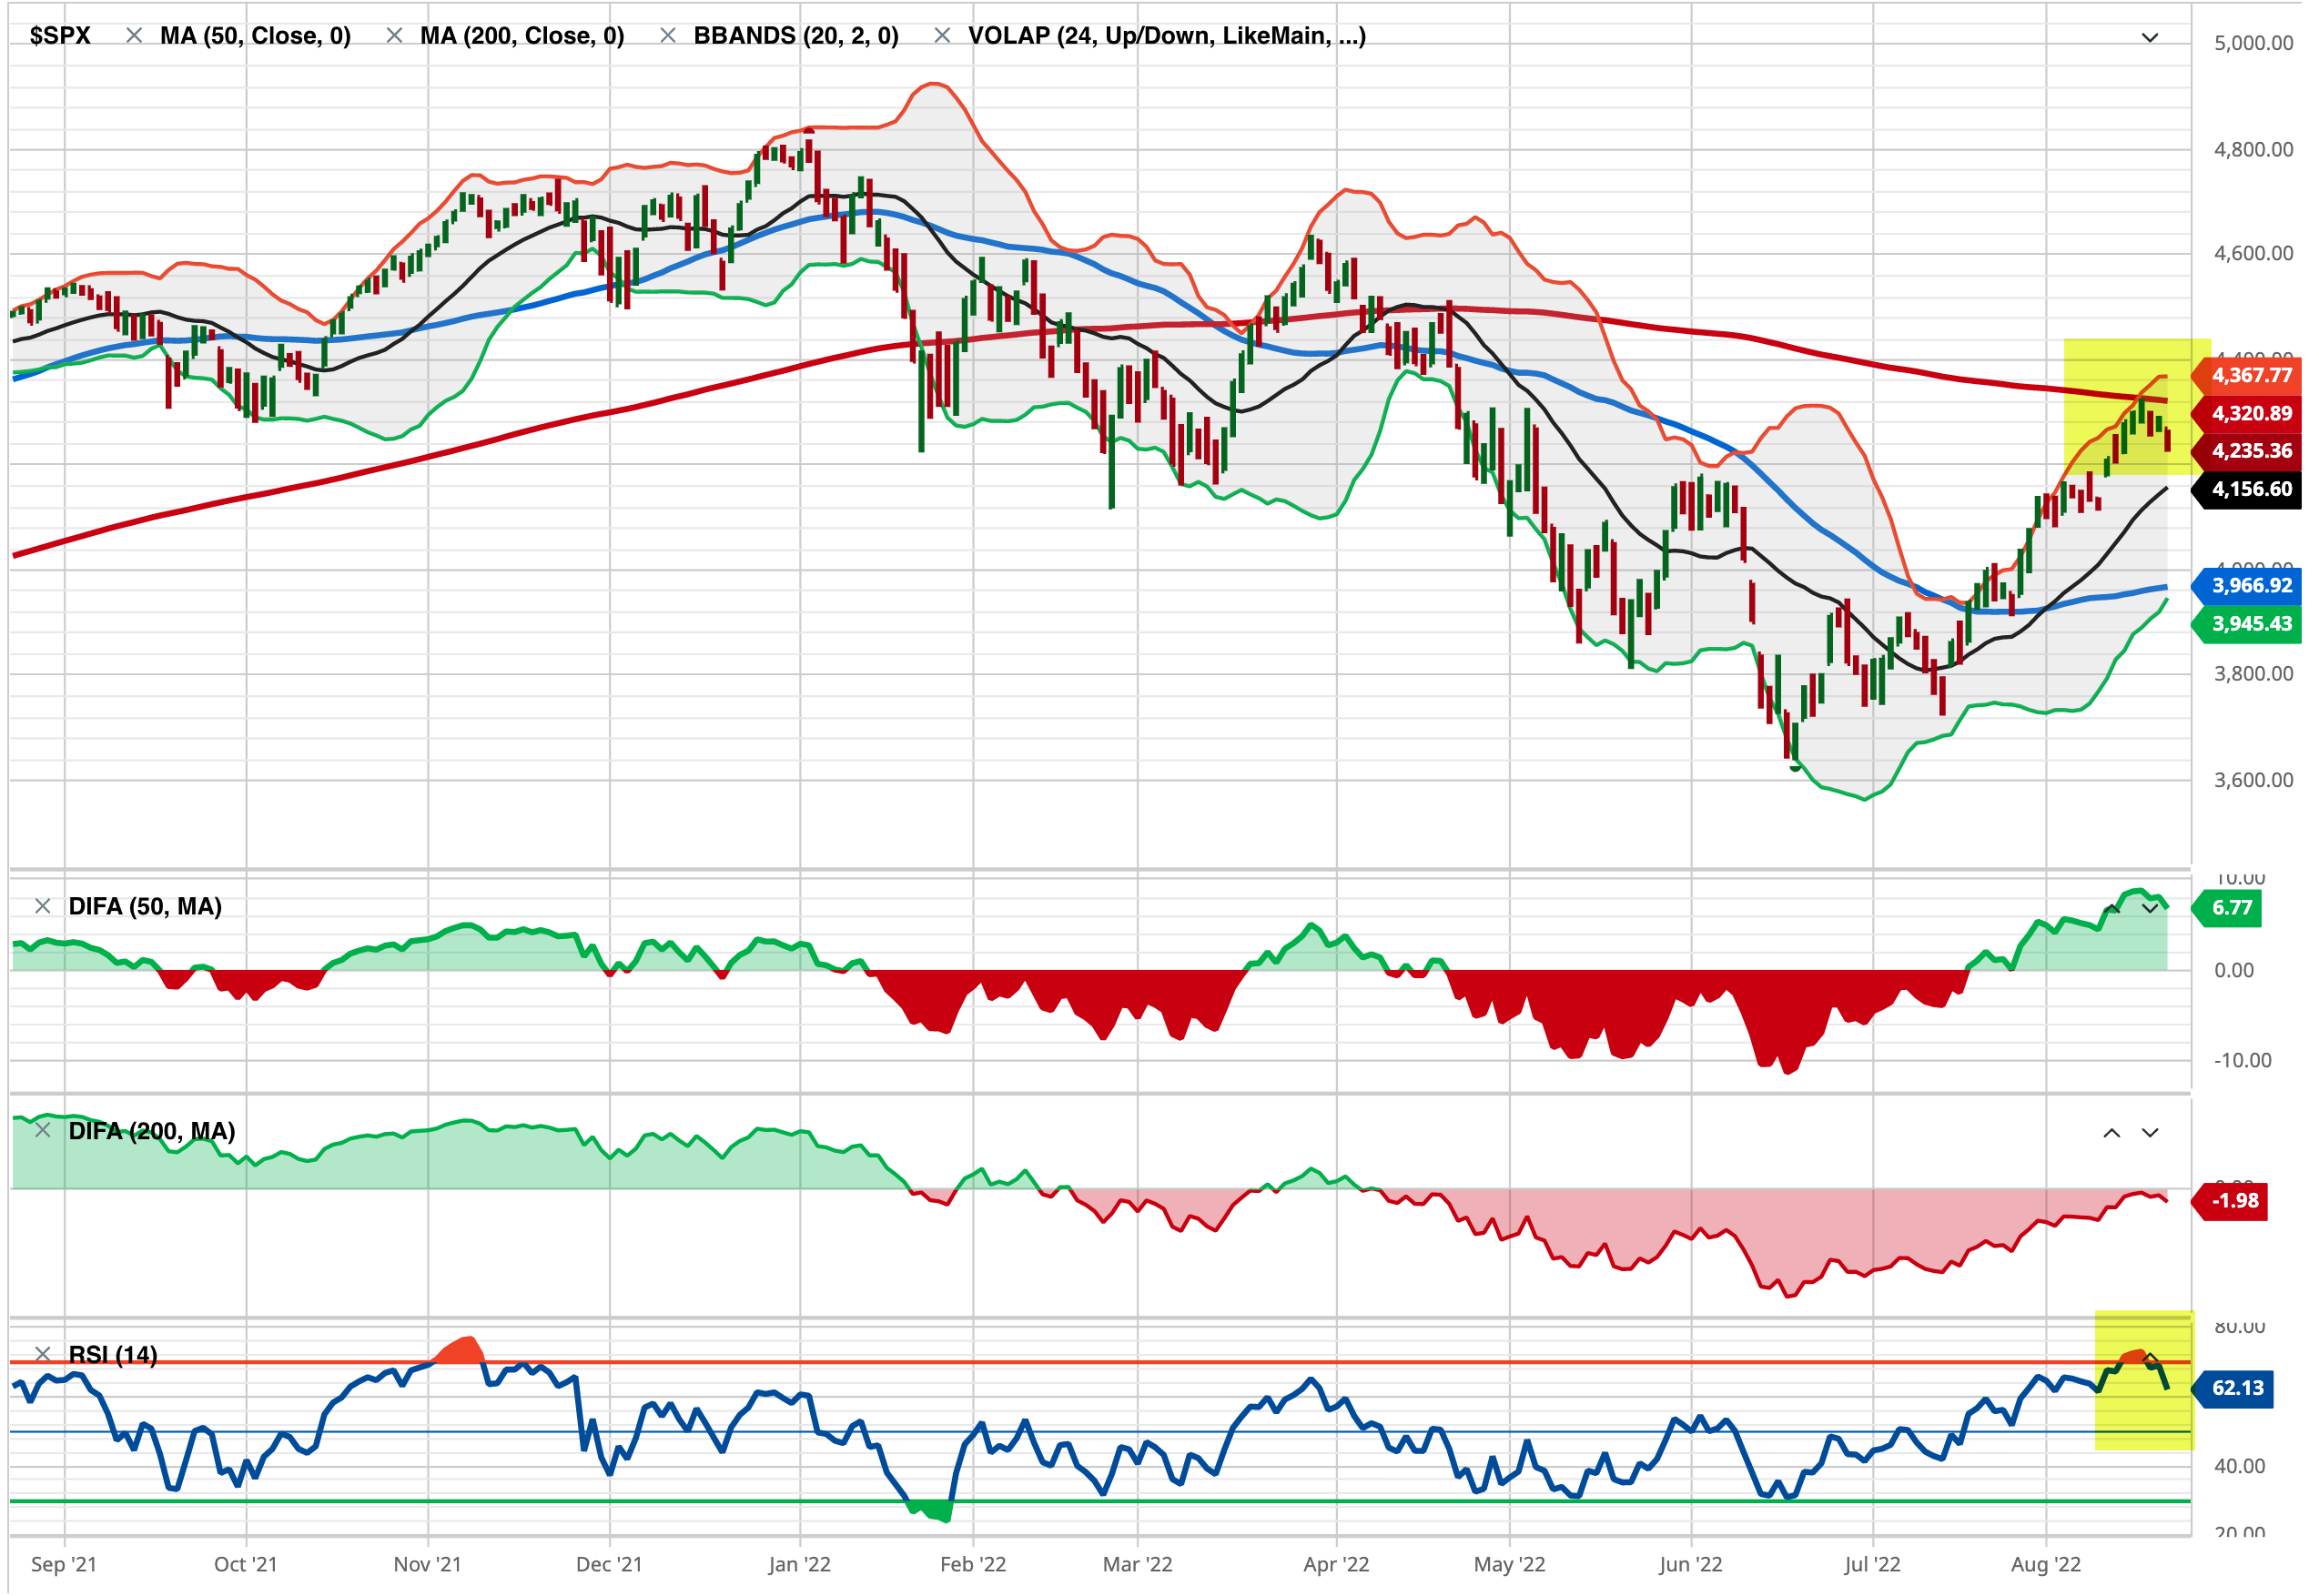
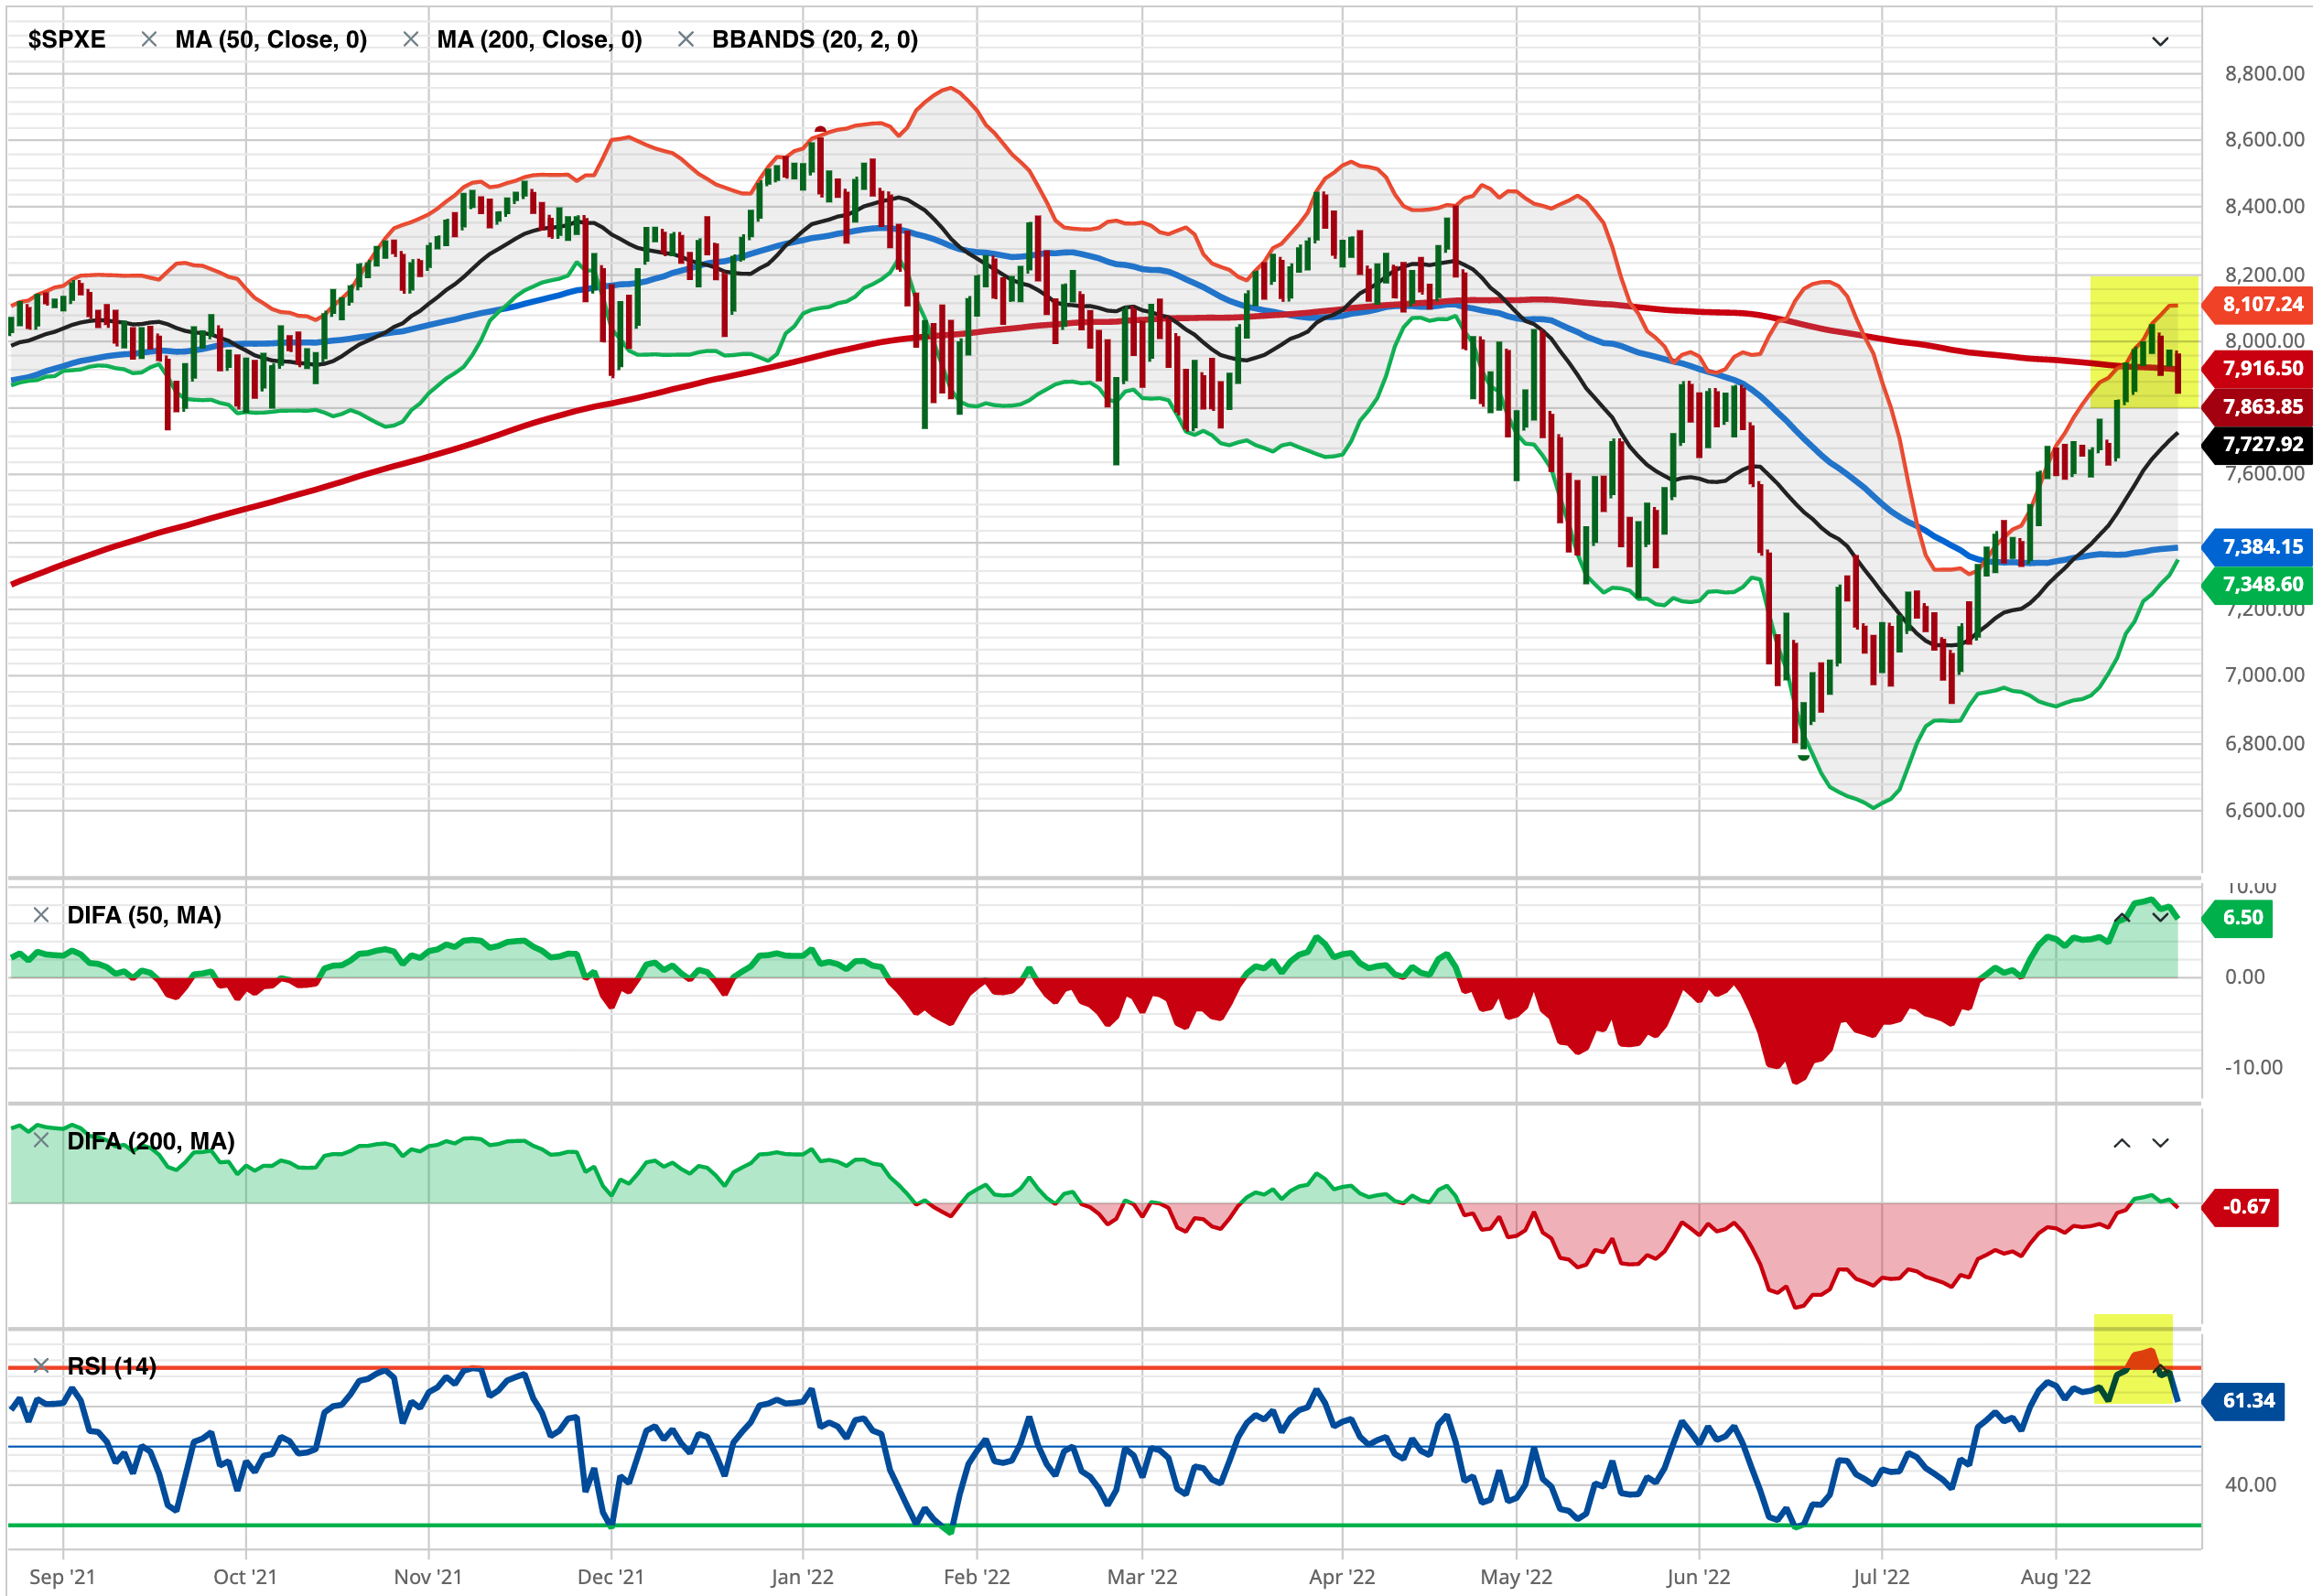

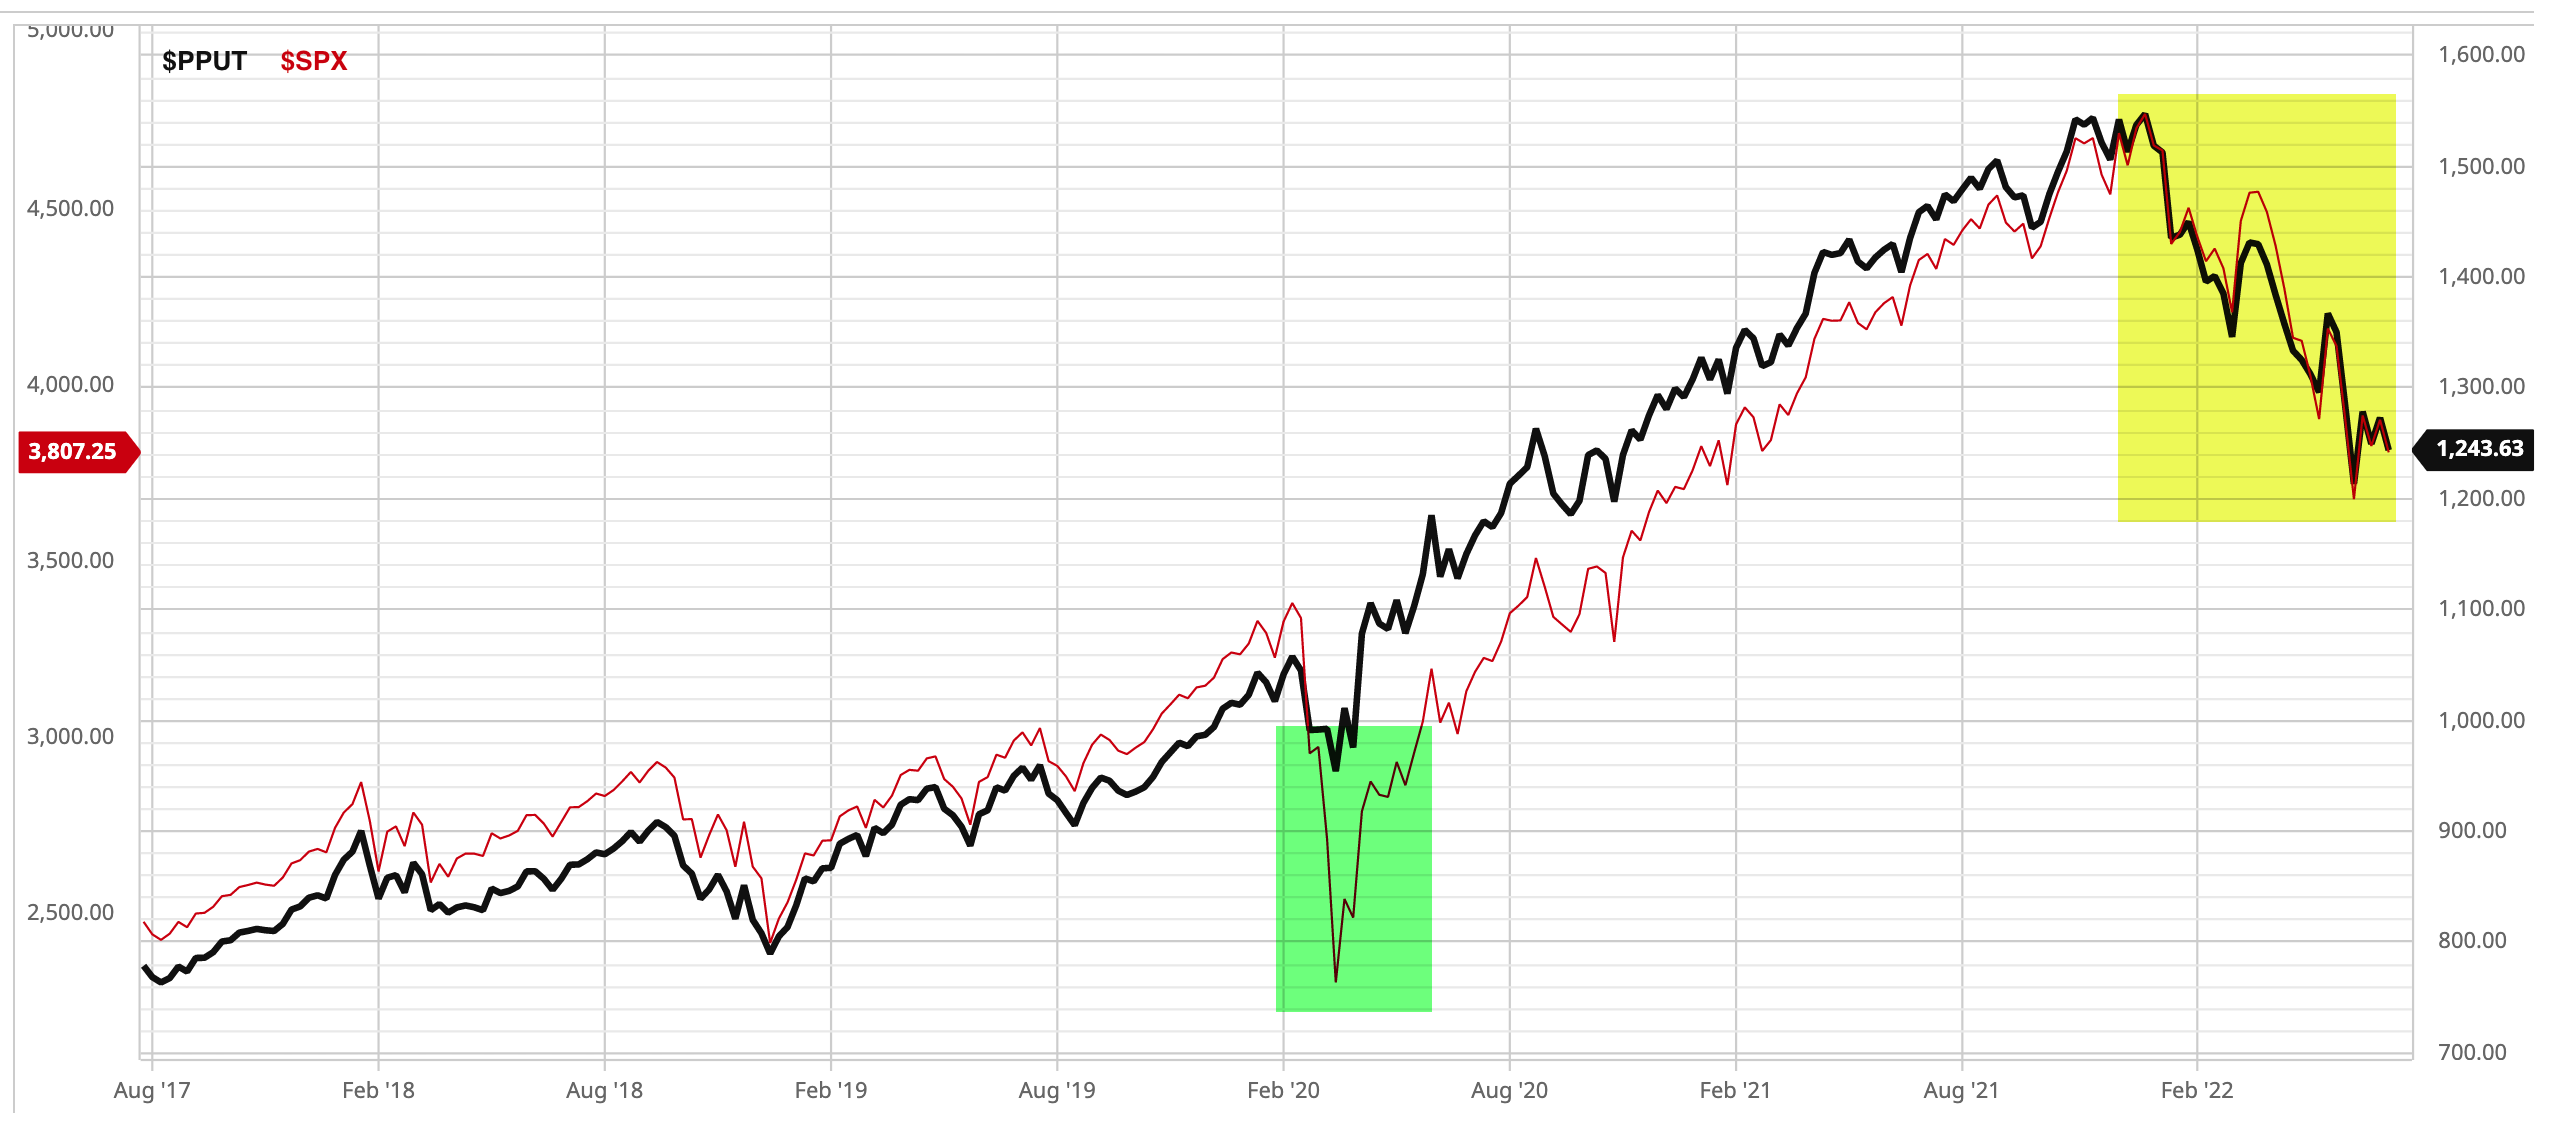
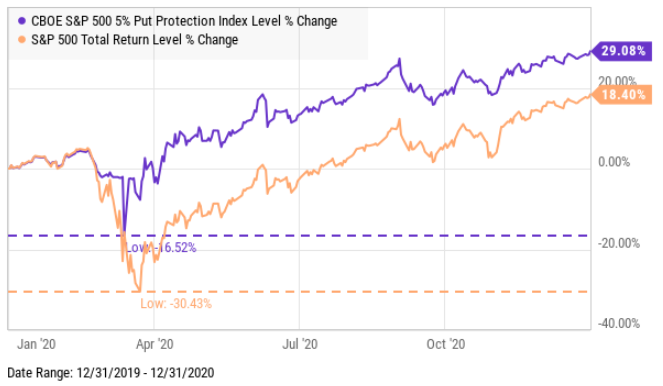

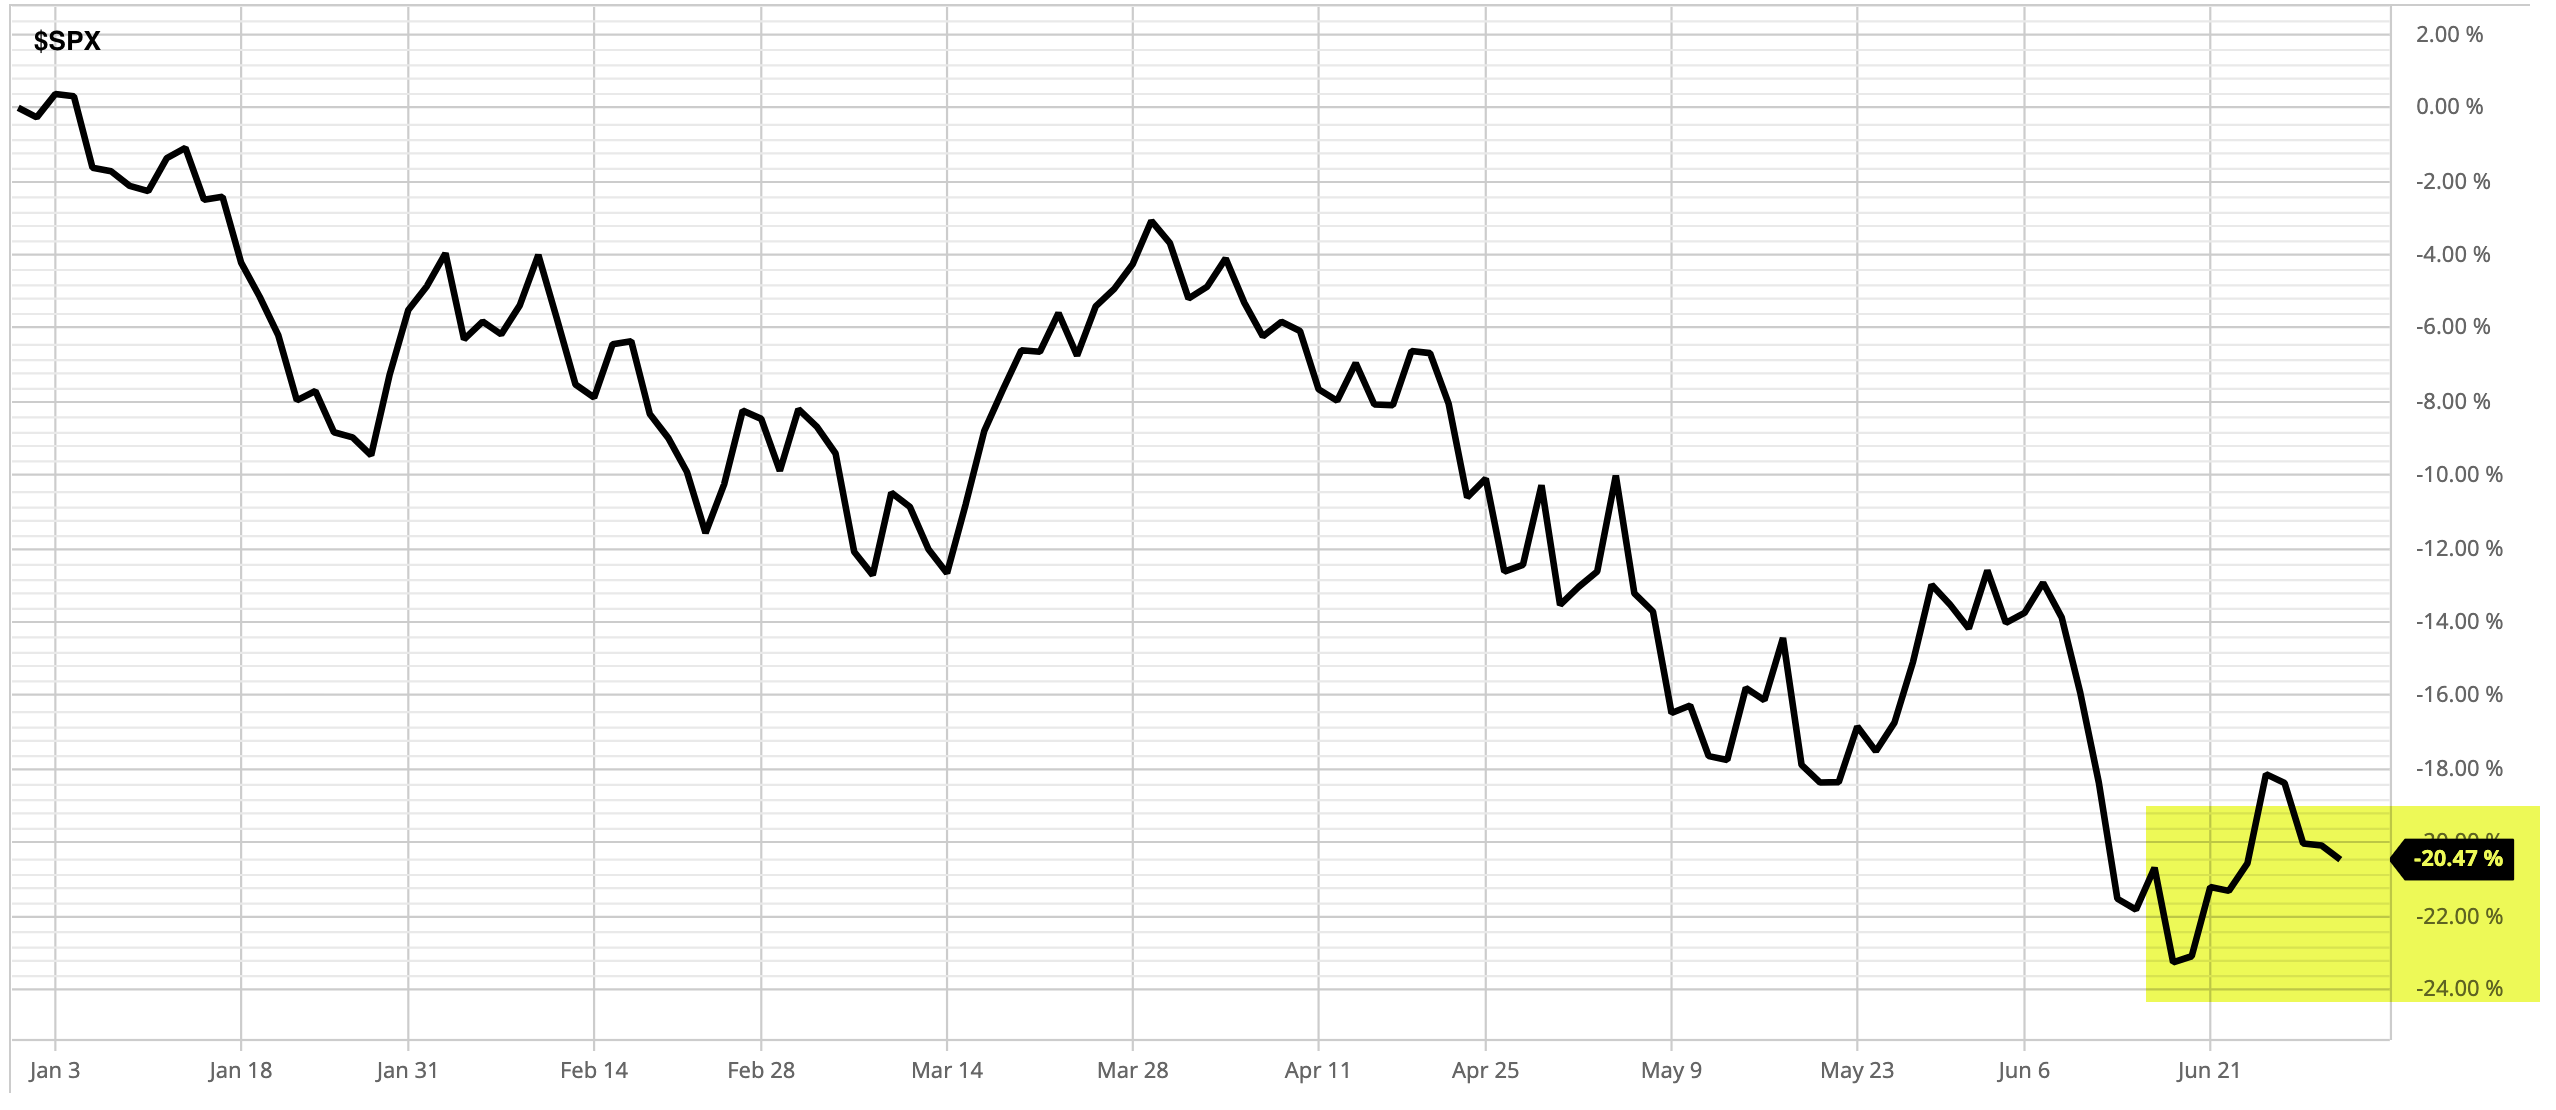
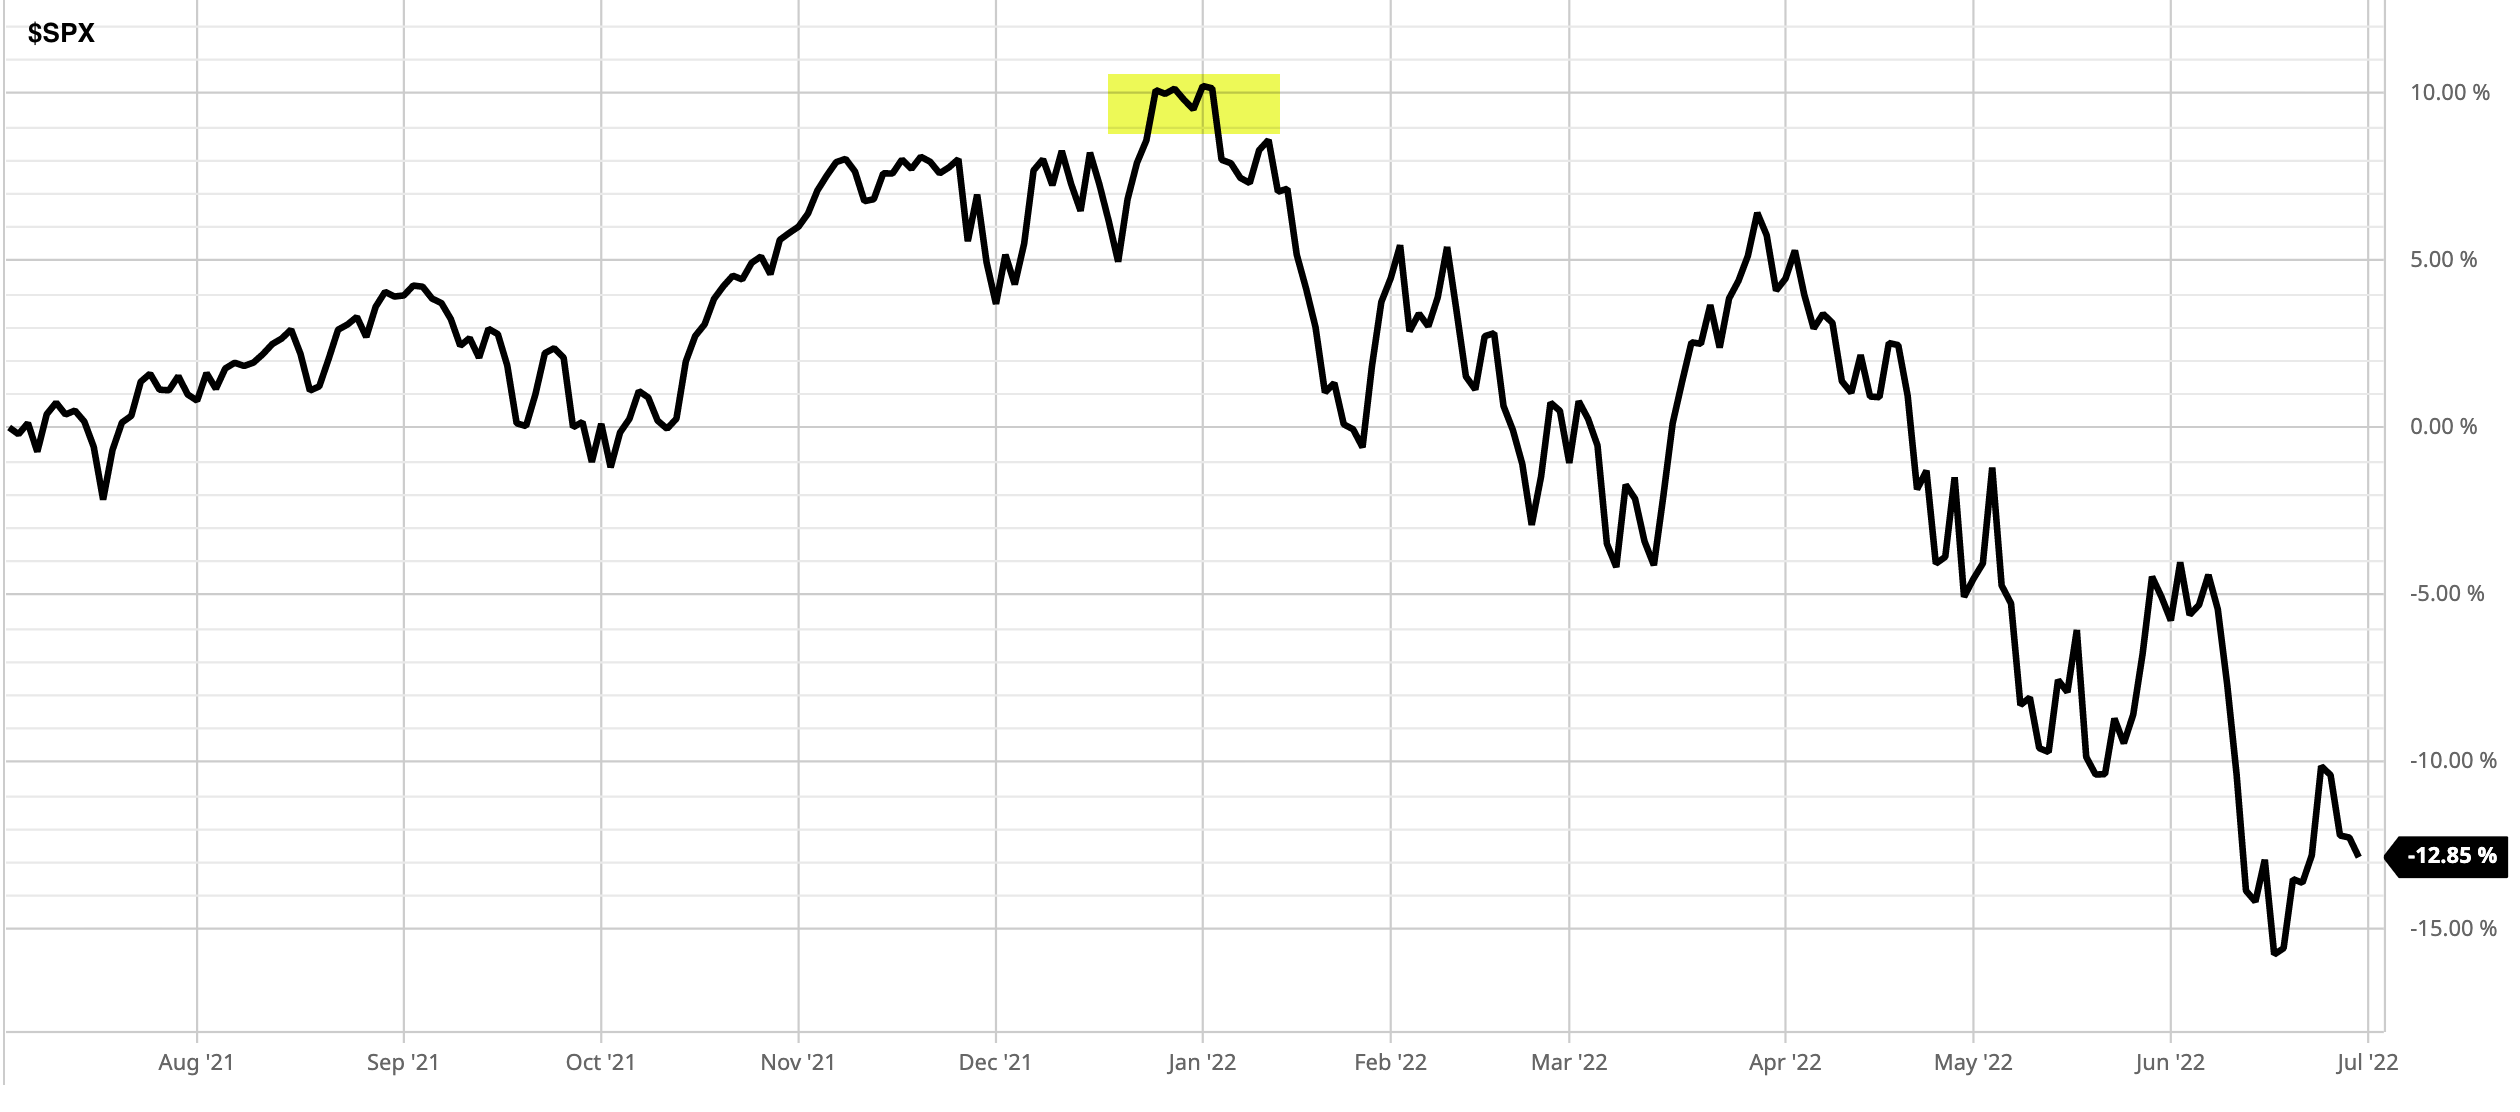


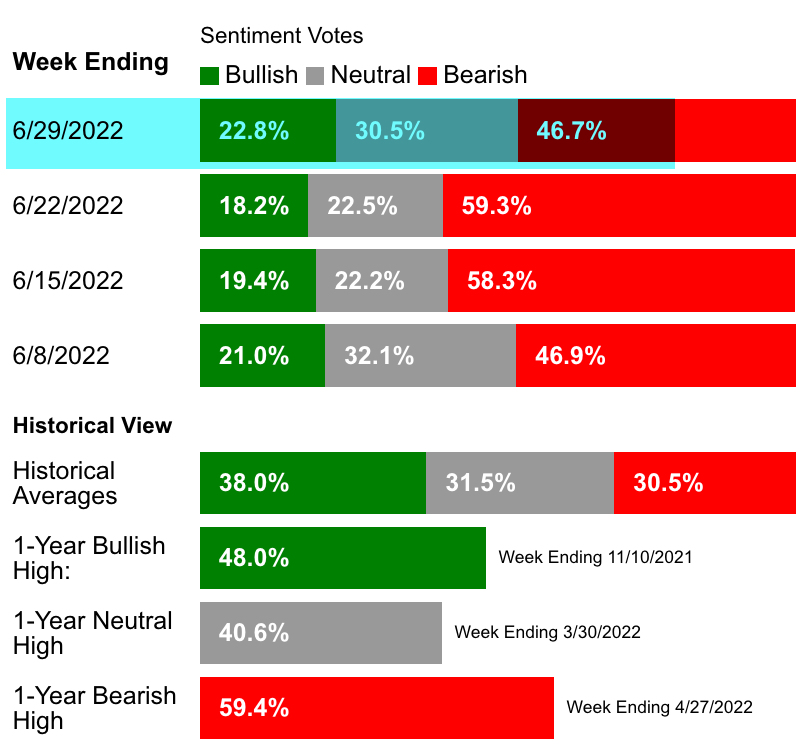
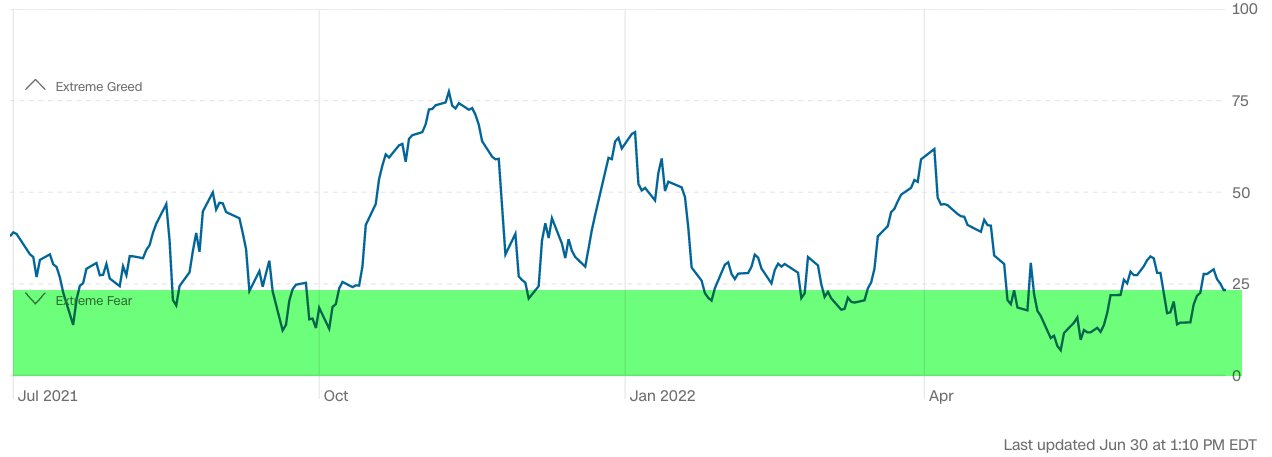

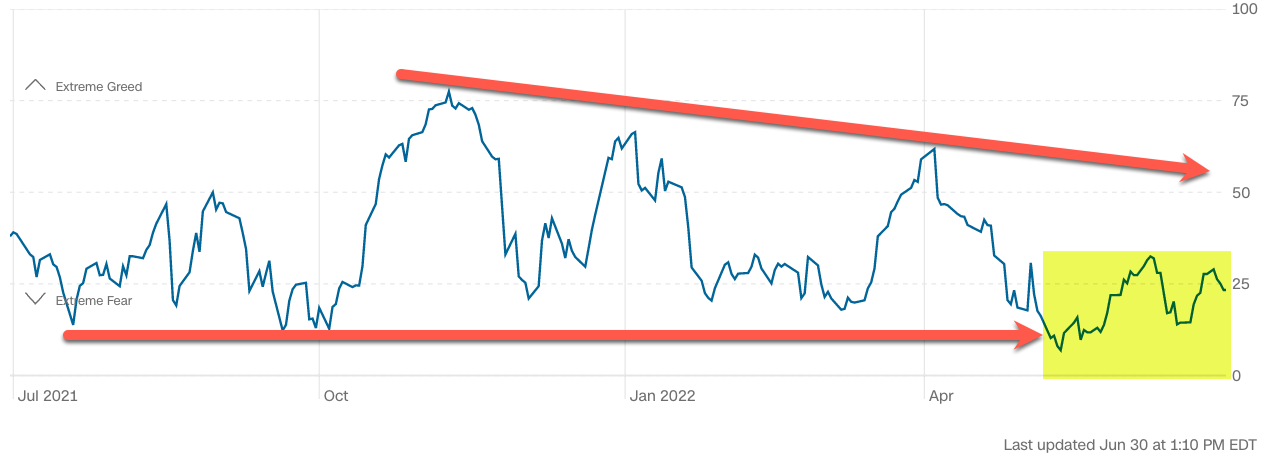
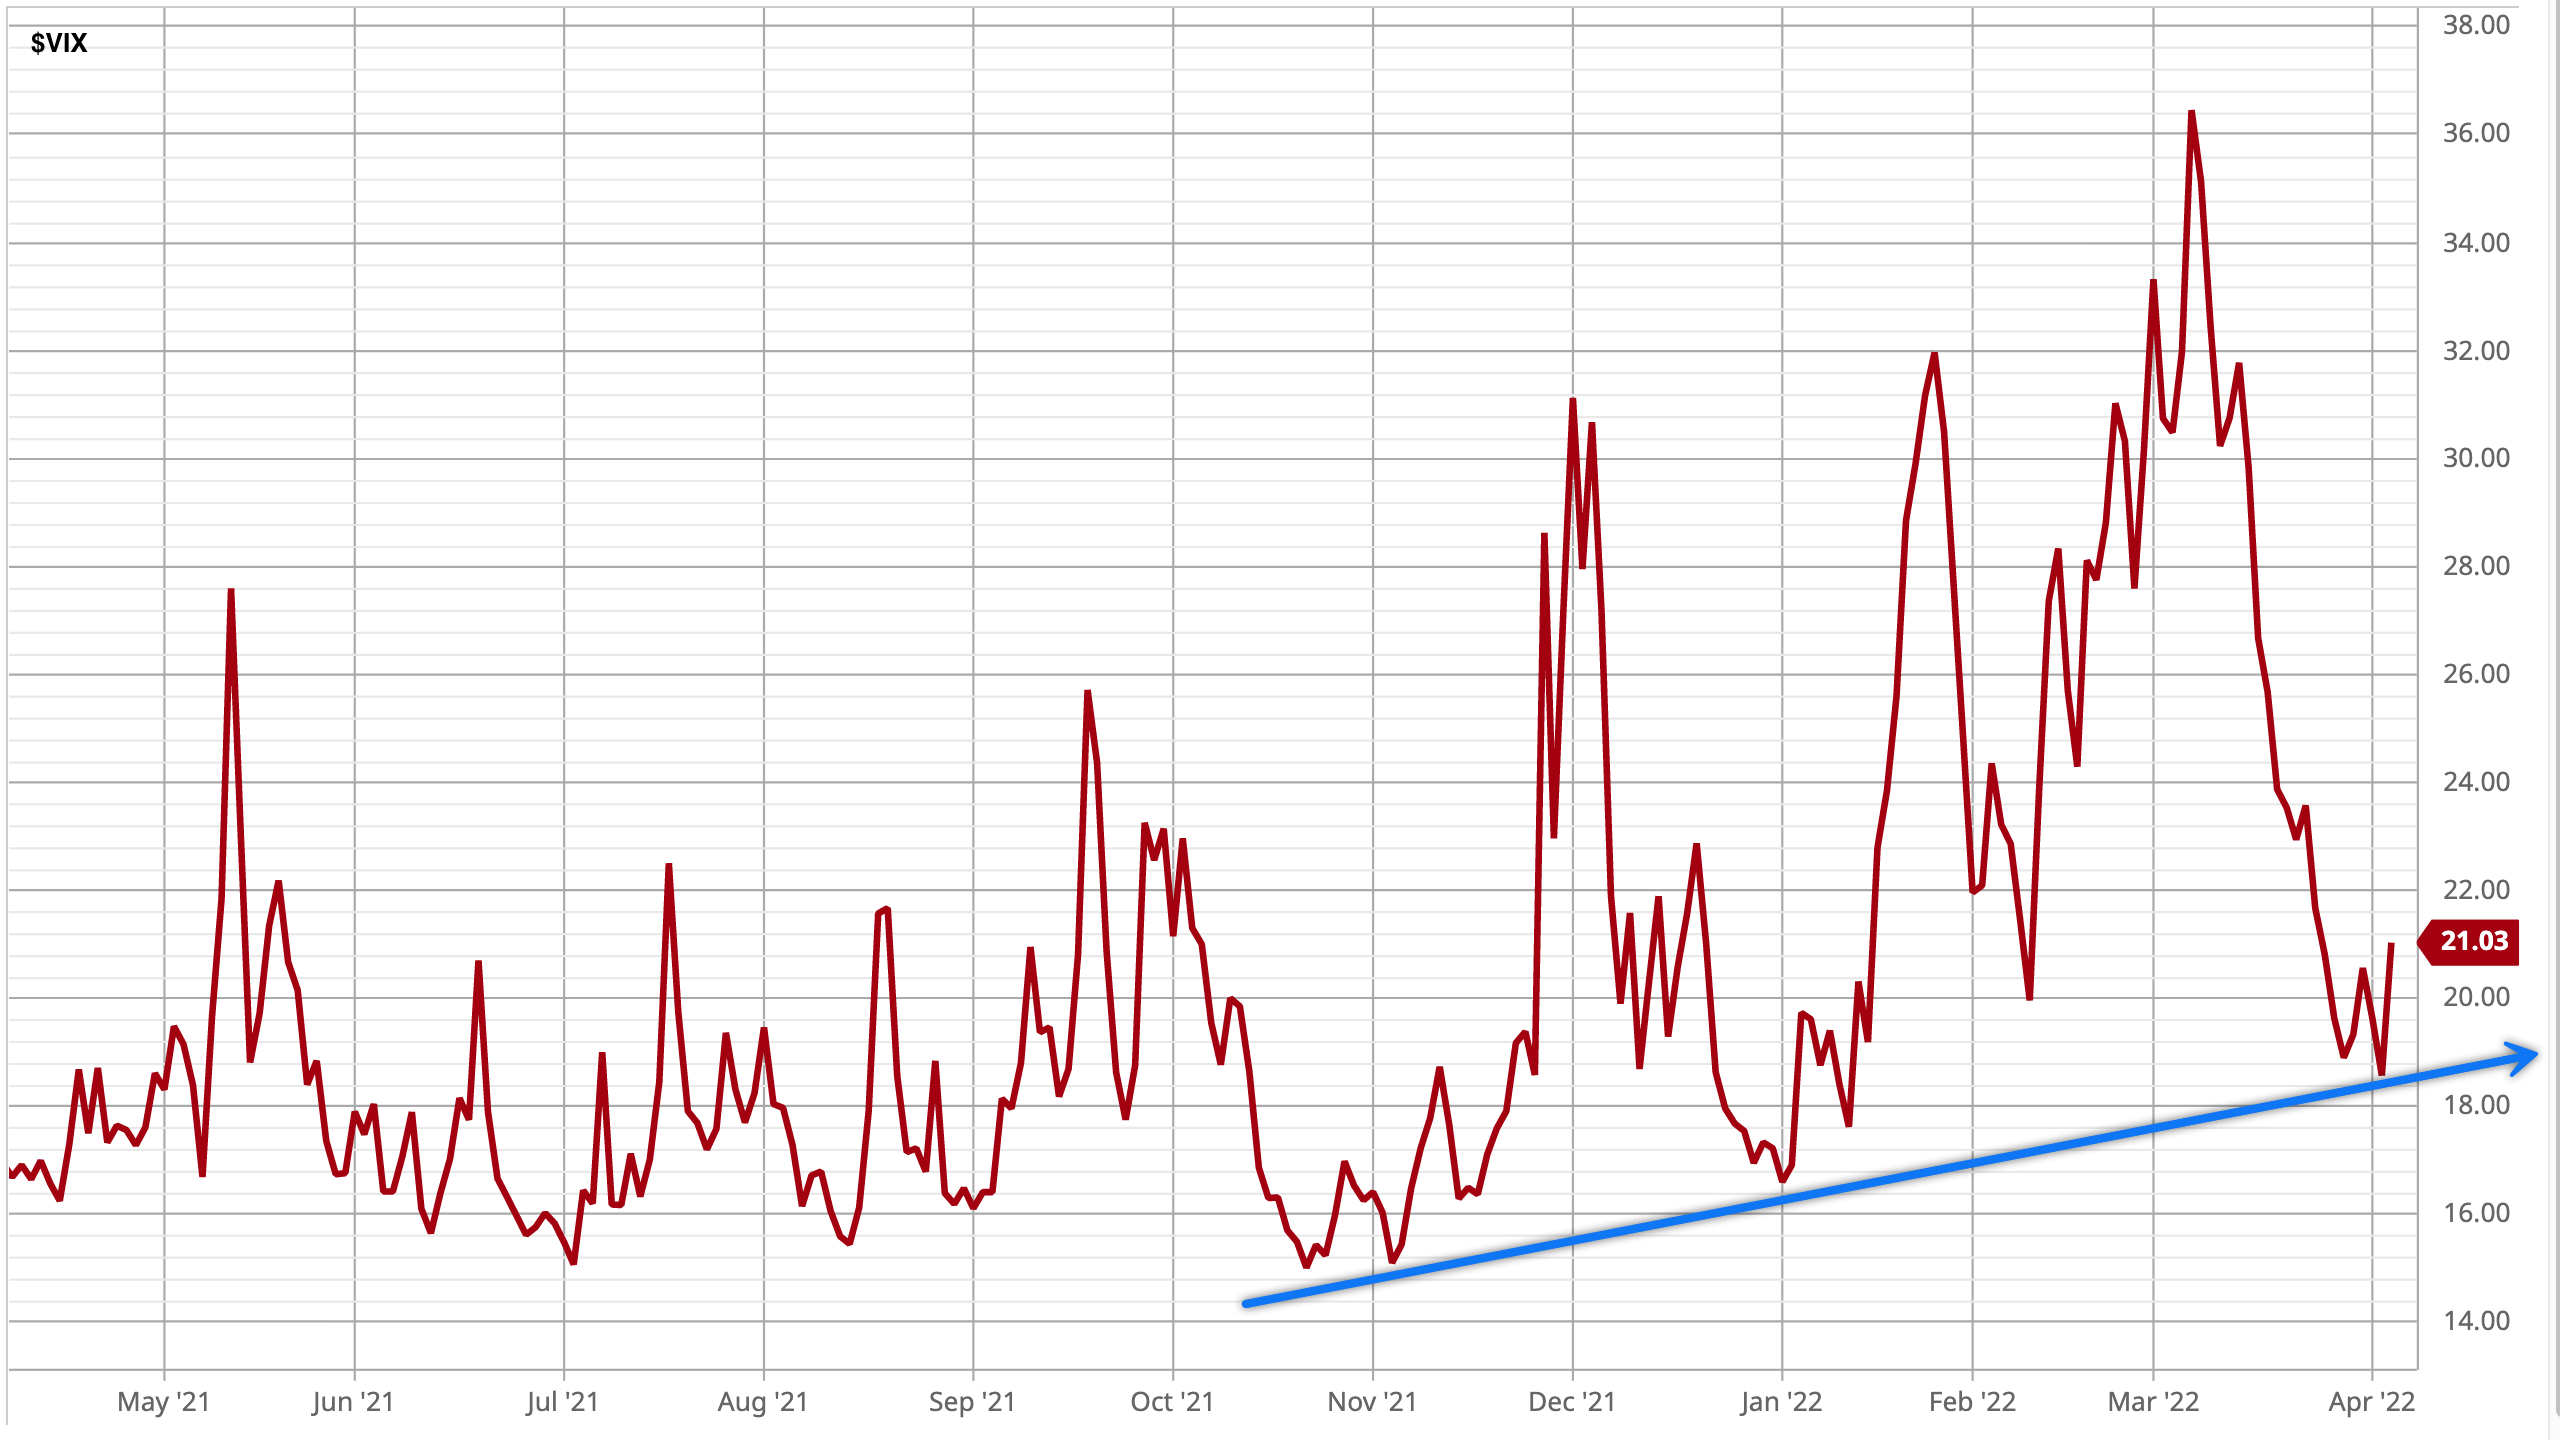
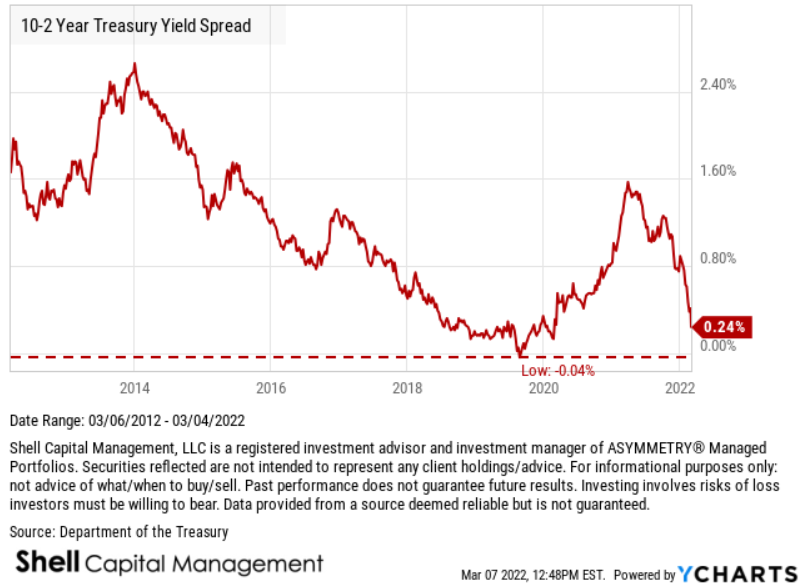

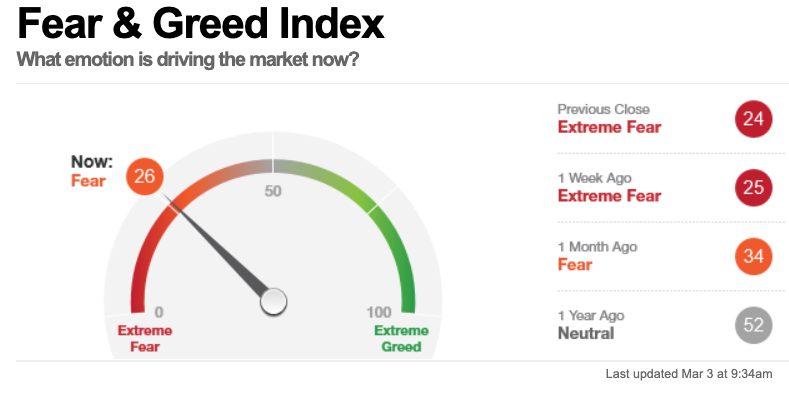
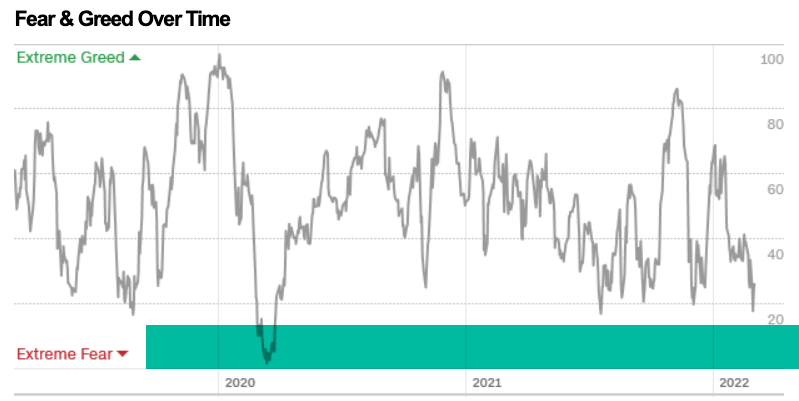


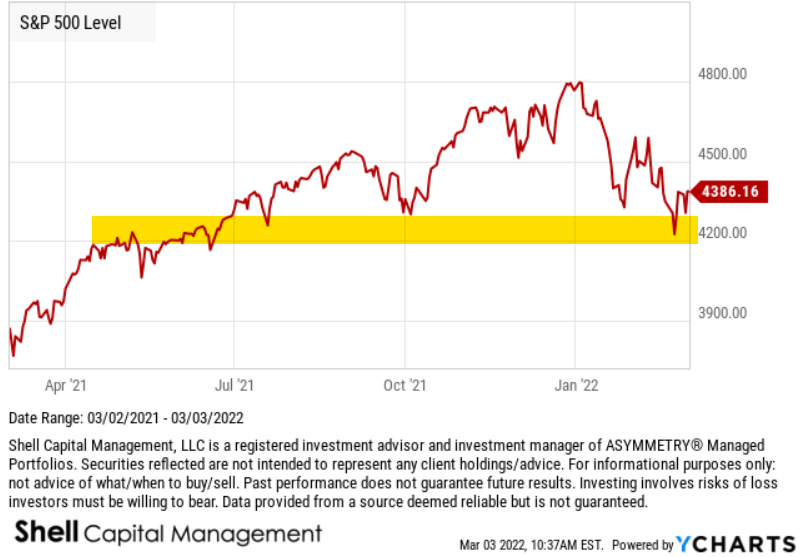
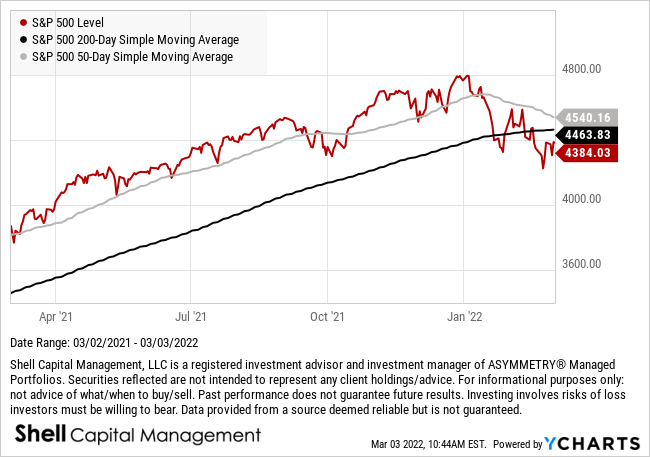


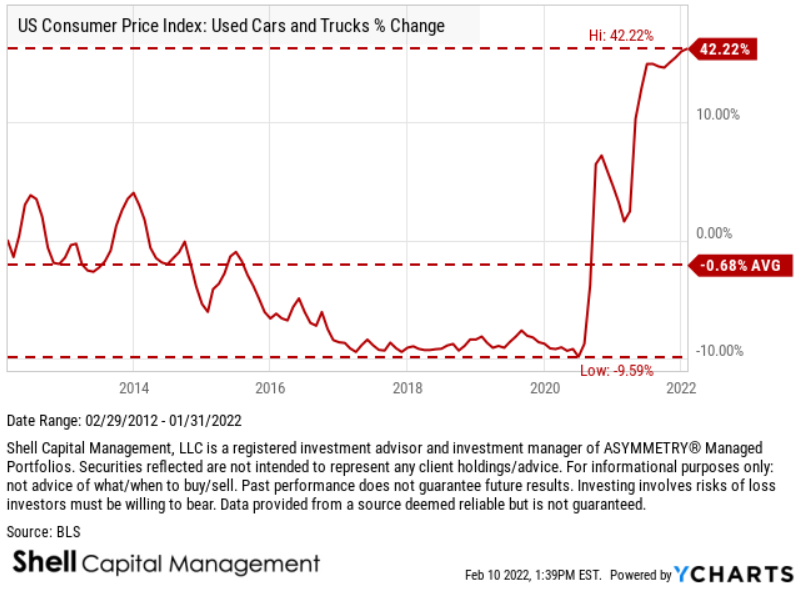
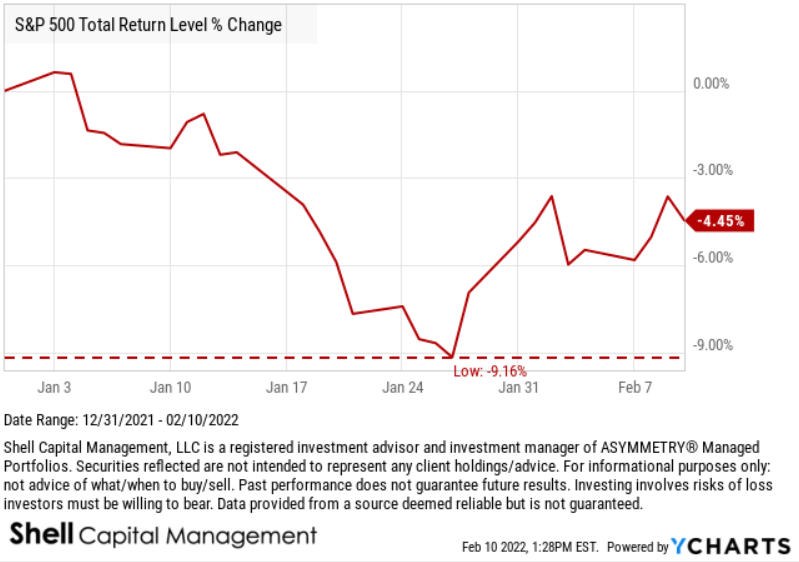
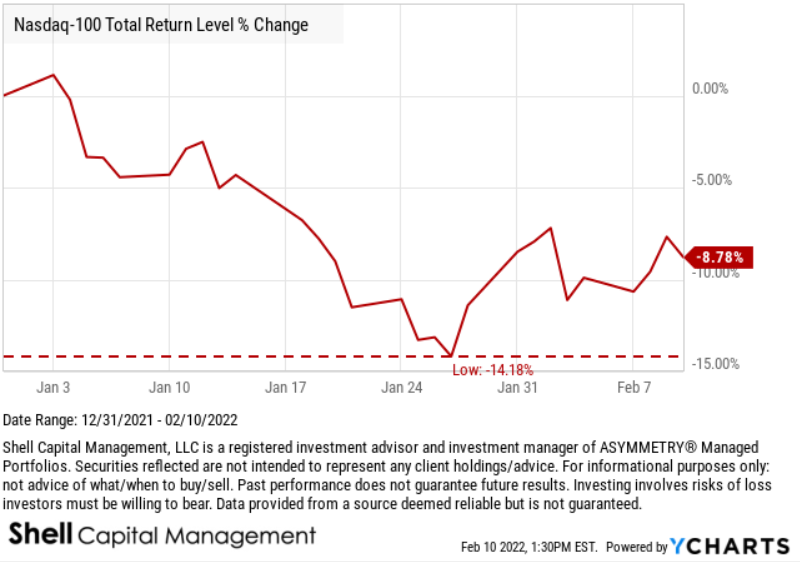
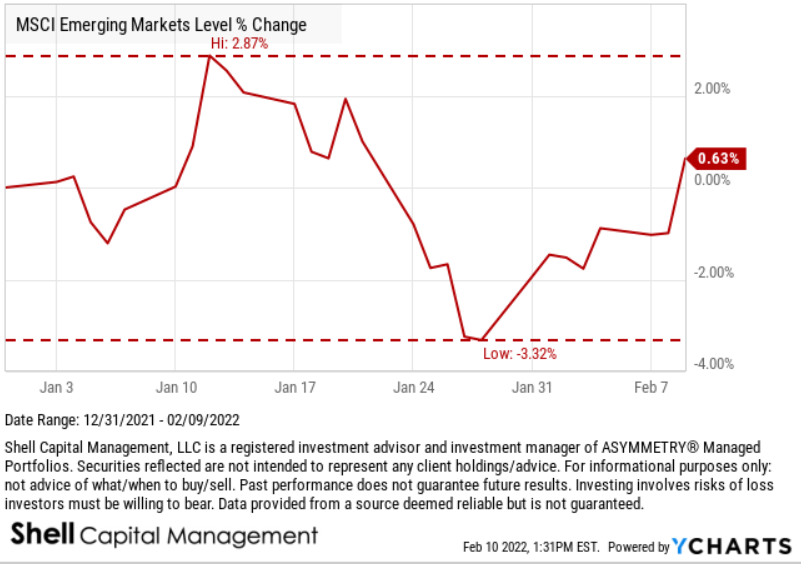

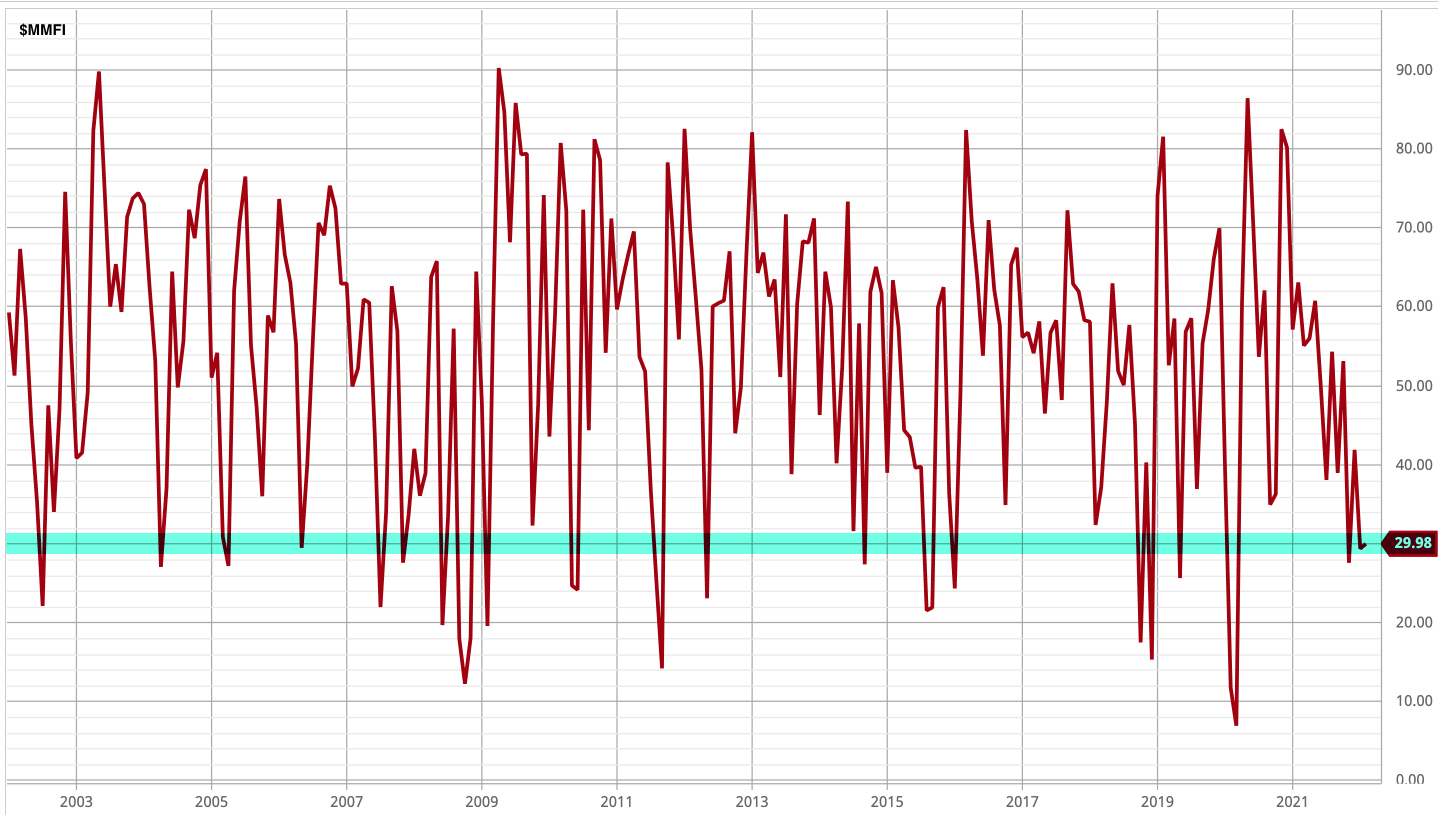
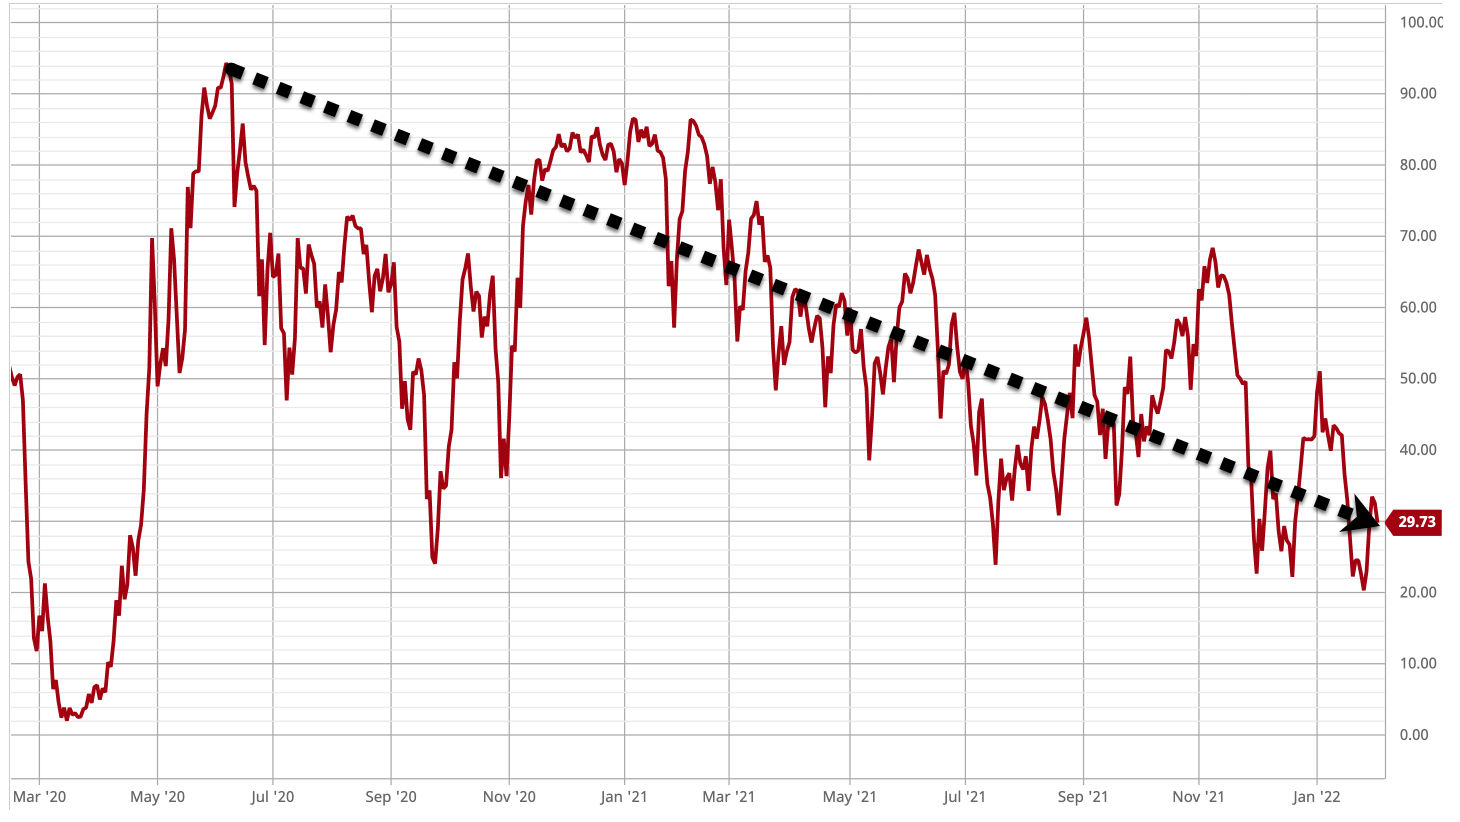
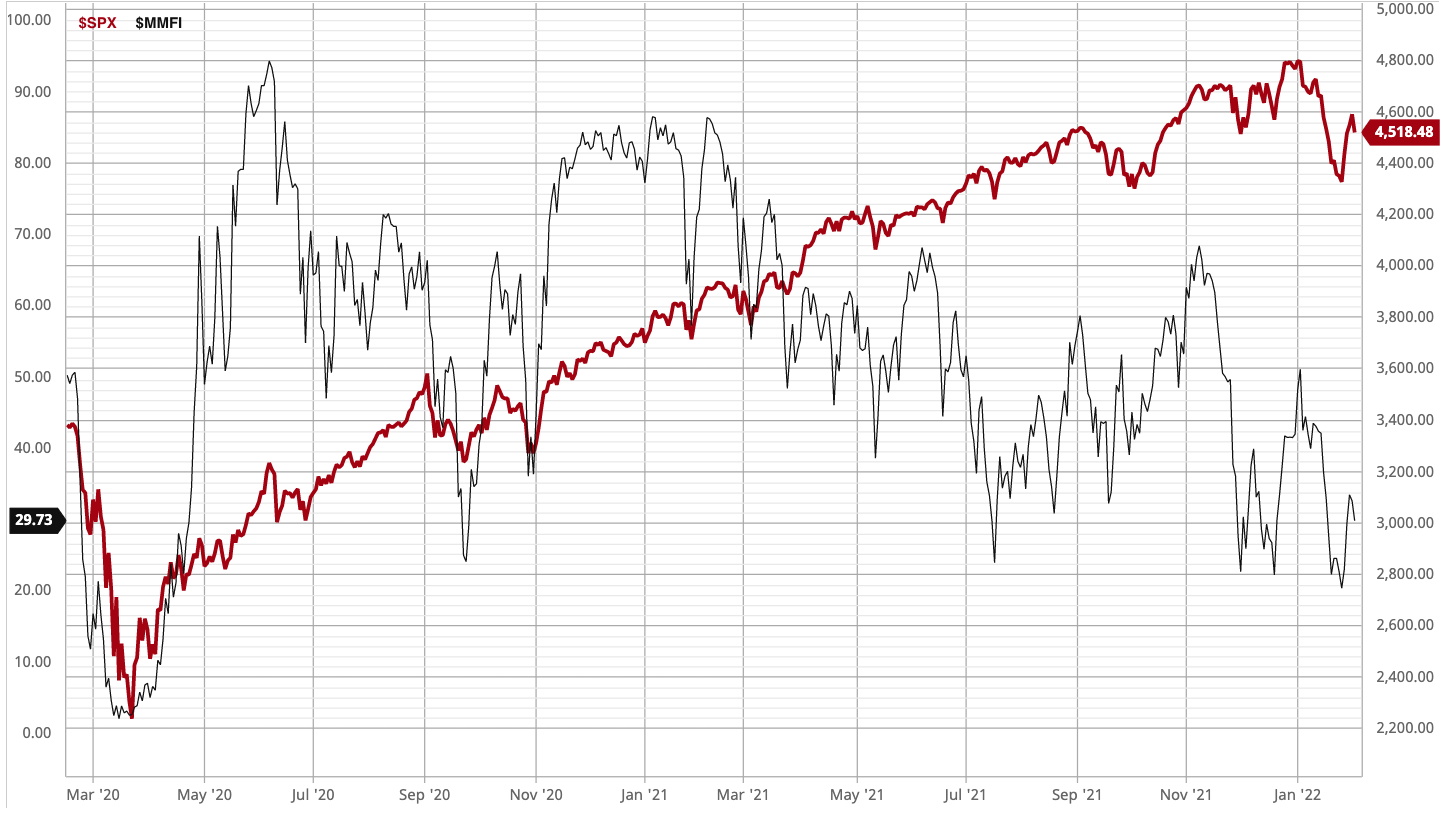
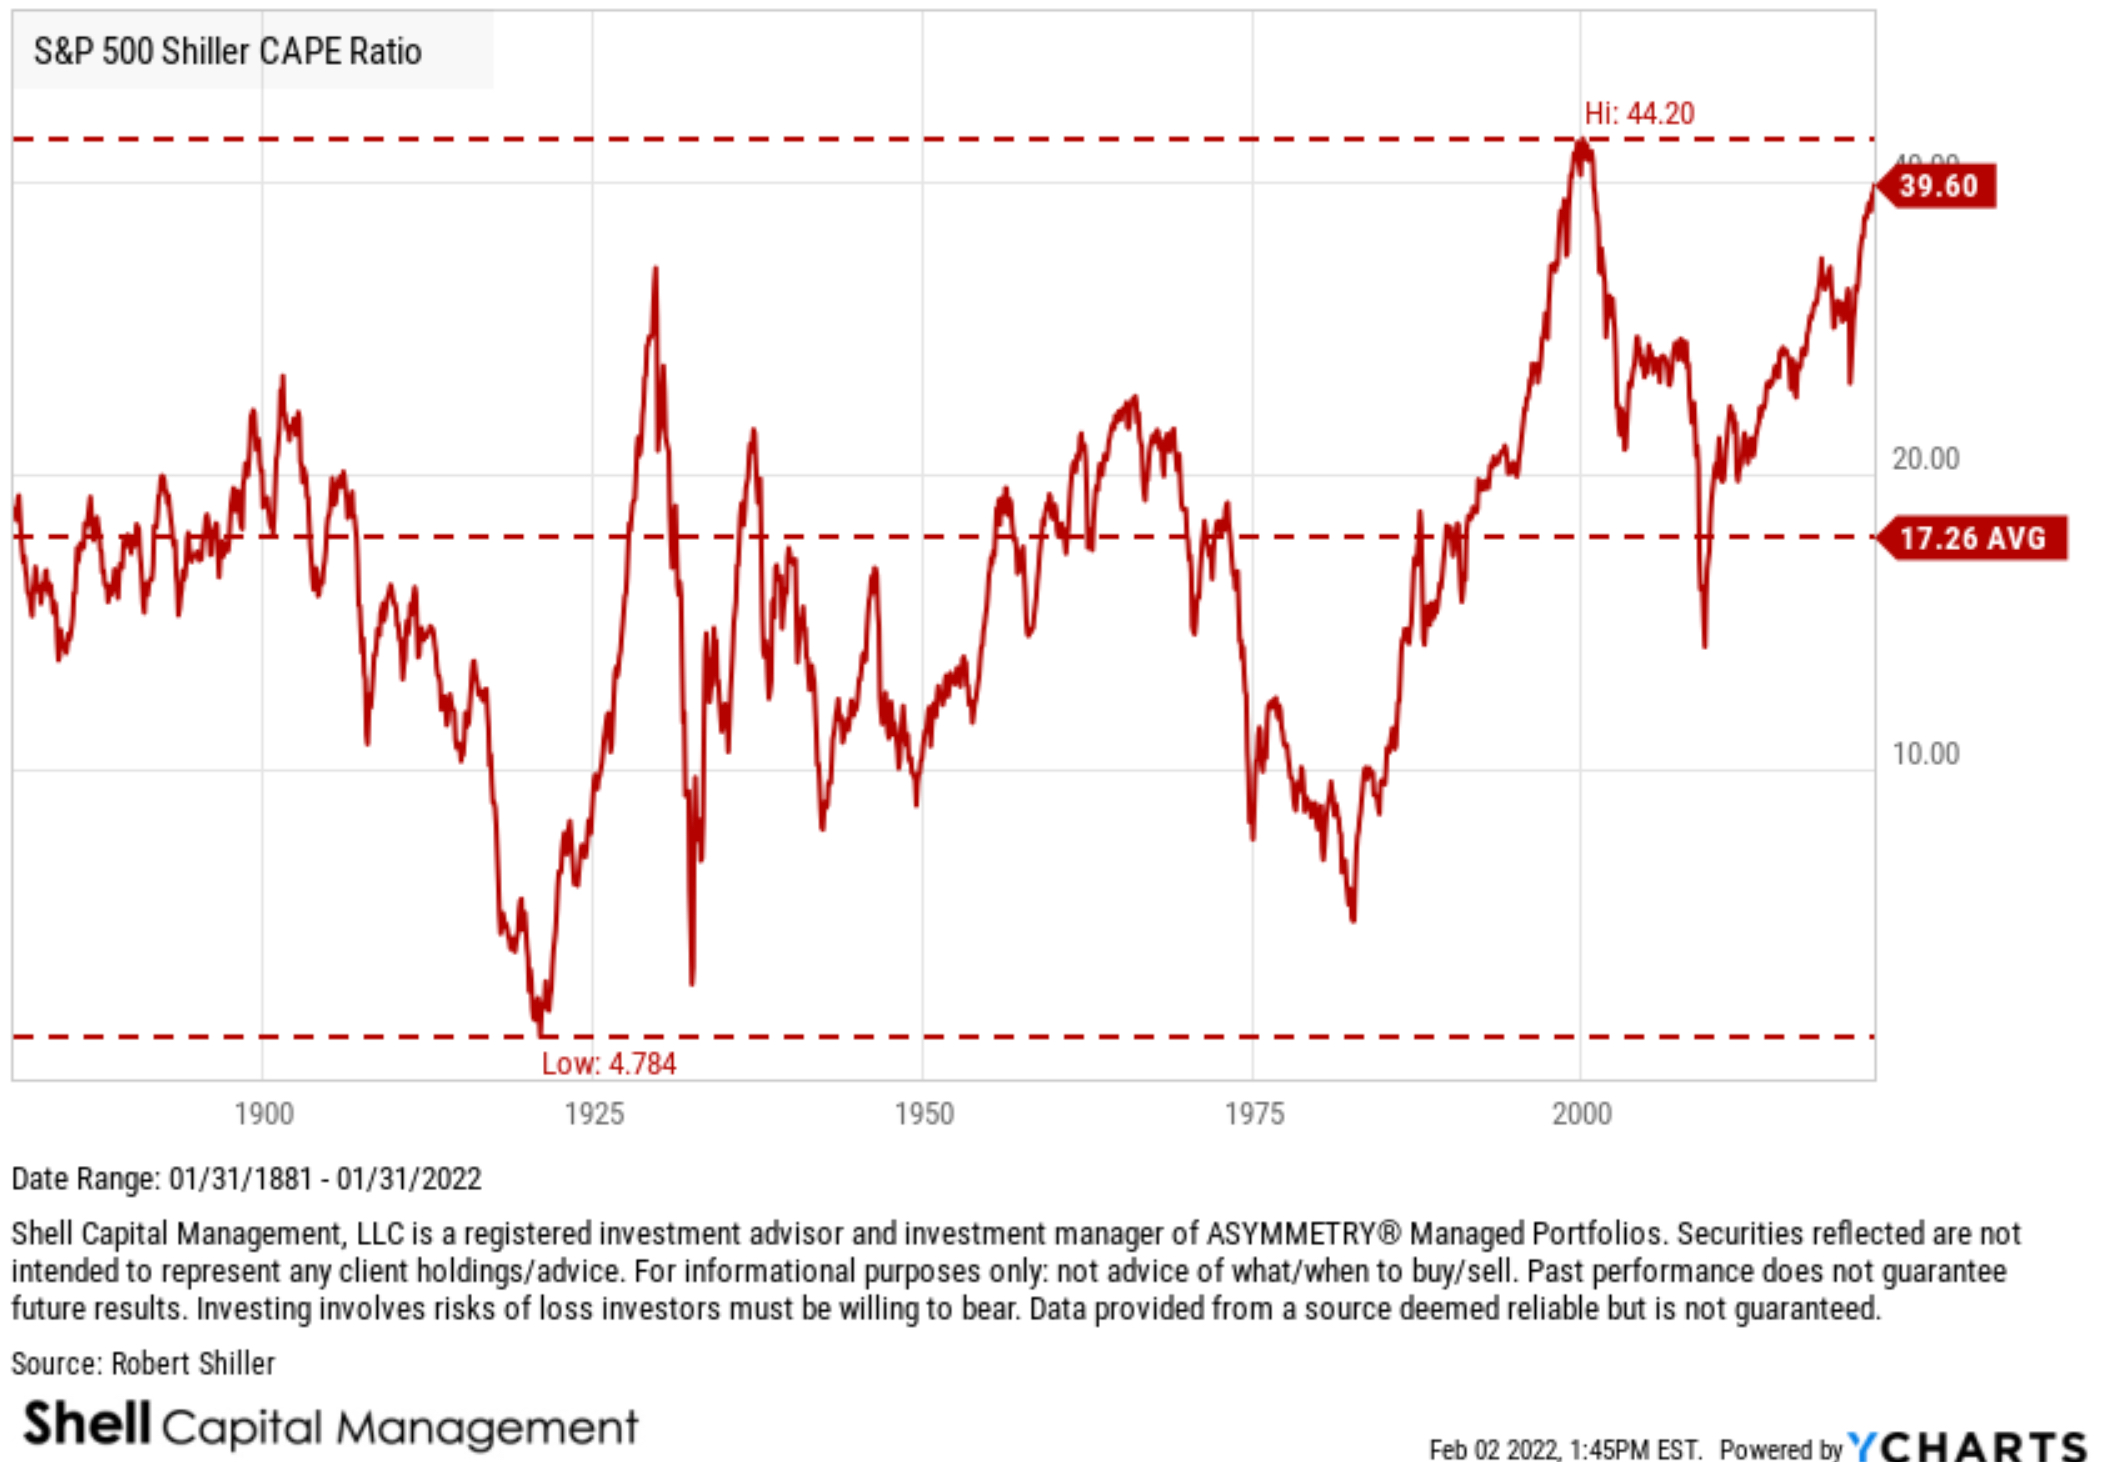

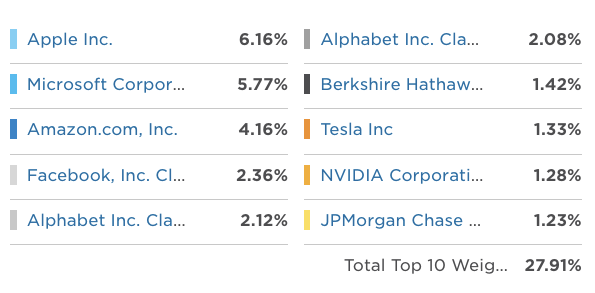
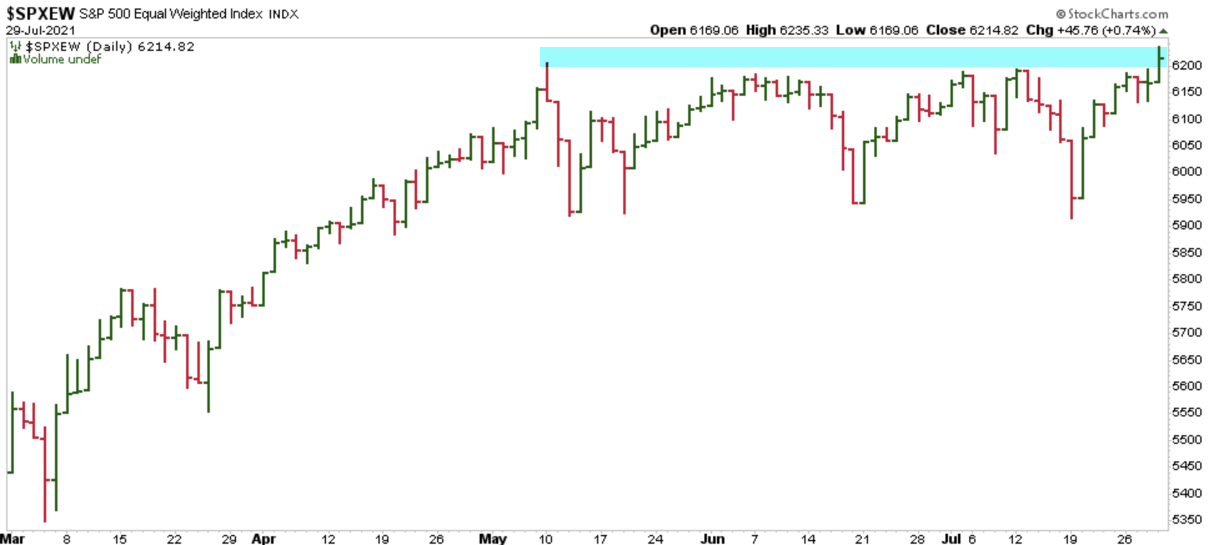
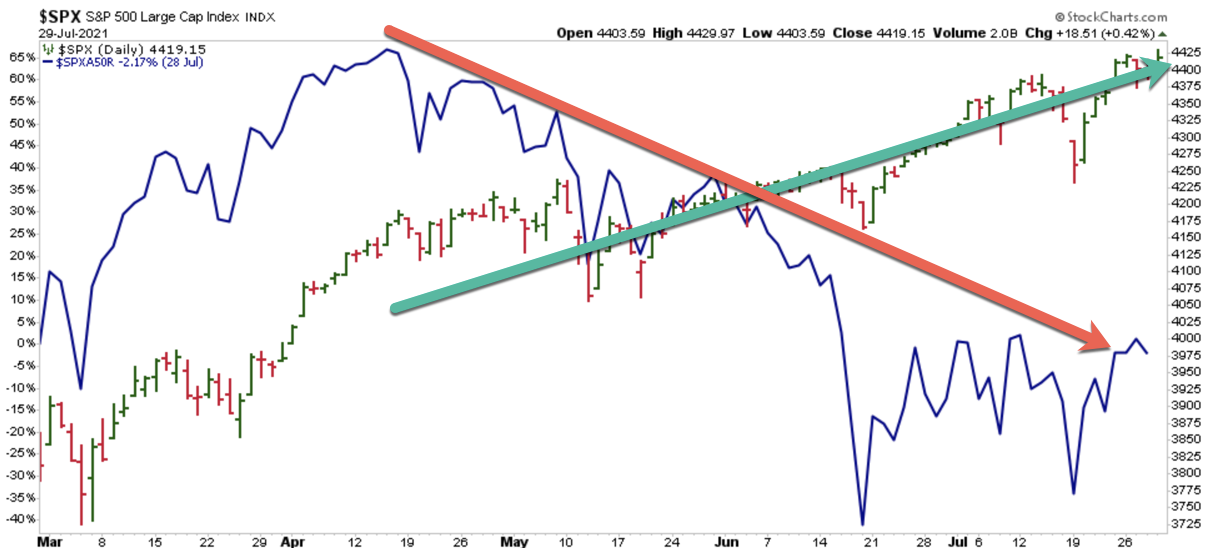
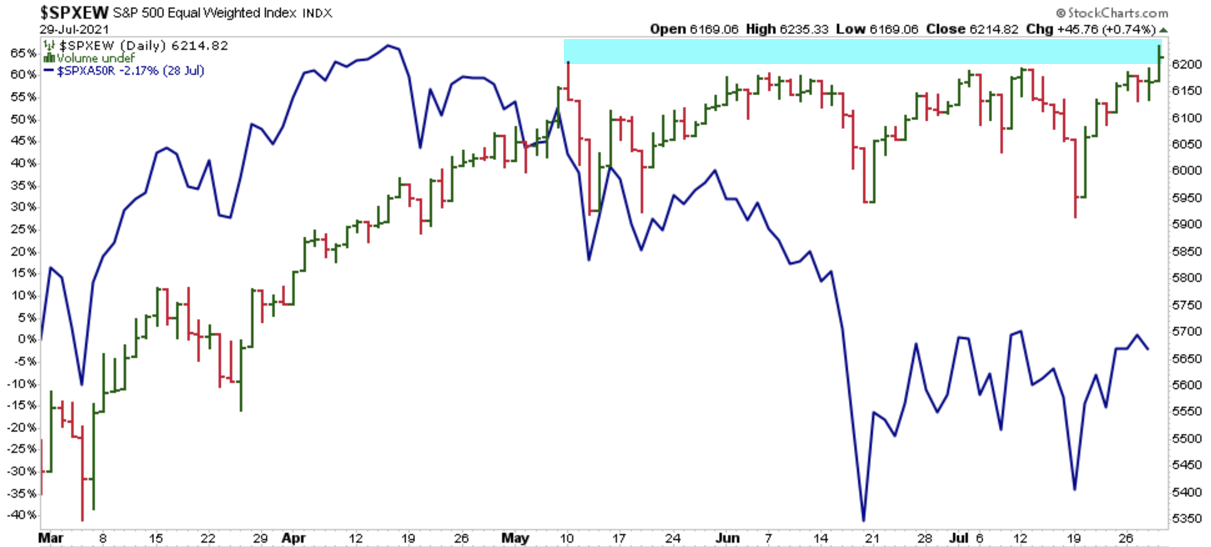
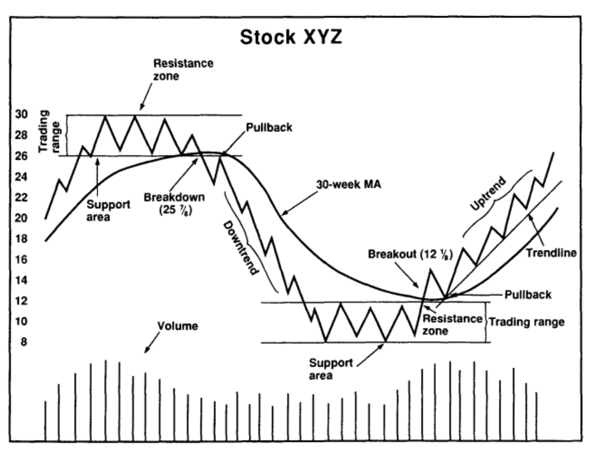
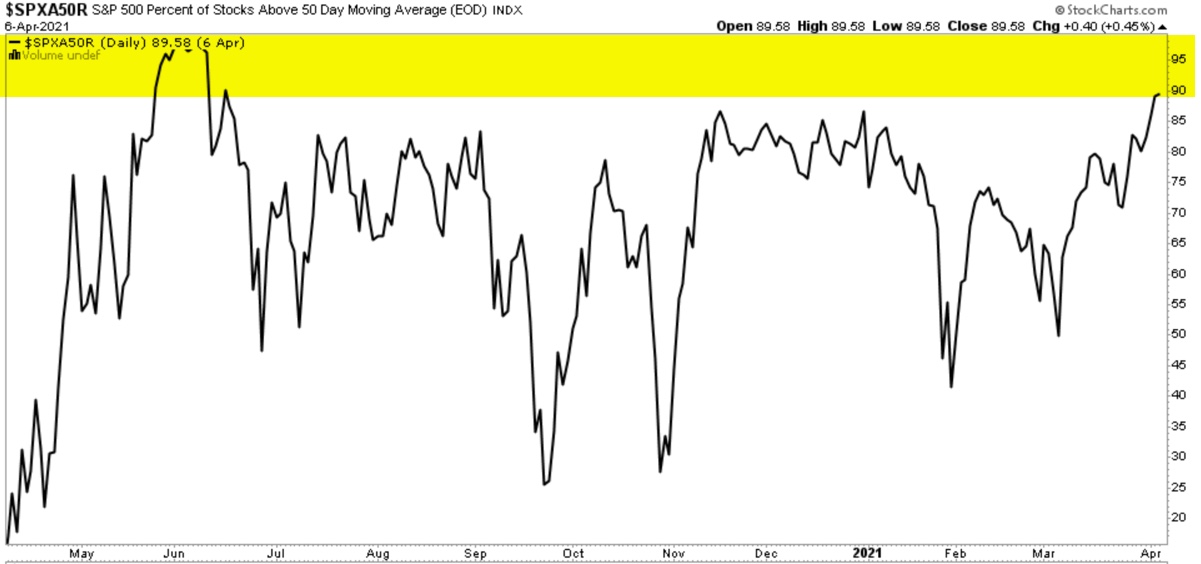
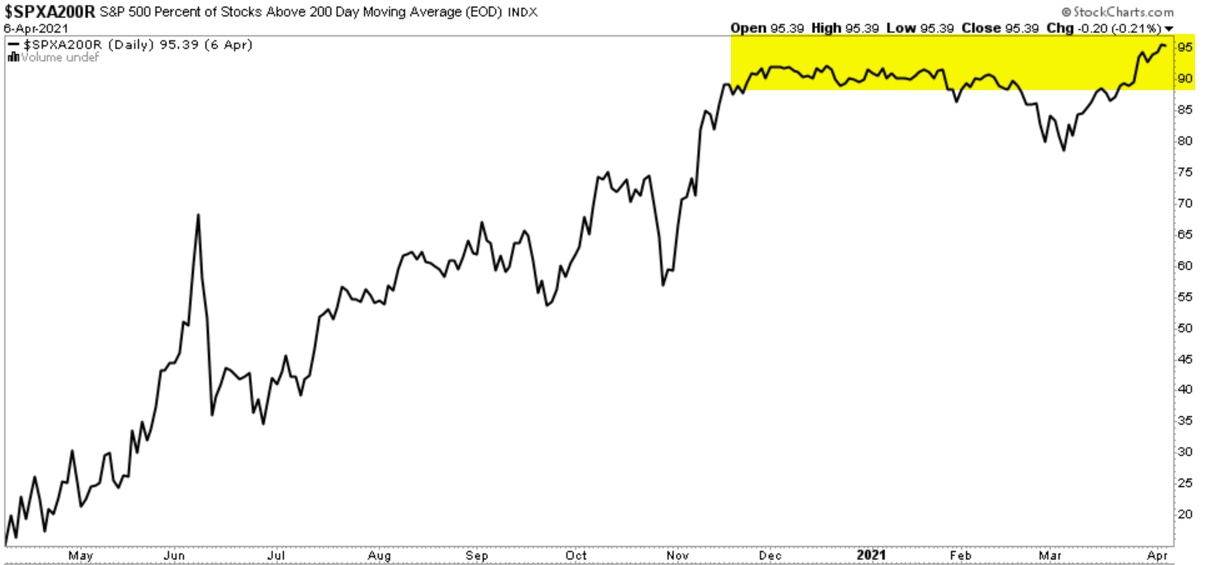
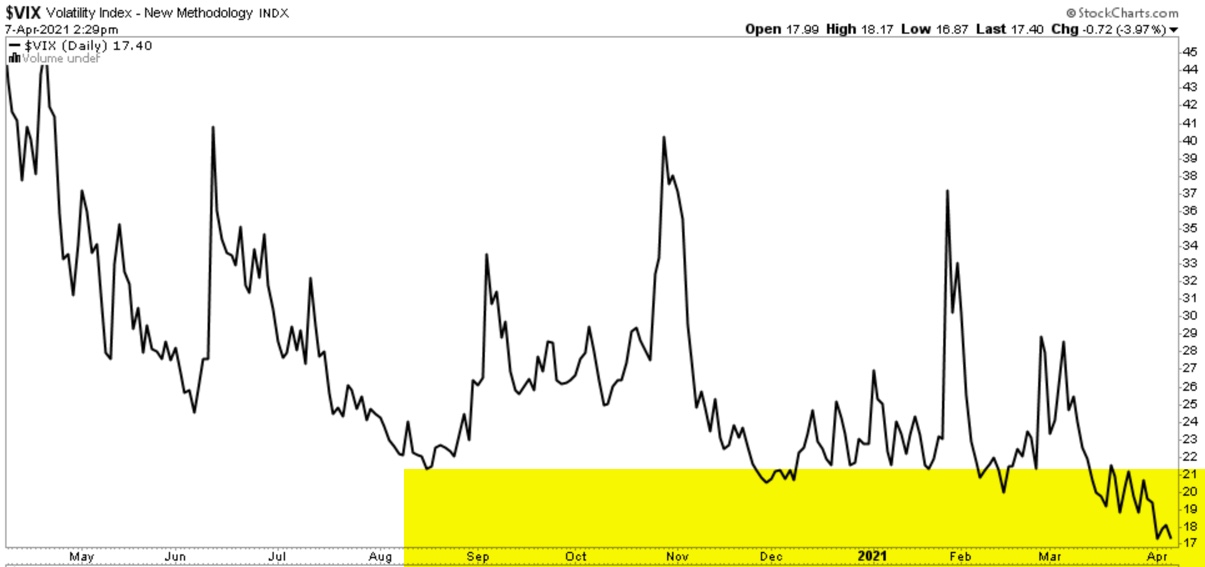
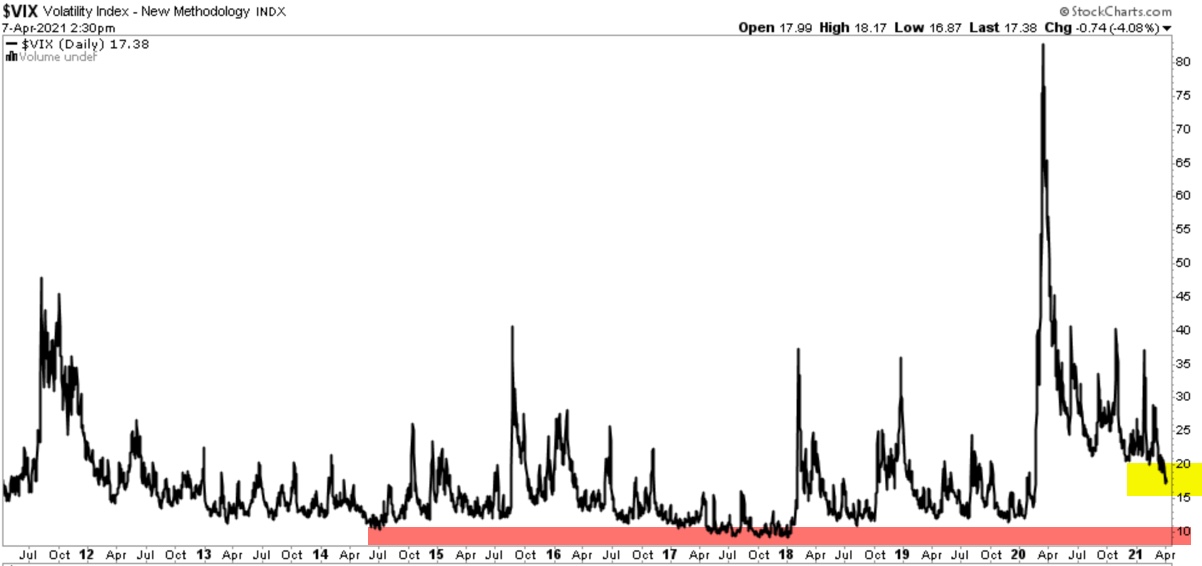
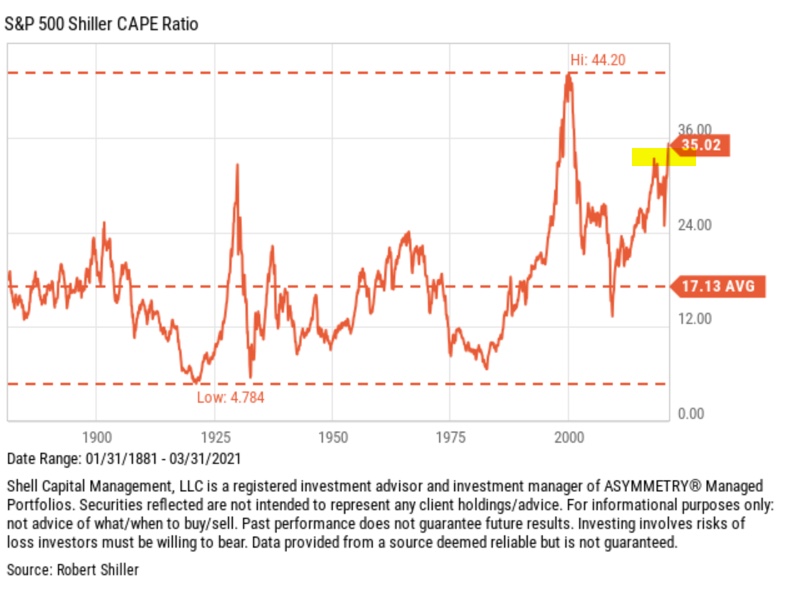
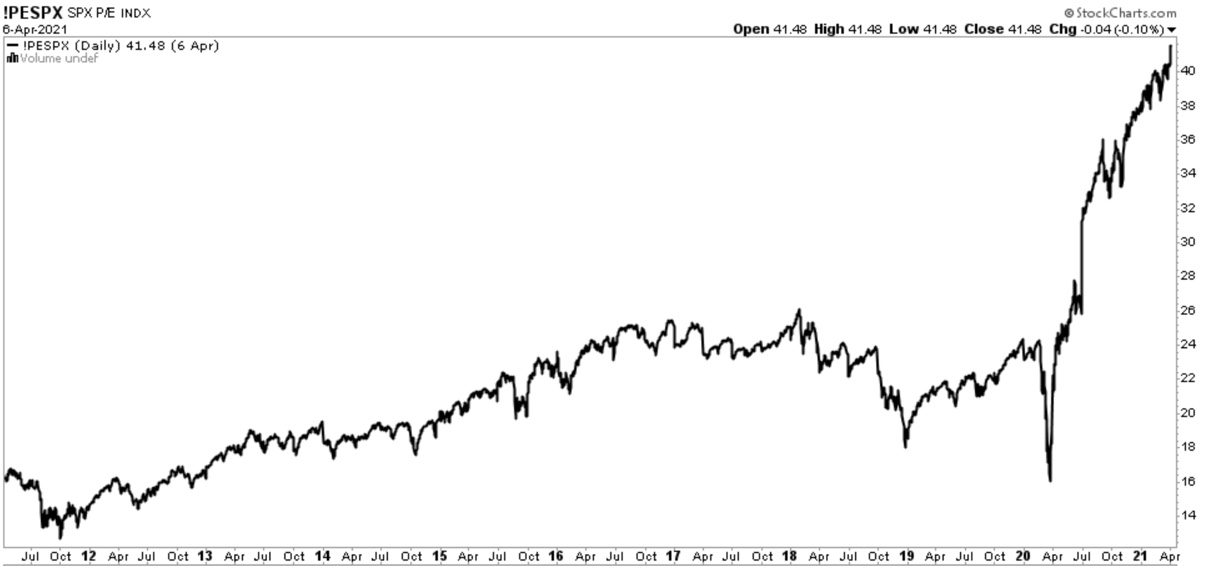
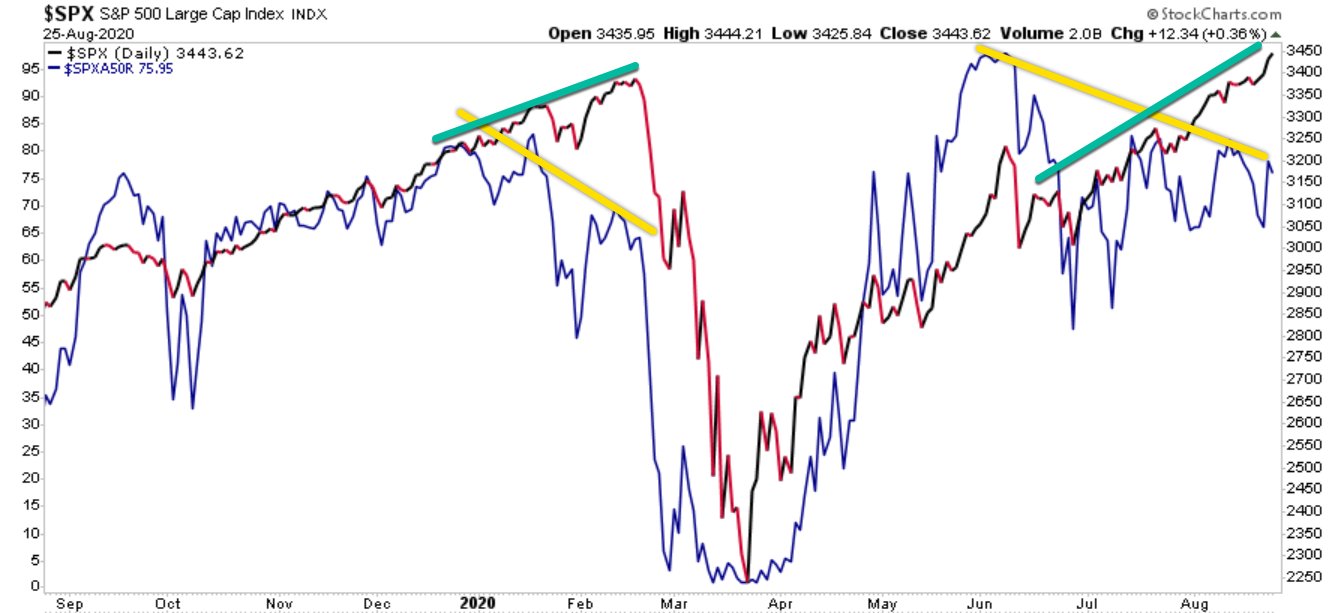
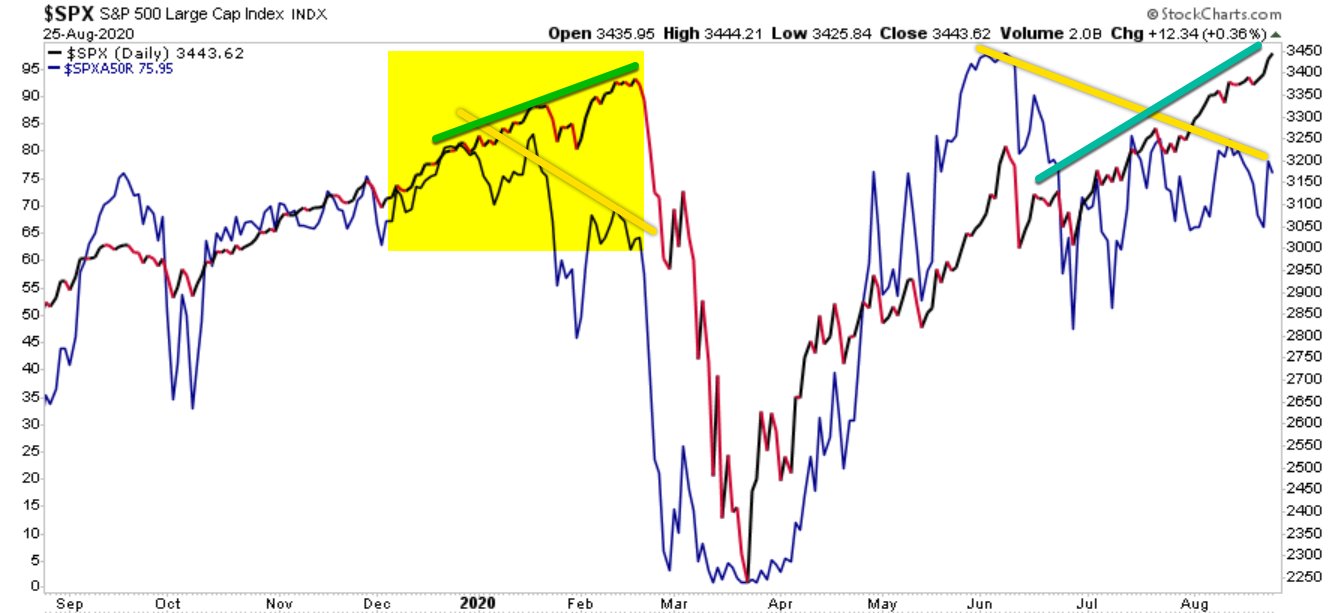
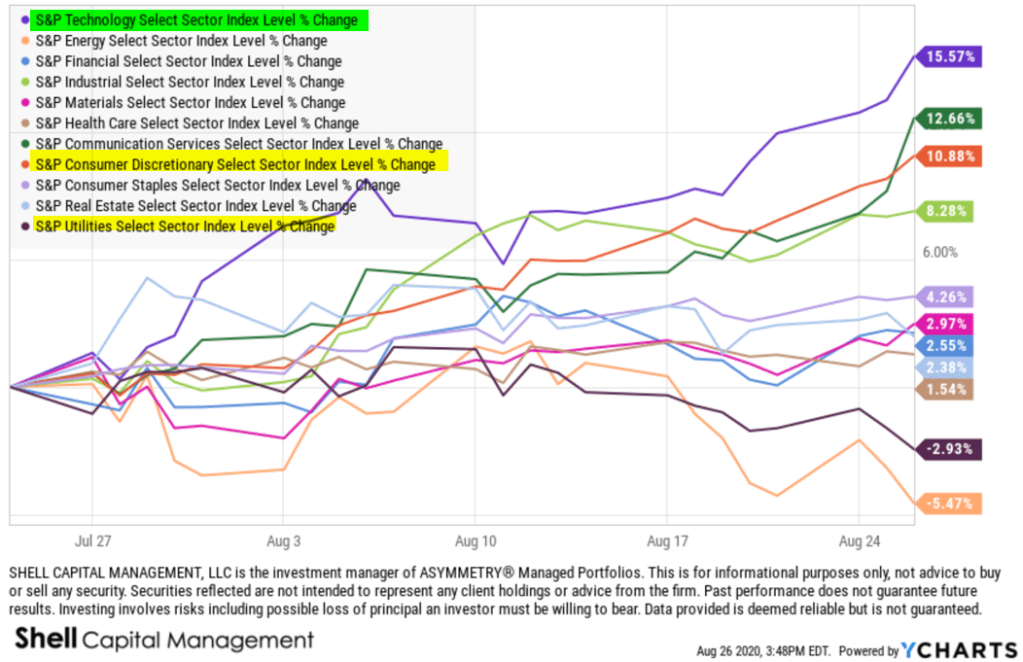
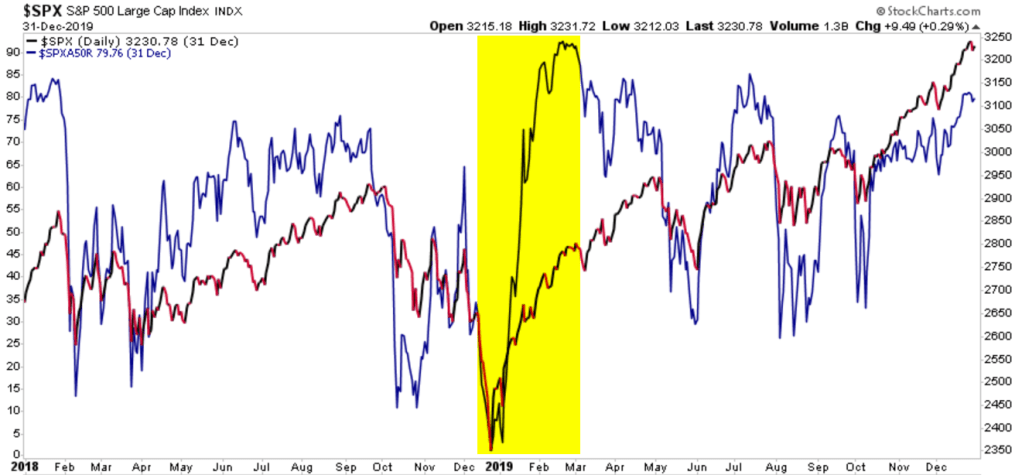

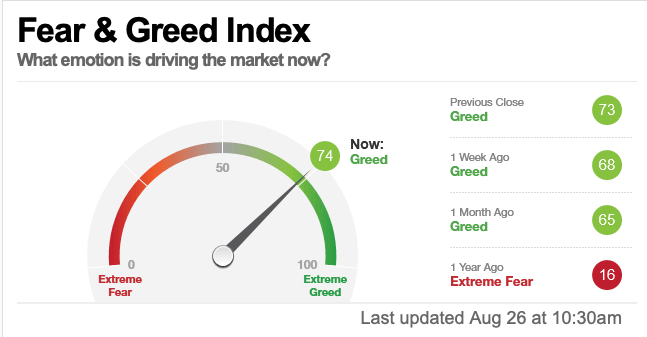
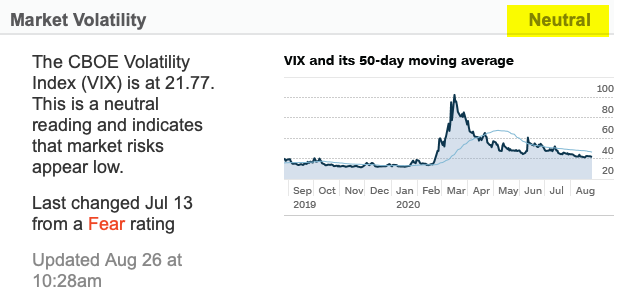
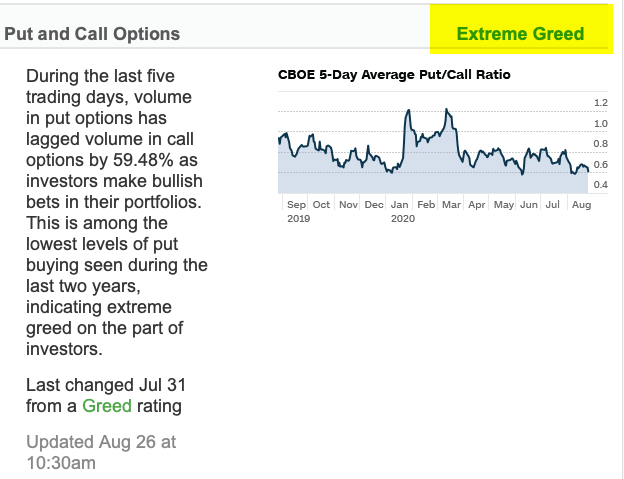
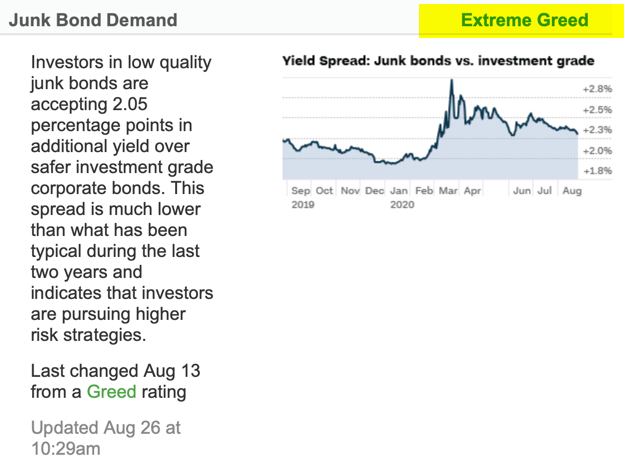
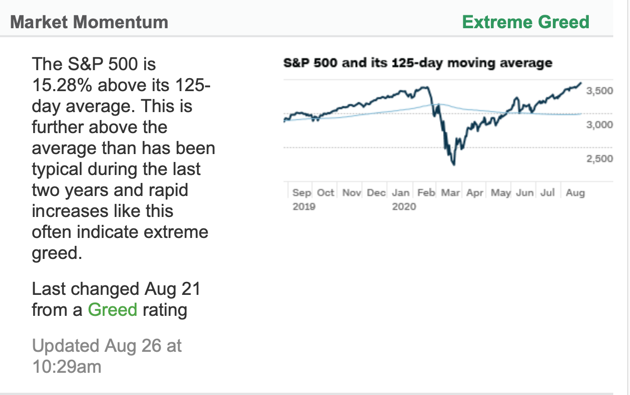
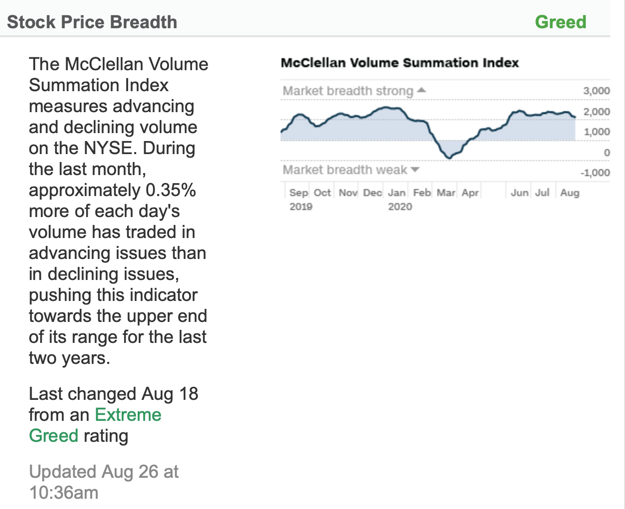
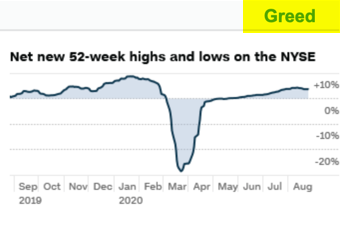
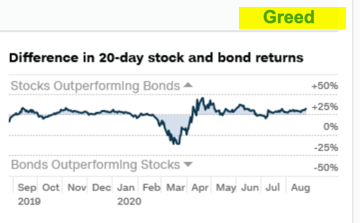
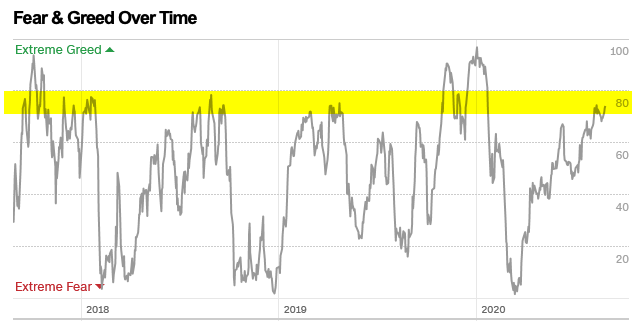
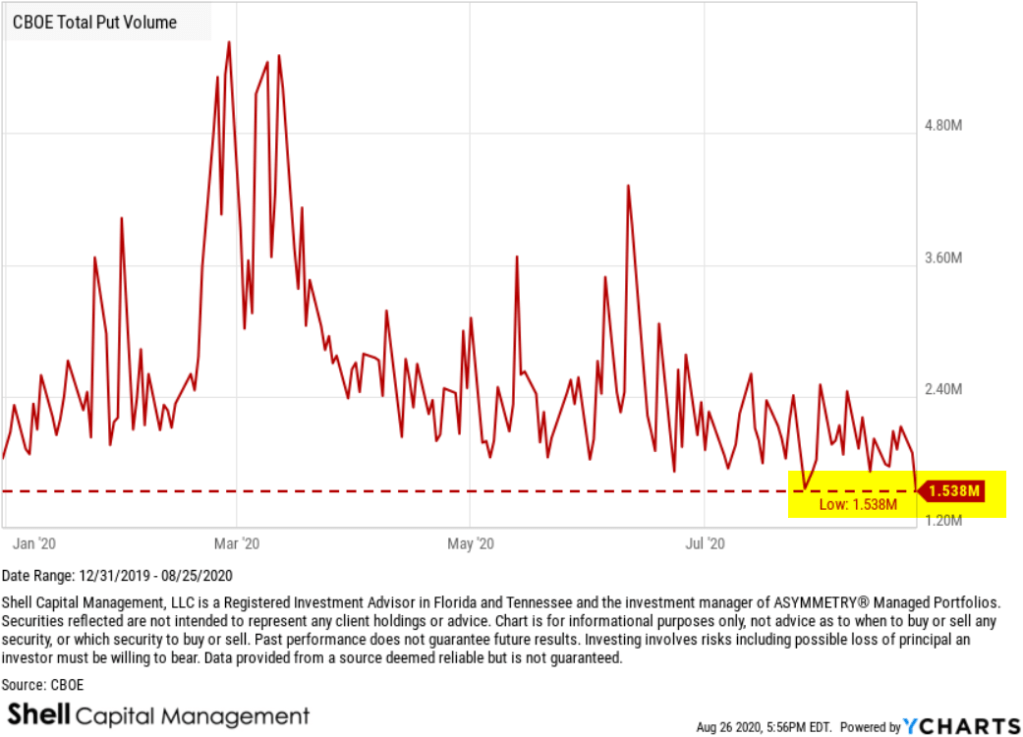

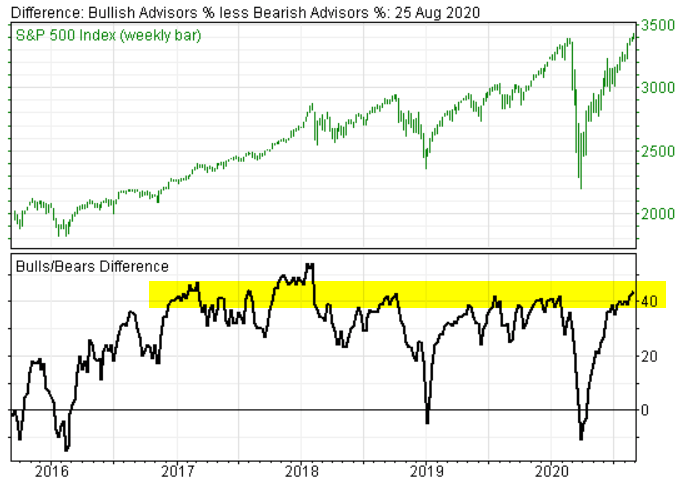
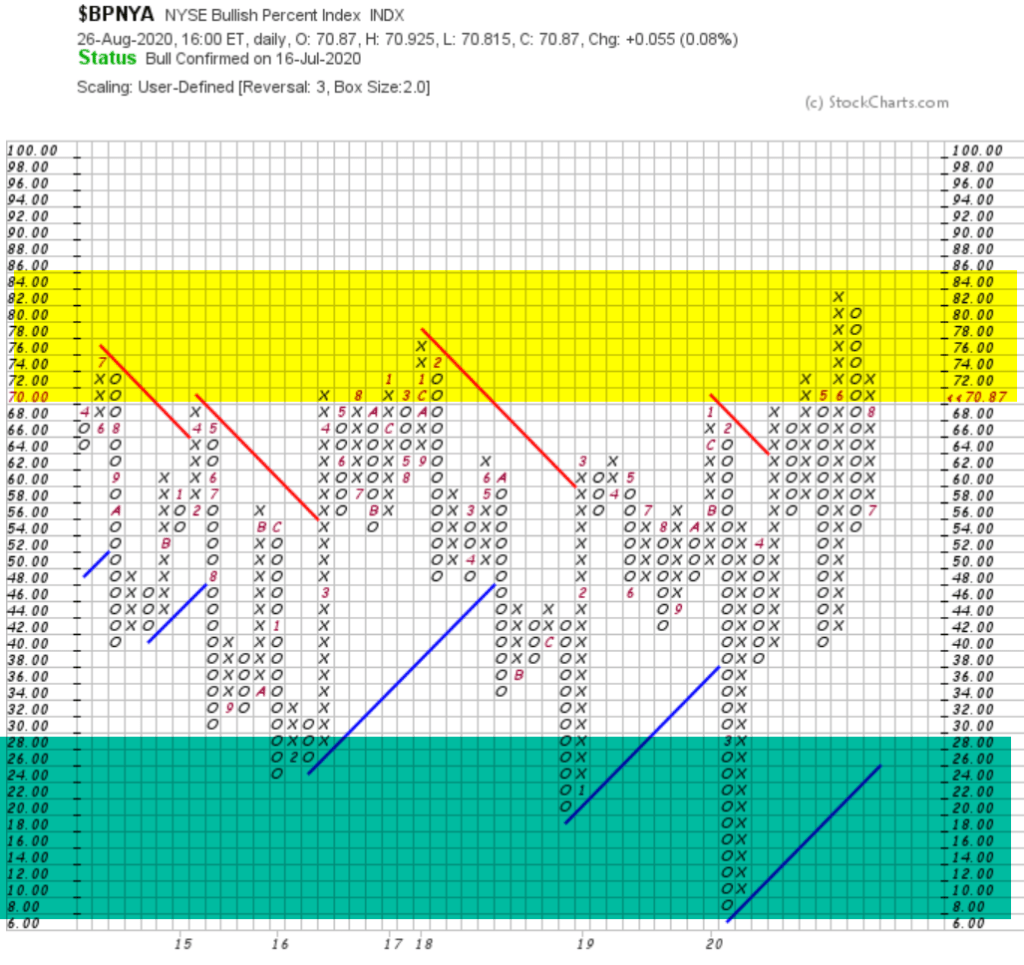
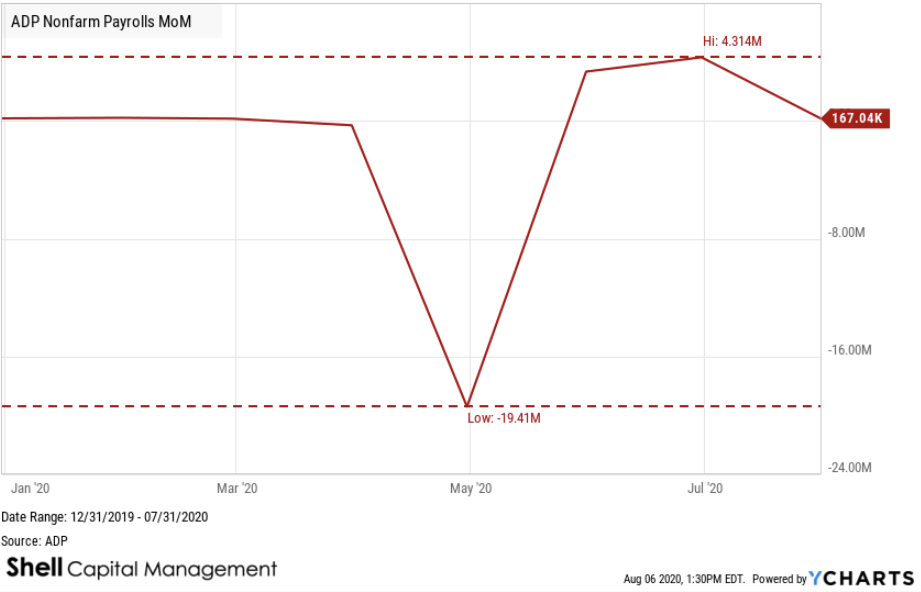
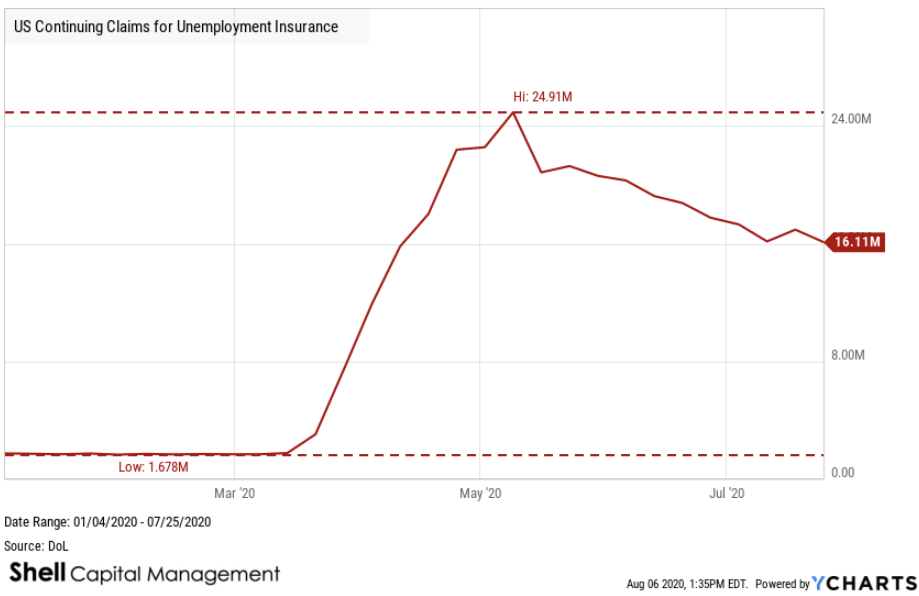
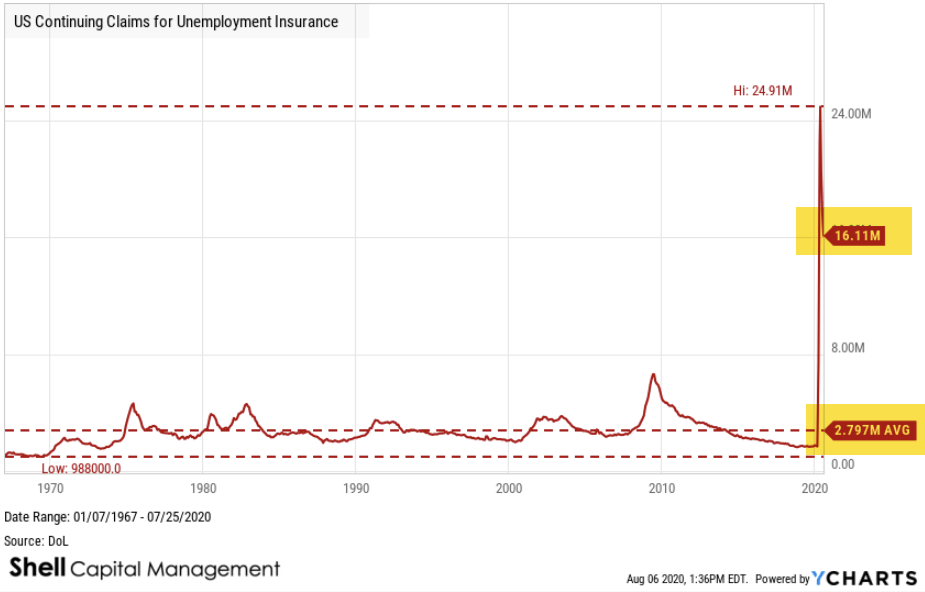
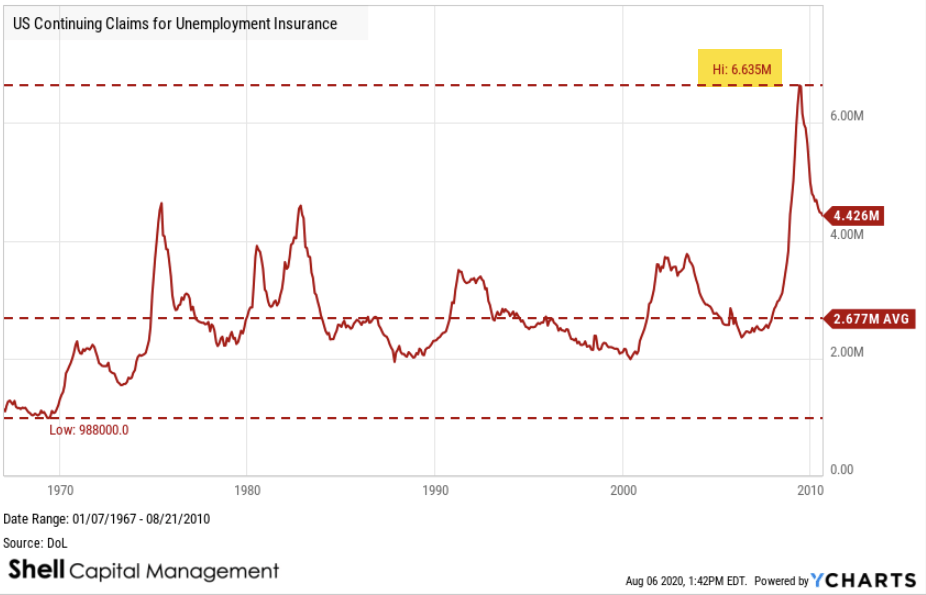
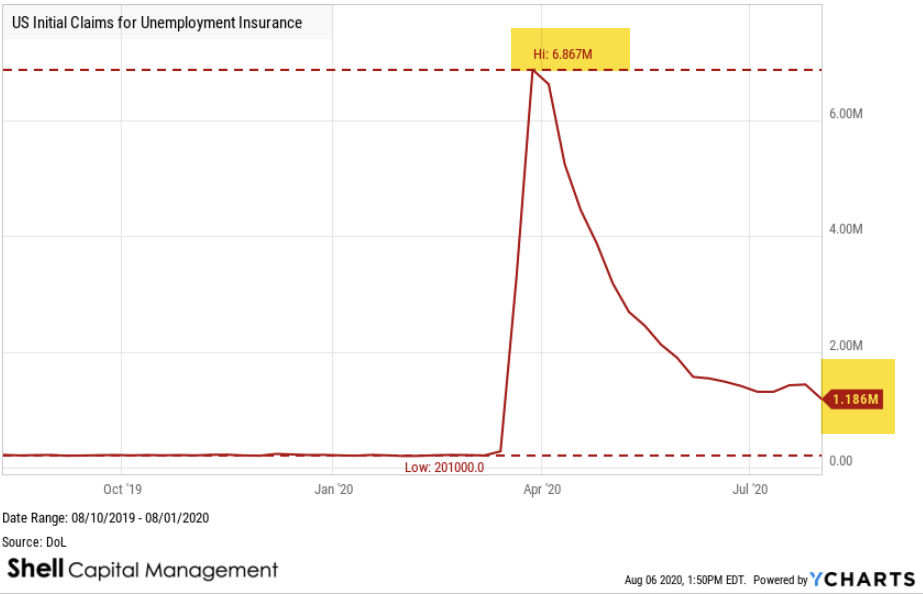
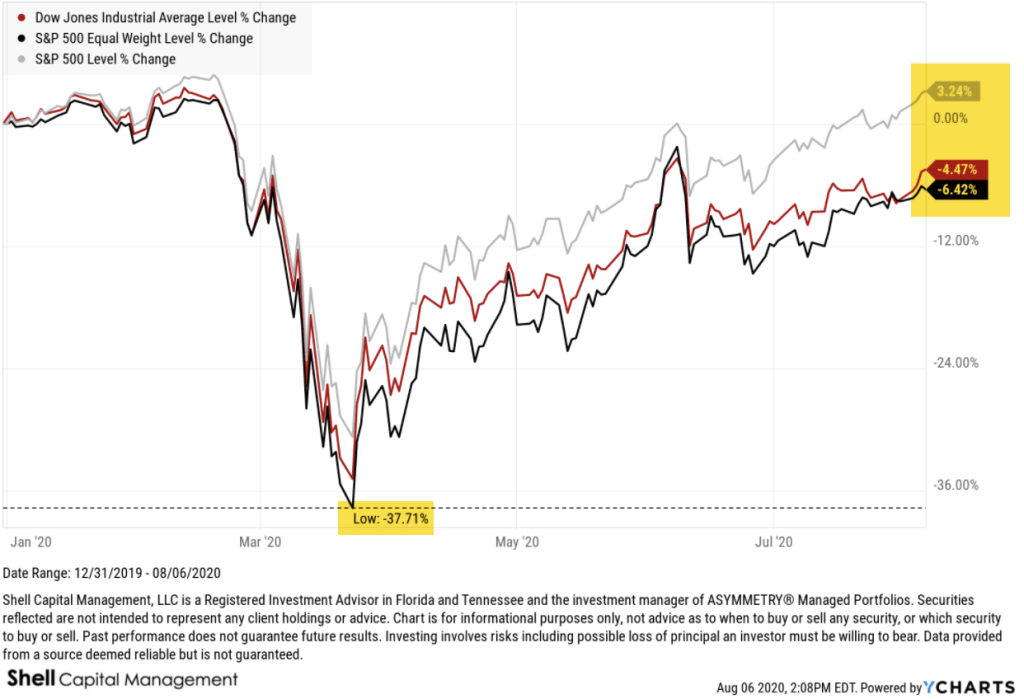
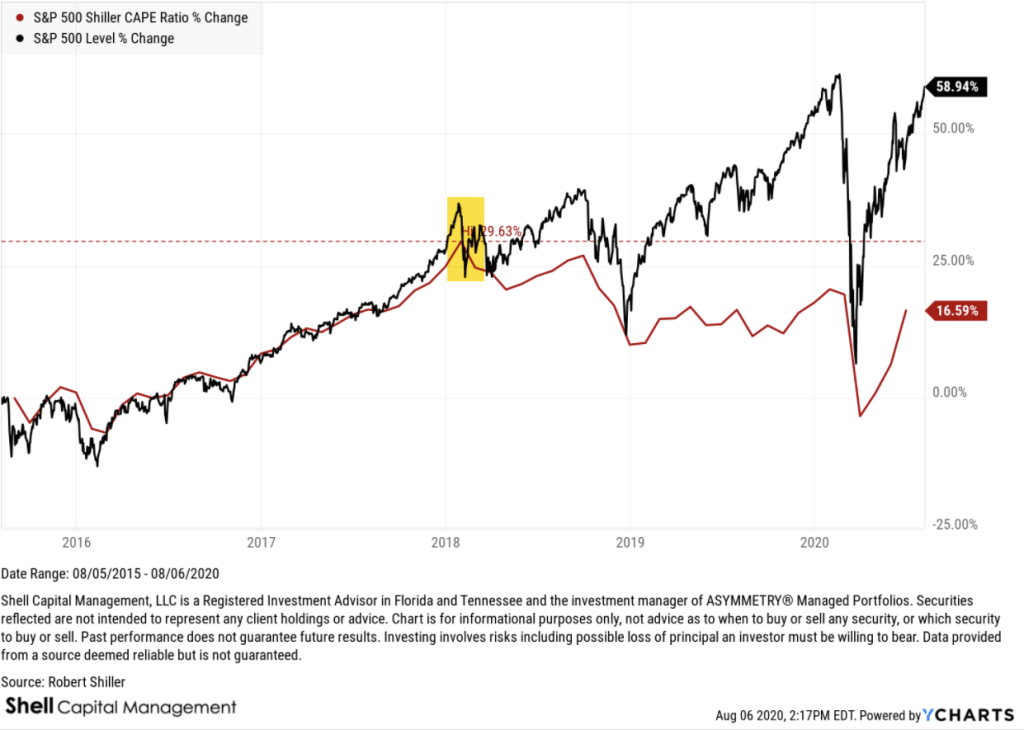
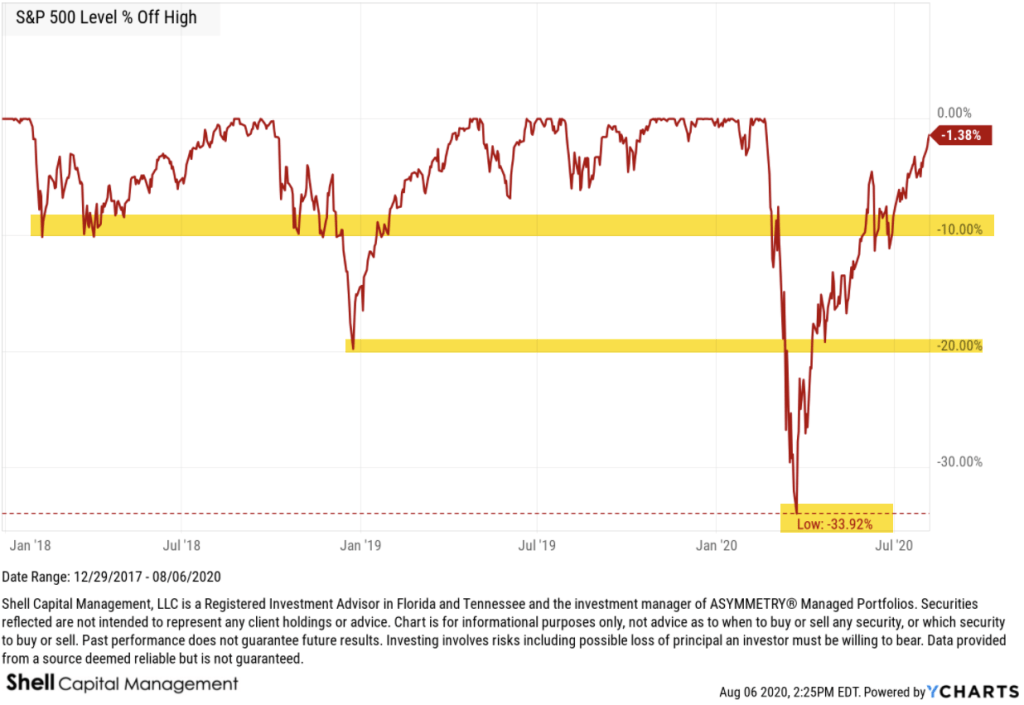
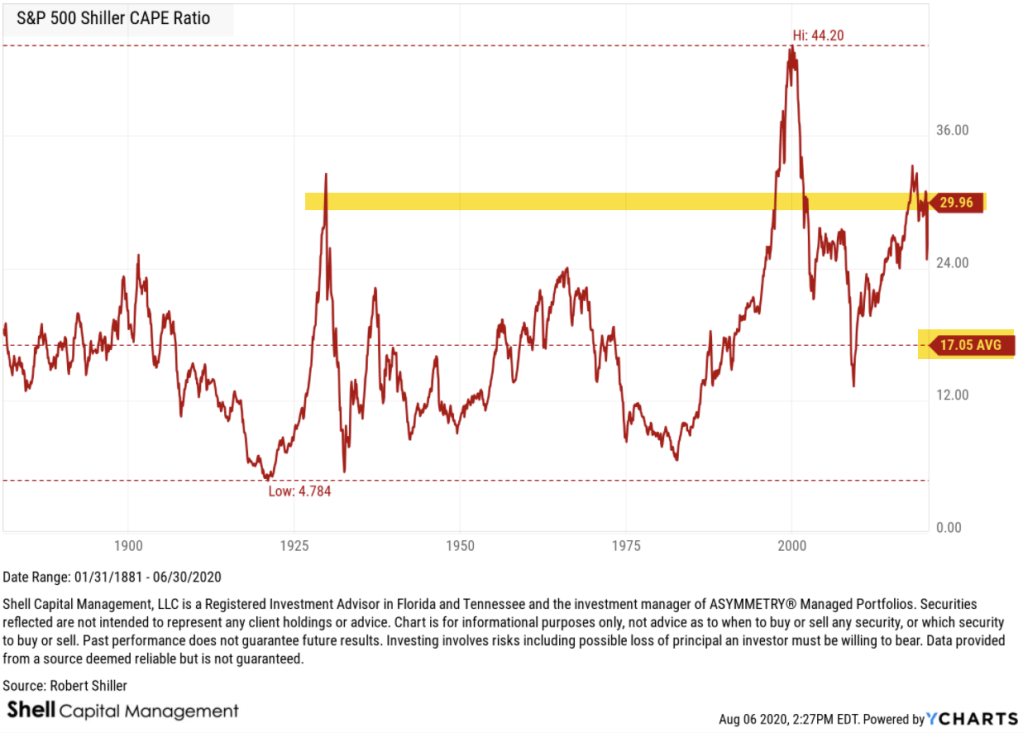
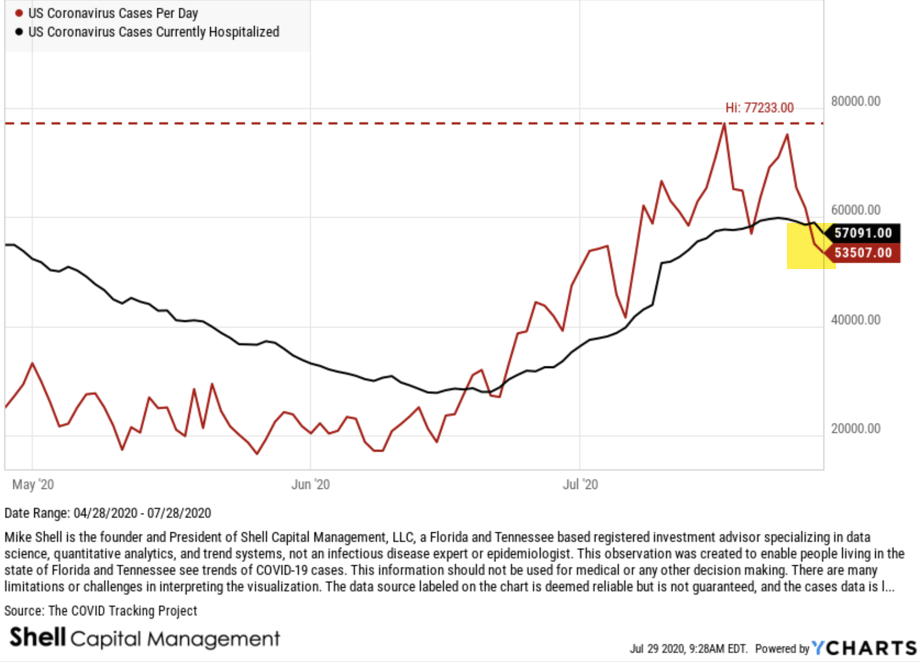

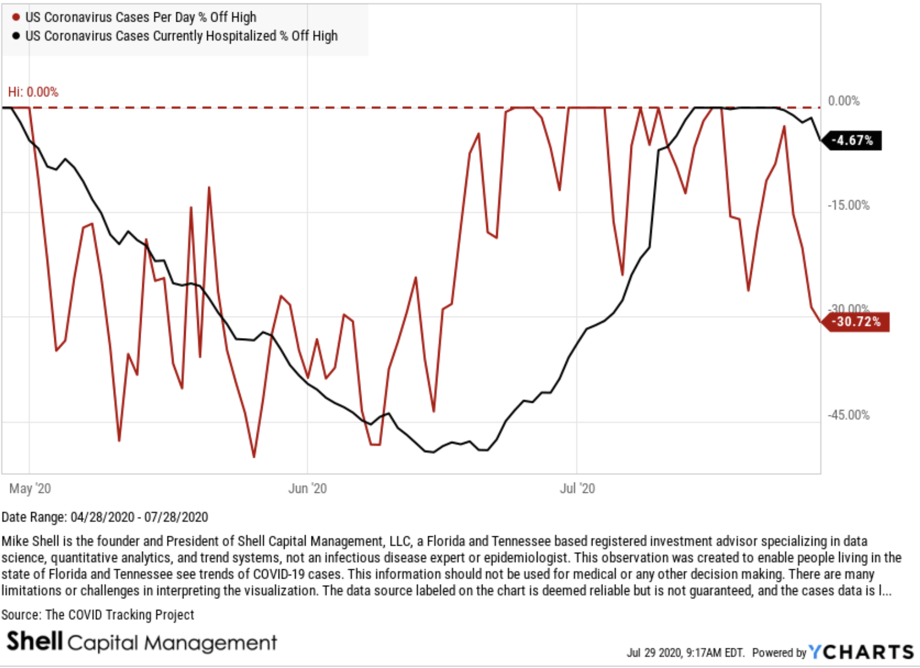
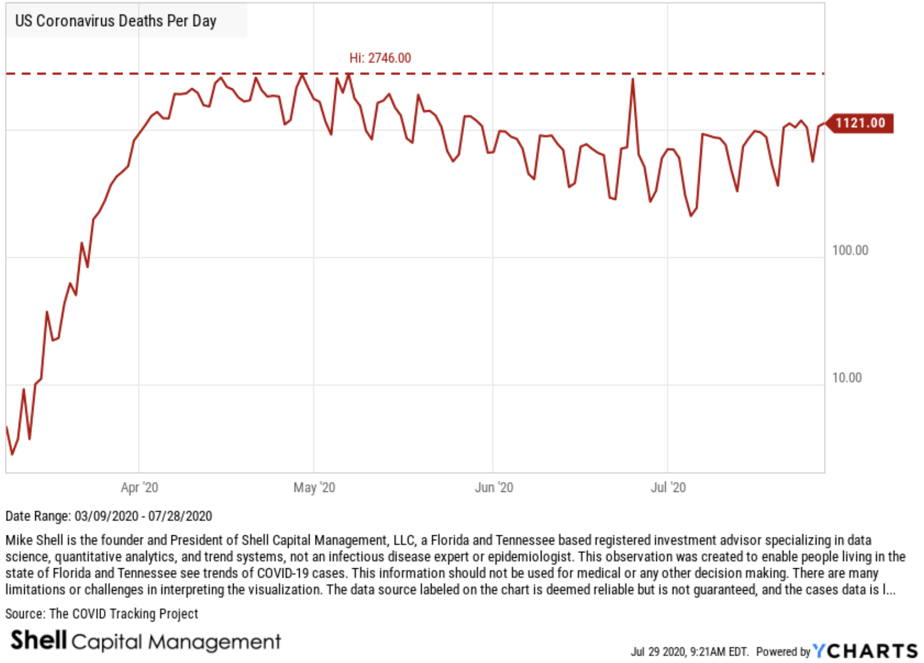
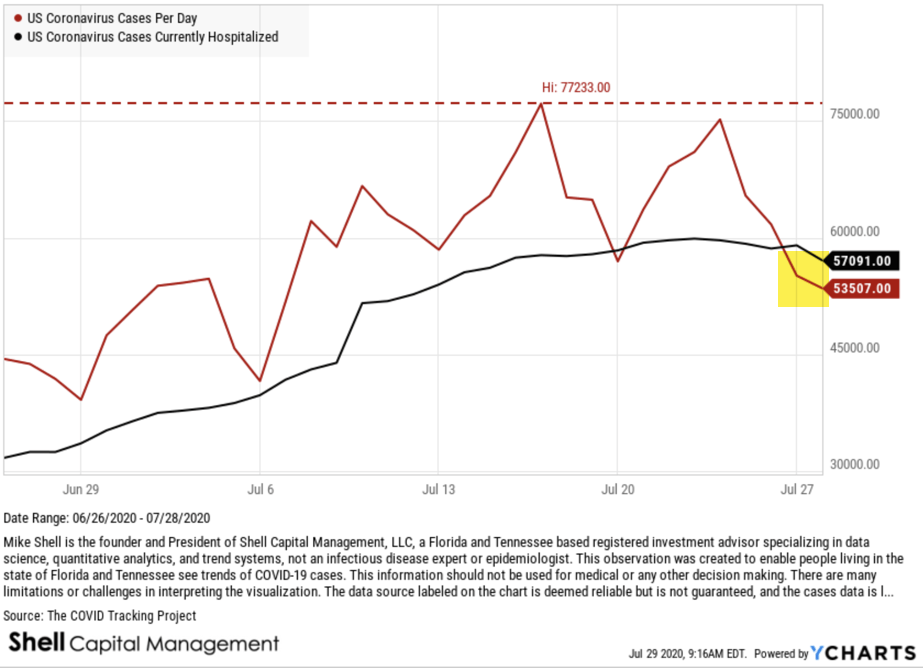
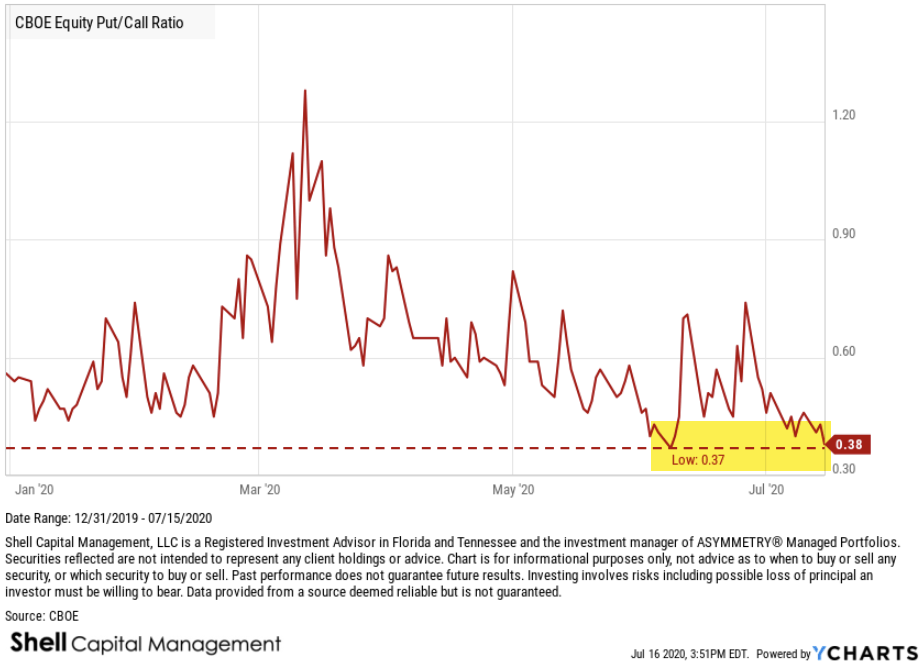
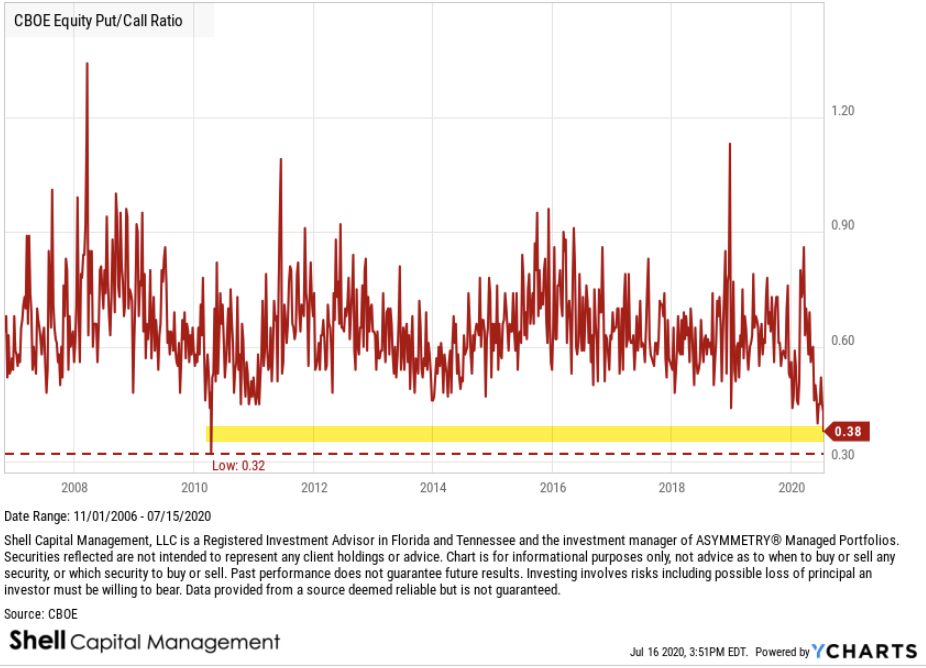
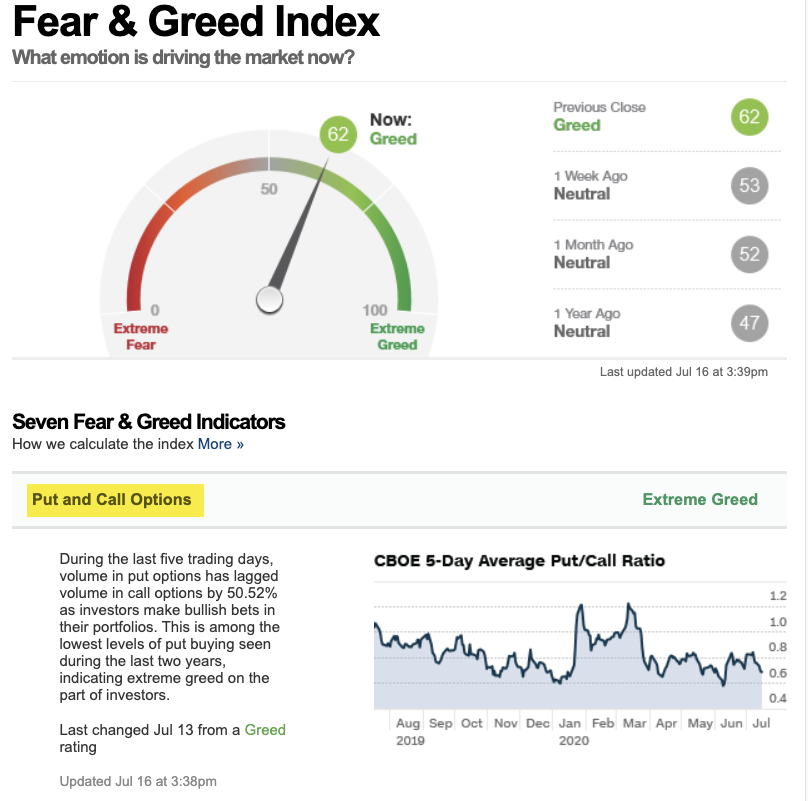
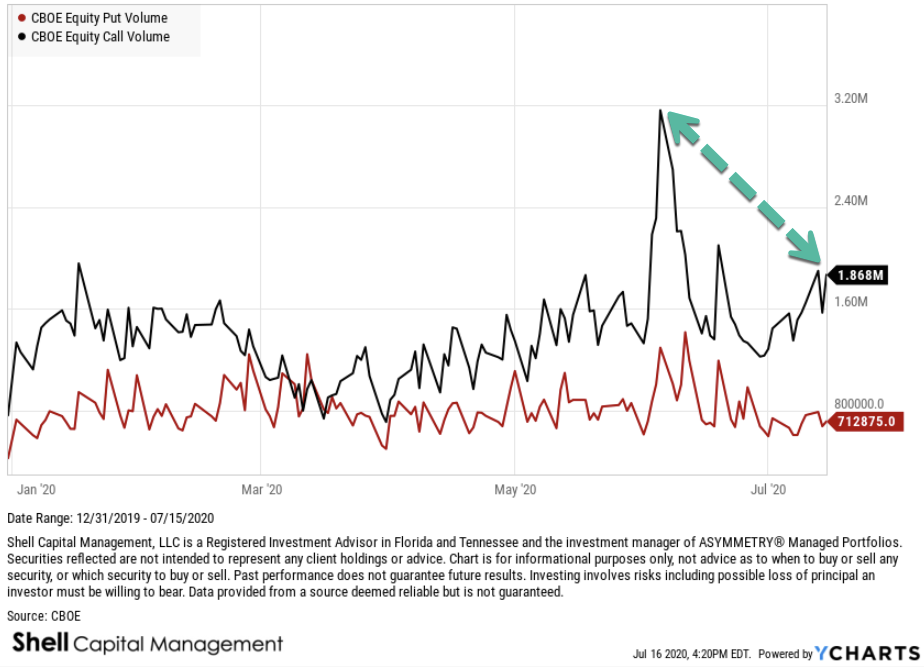
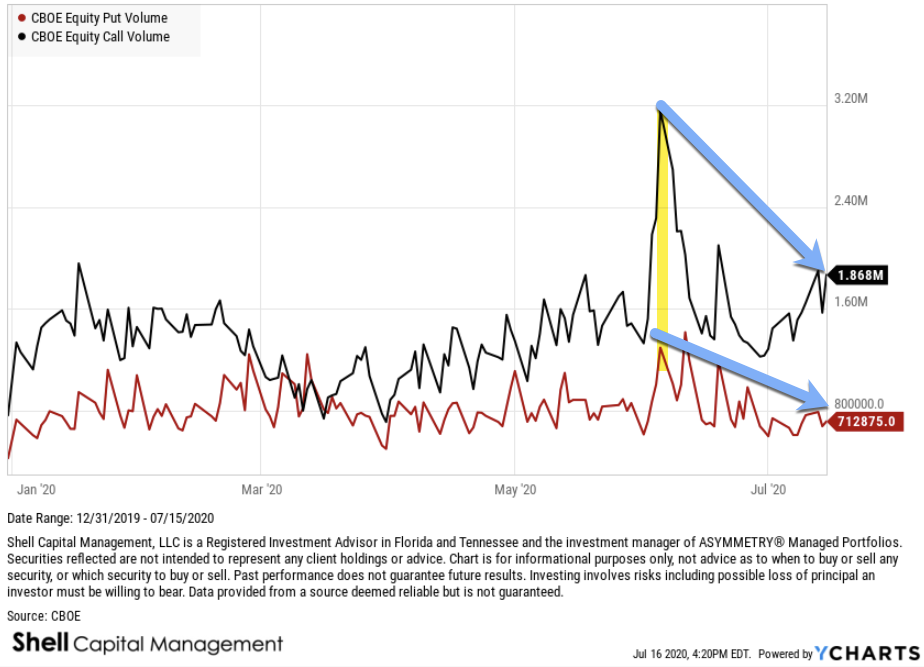
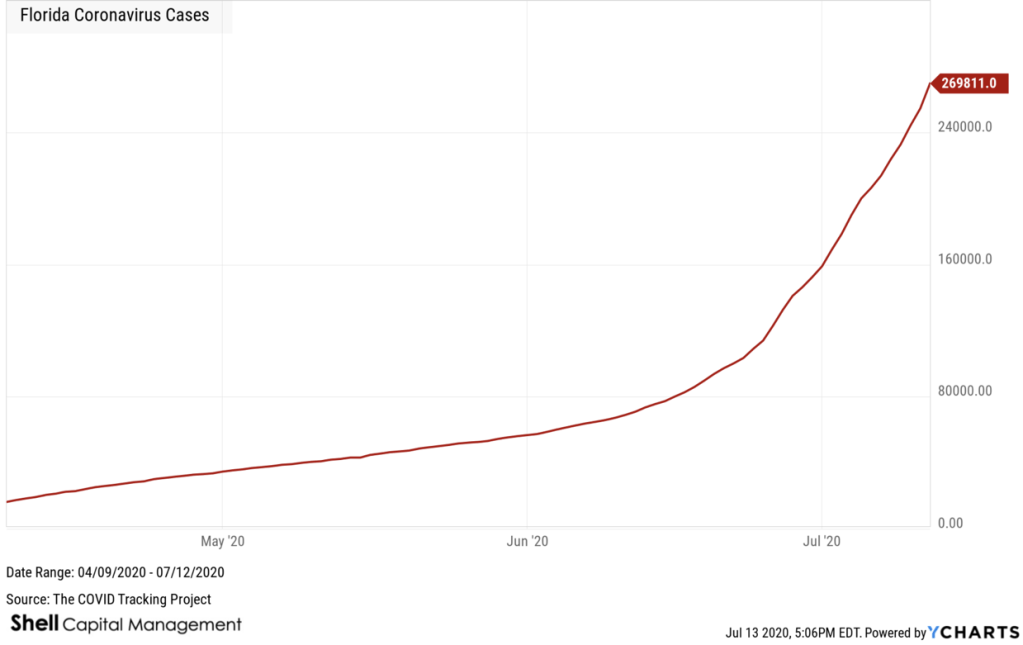
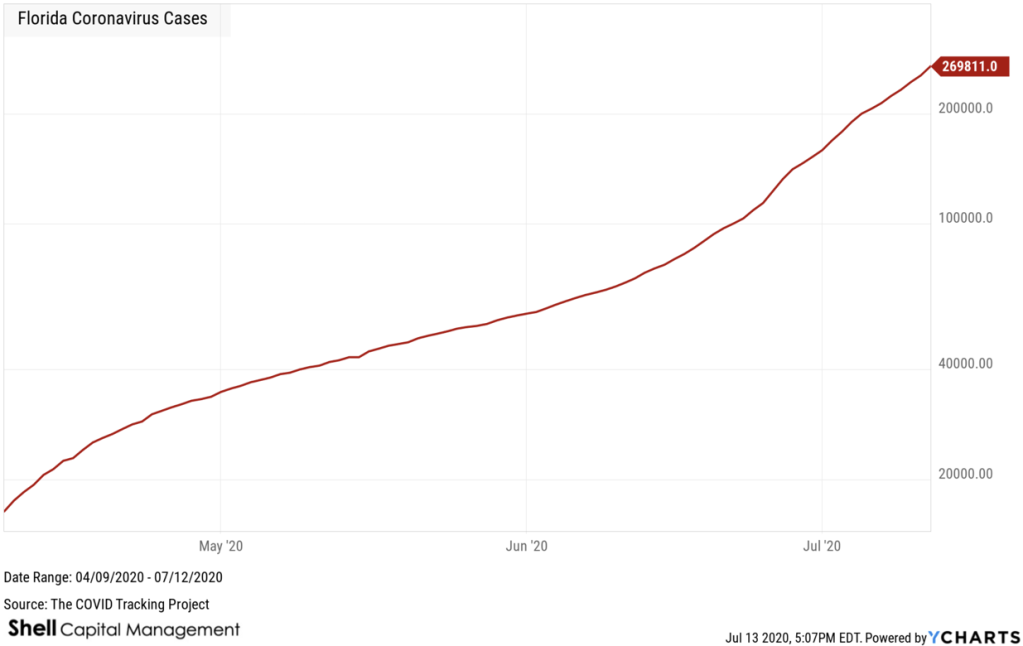
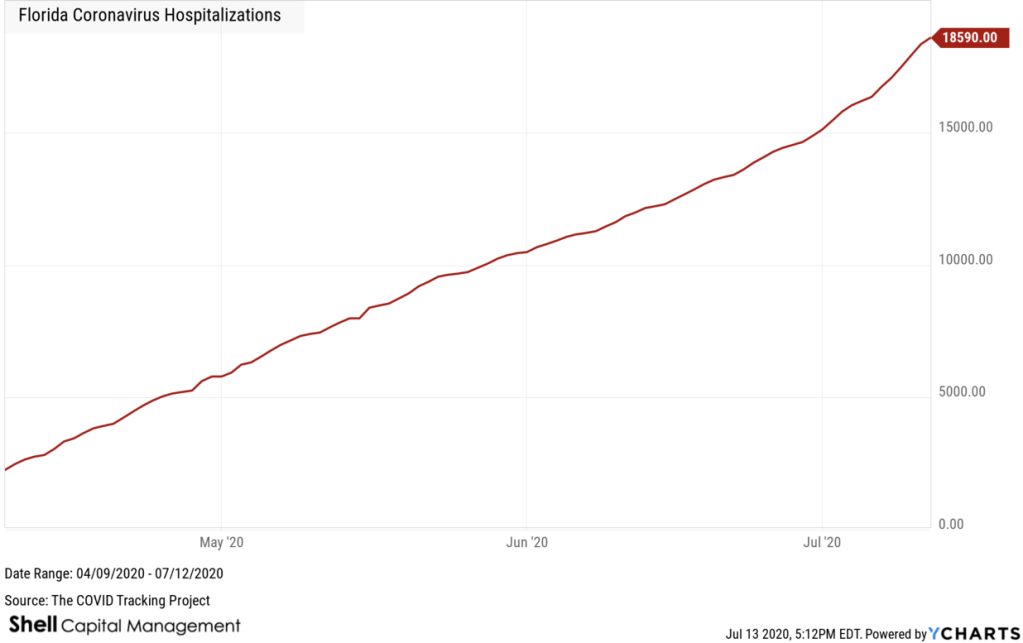
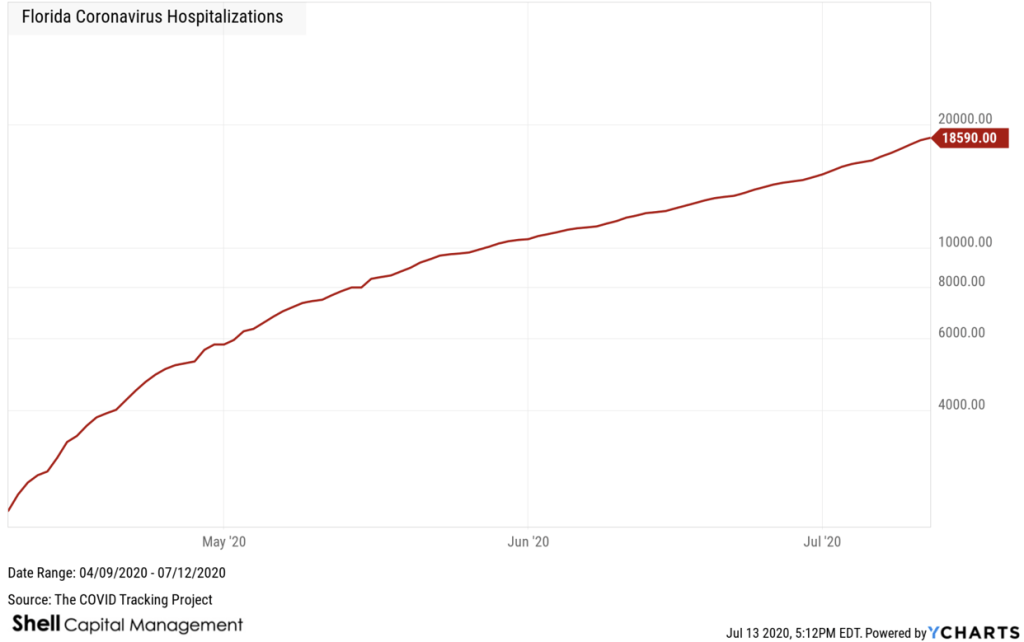
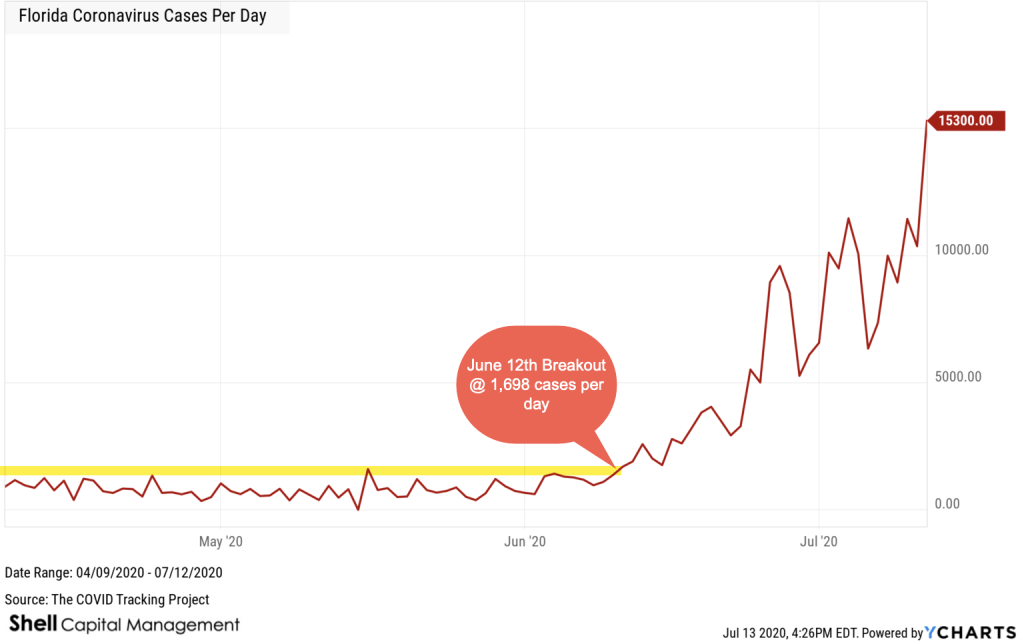
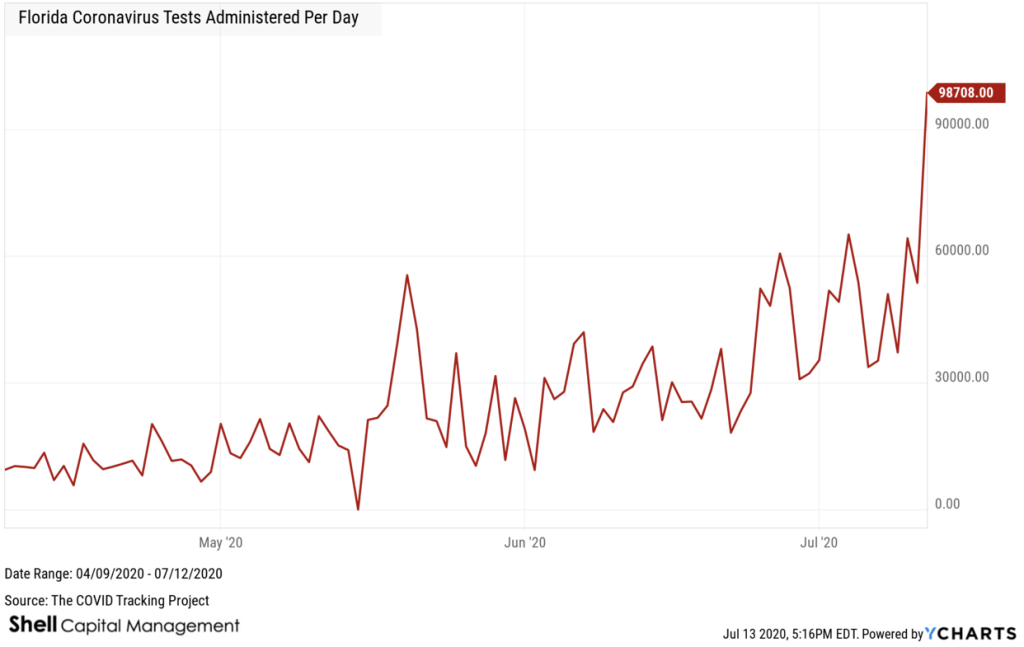
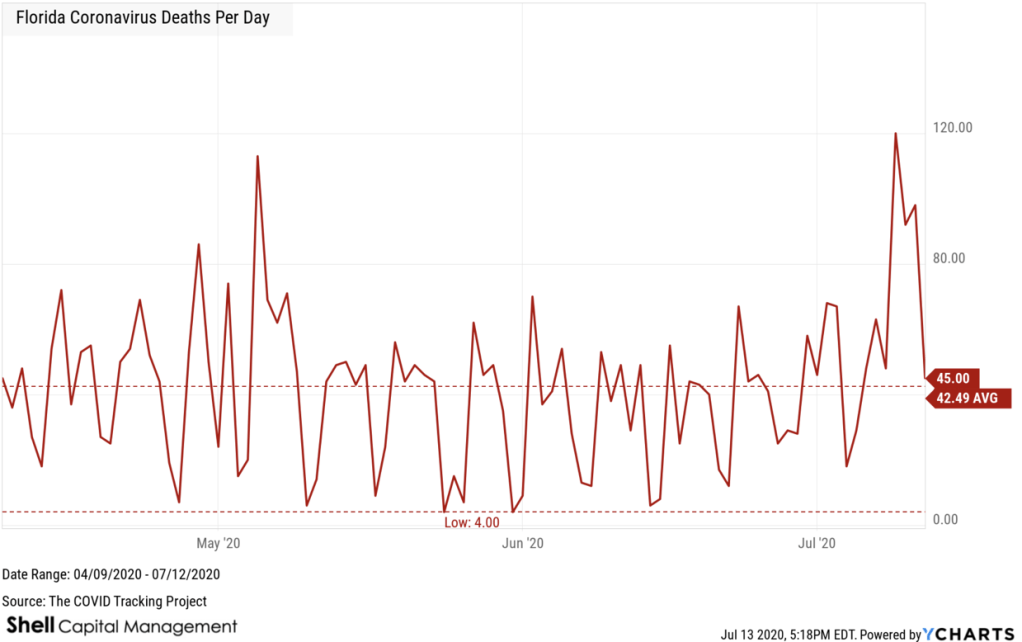
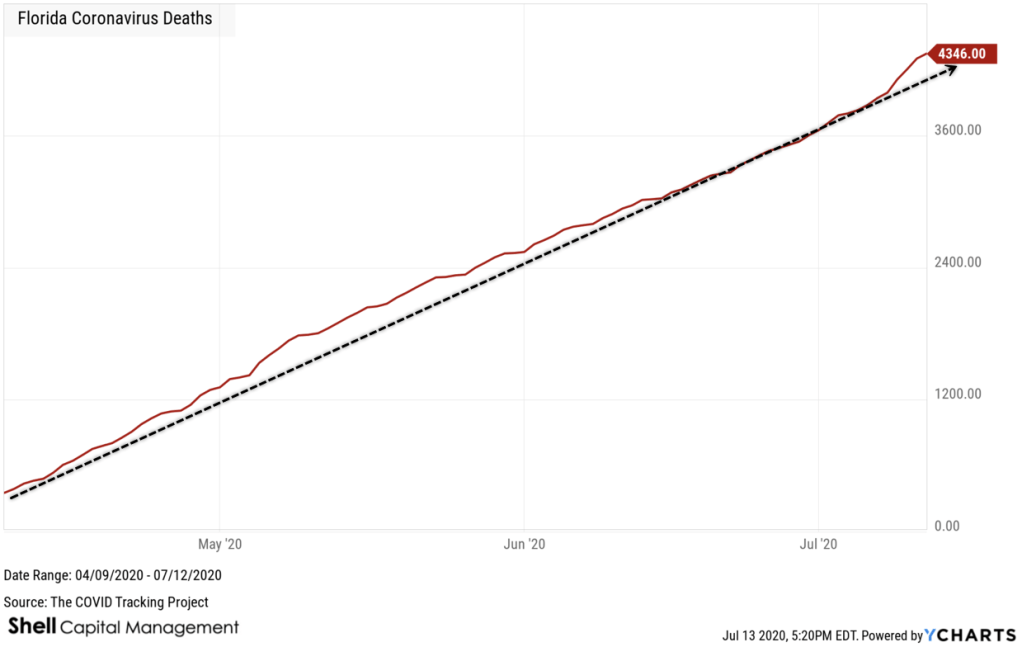
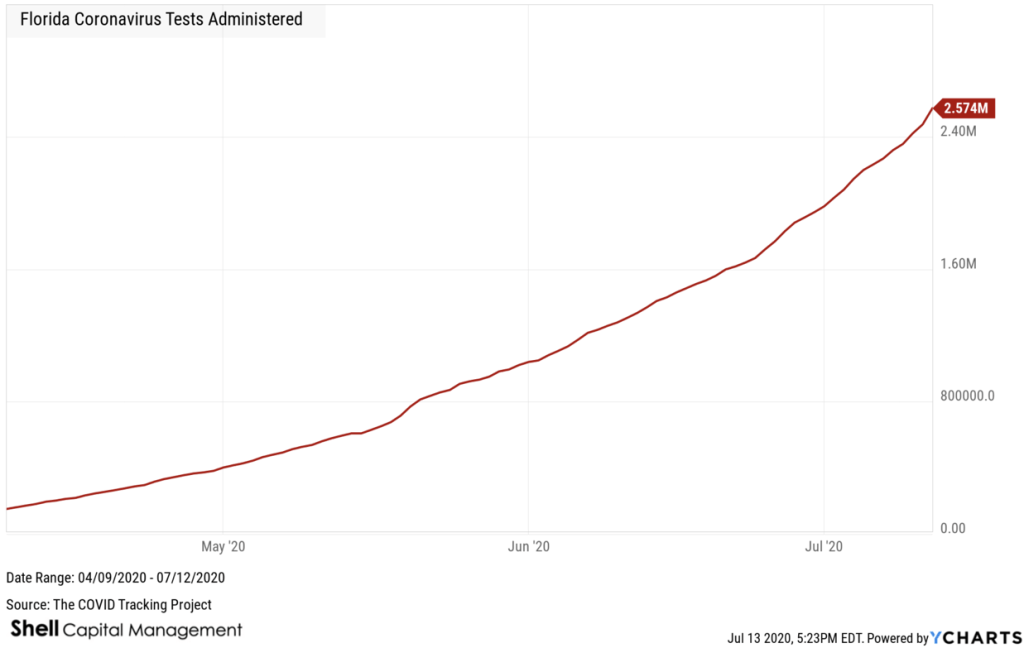
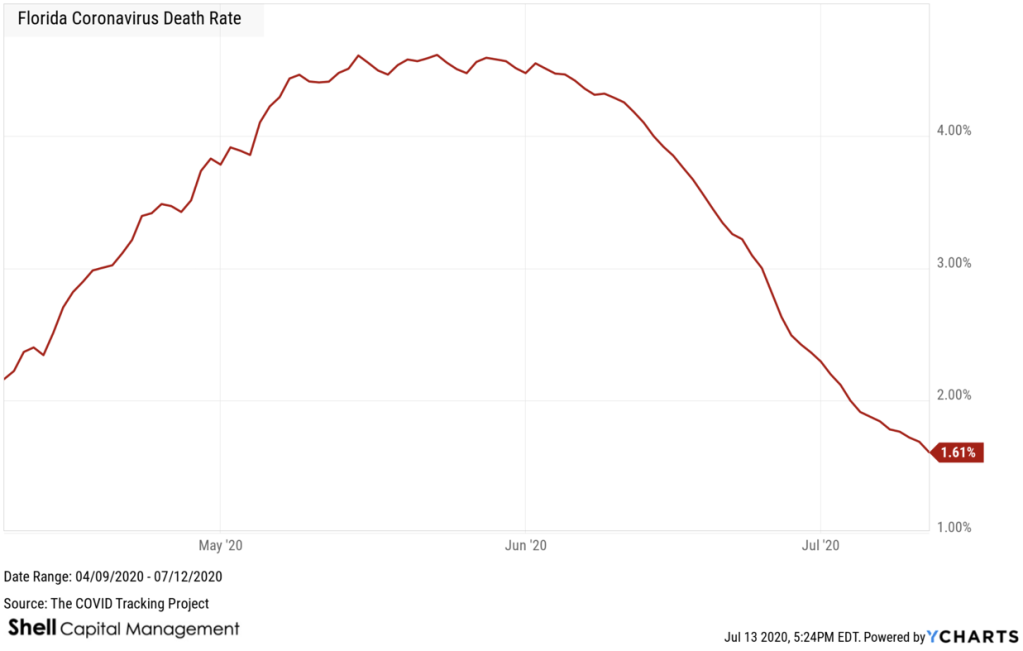
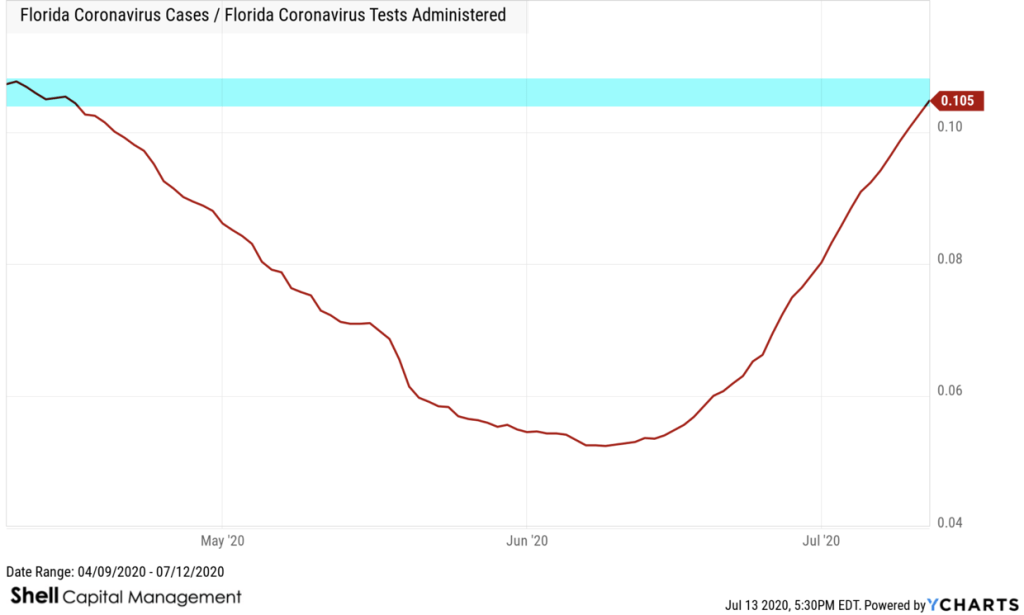
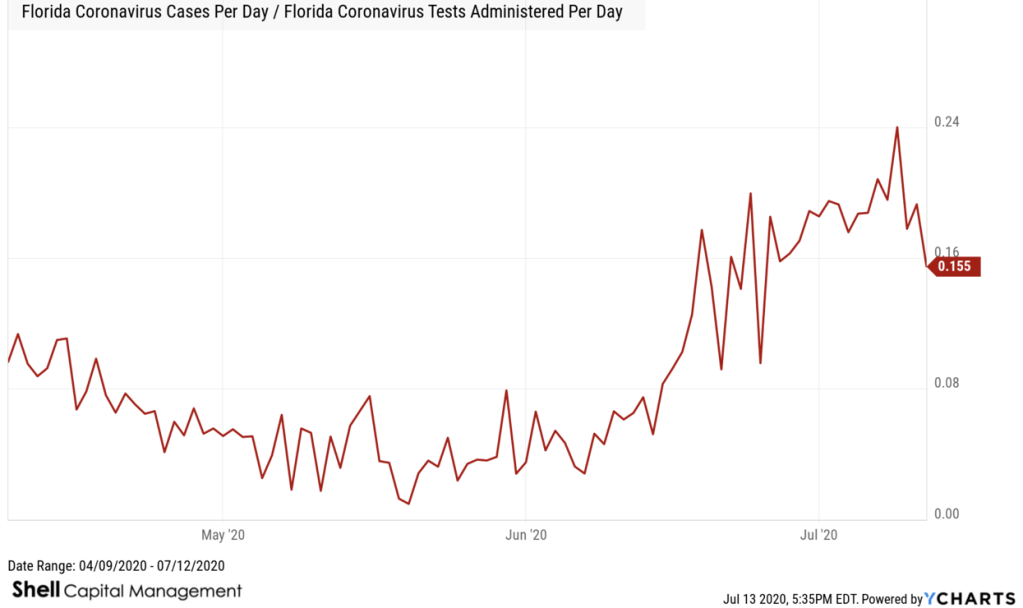
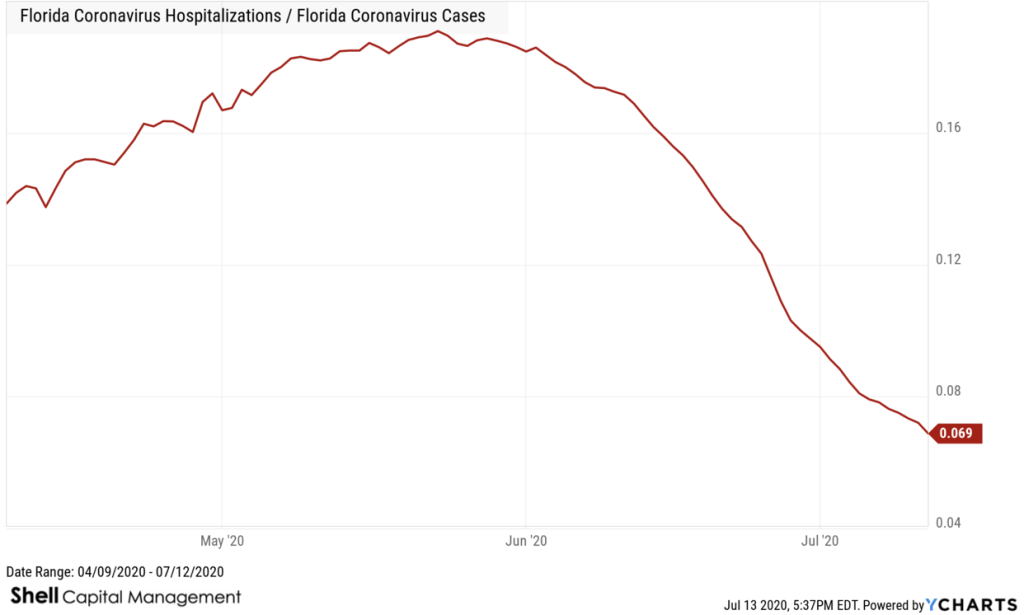
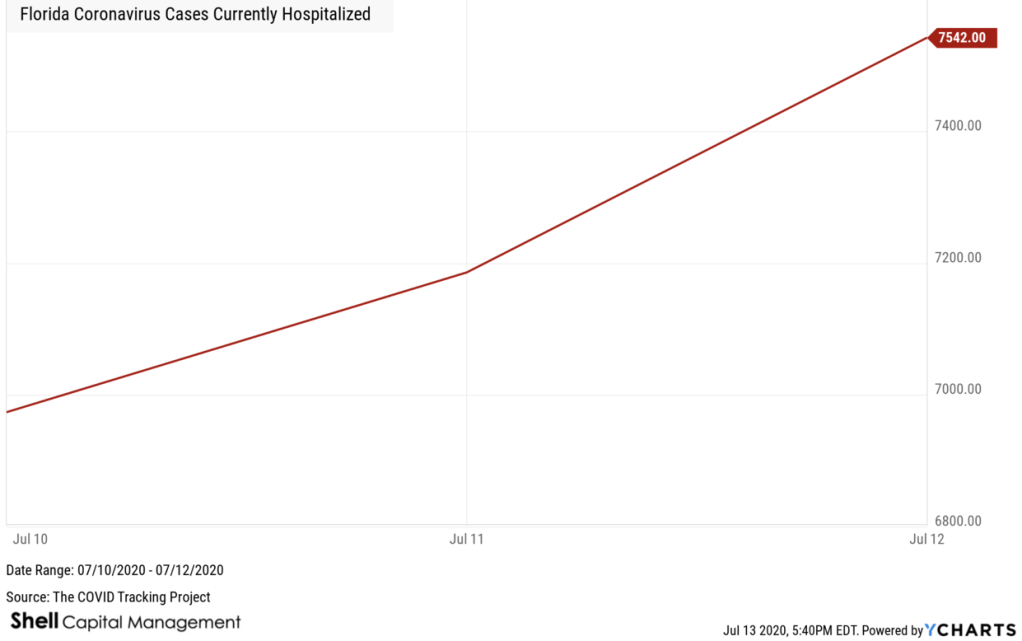
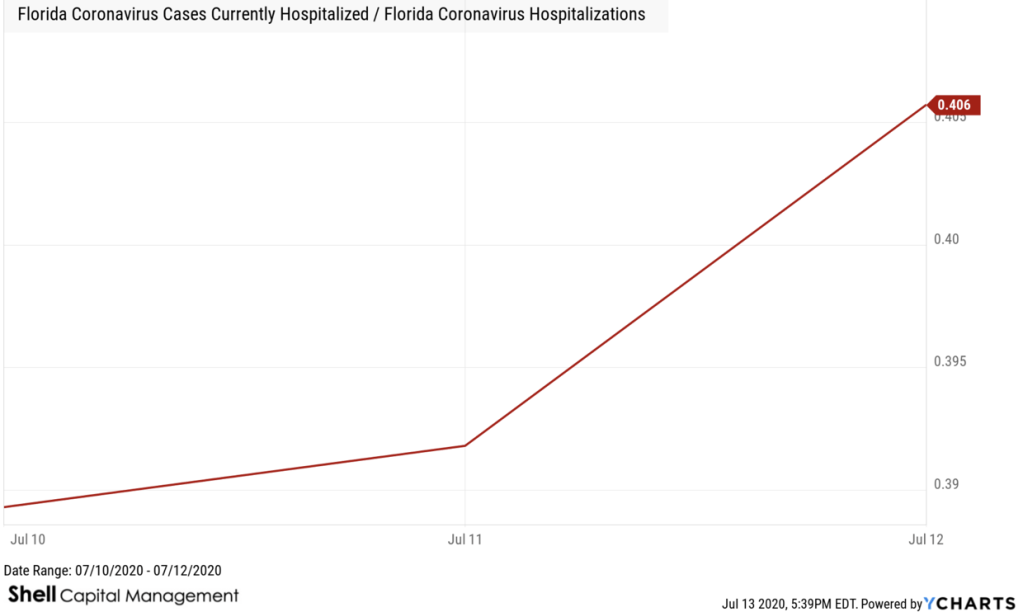
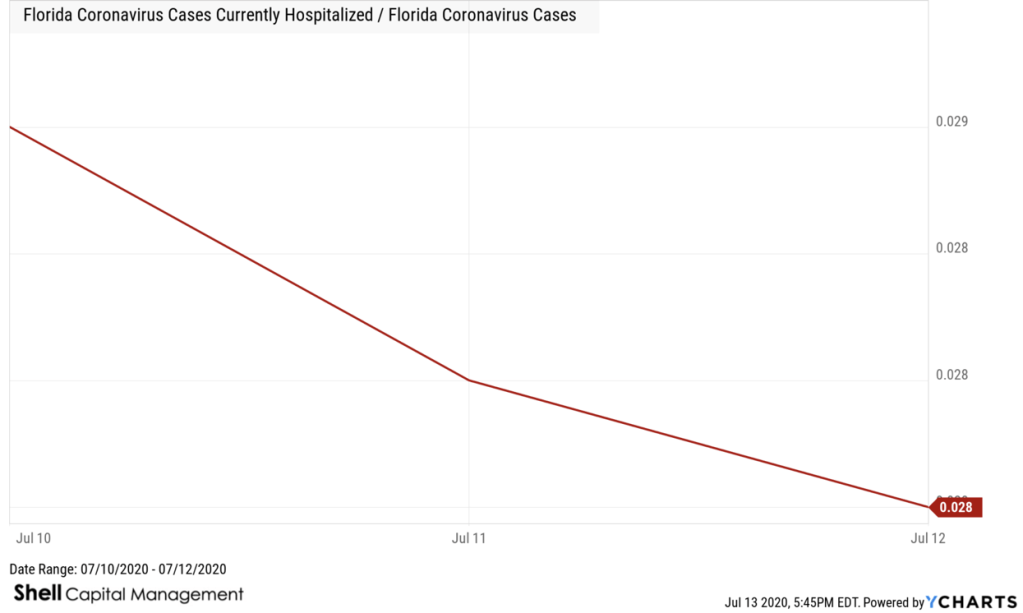

You must be logged in to post a comment.