The S&P 500 Equal Weight Index is like the S&P 500, except the 500 stocks are equally weighted instead of market cap weighted. For example, the stock exposure of the S&P 500 everyone quotes is based on market capitalization of the stocks, so the largest stocks are weighed heavier than smaller stocks.
Below are the top 10 holdings of the S&P 500 and their weightings. The top 10 out of about 500 holdings is 28% of the index.
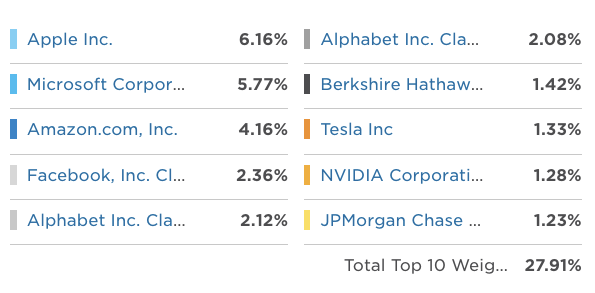
All of the 500 holdings of the S&P 500 Equal Weight Index are allocated at 0.25% no matter how large or small the company.
Said another way, the Equal Weight Index gives much more exposure to smaller stocks.
Up until now, the S&P 500 was trending with greater momentum than the Equal Weight Index.
As of today, the S&P 500 Equal Weight has finally trended above its prior high and breaking out of a base going back to May.
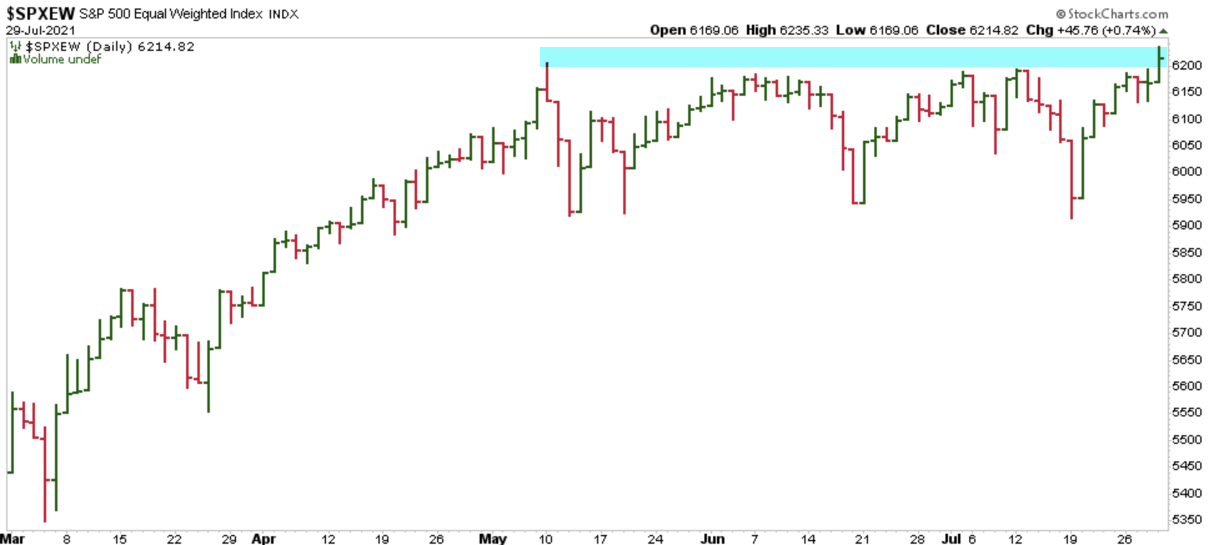
It’s a positive sign for stocks.
One of the bearish signs we’ve seen lately has been poor breadth of participation as measured by the percent of stocks above their 50 day moving average.
The S&P 500 Percent of Stocks Above 50 Day Moving Average is an indicator showing the percentage of stocks in the S&P 500 that closed at a higher price than the 50-day simple moving average.
We’ve heard a lot of concern on Wall Street about the divergence between the S&P 500 and the percent of the stocks in the index above their 50-day average price. The red arrow shows the falling breadth indicator S&P 500 Percent of Stocks Above 50 Day Moving Average signaling only about 54% of the stock are in a short term uptrend.
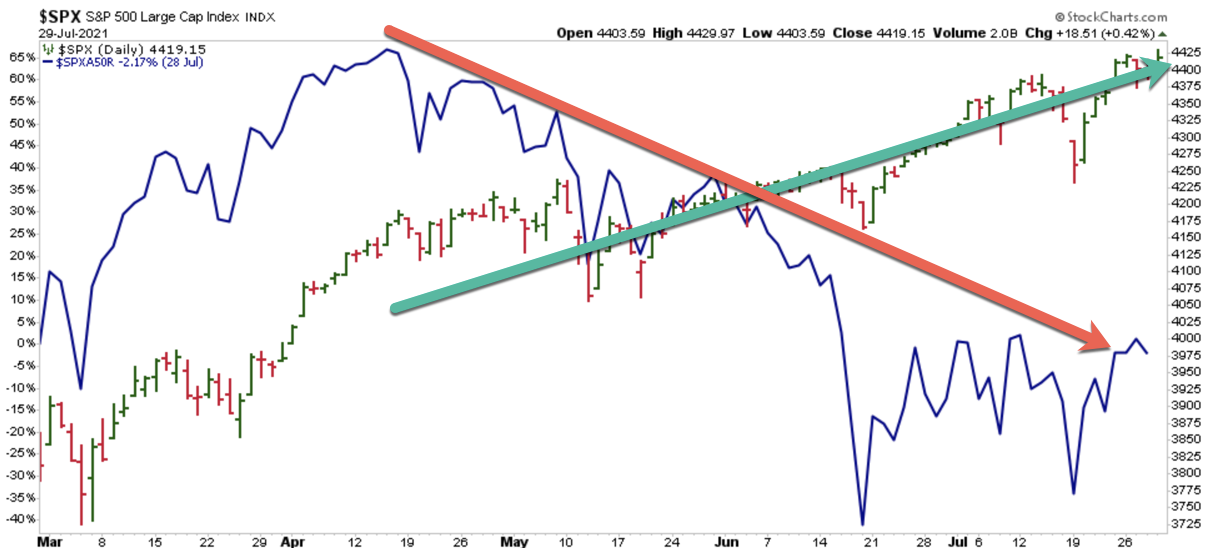
Such divergence is normally considered bearish, but not so this time.
Those who are concerned about this bearish divergence may consider instead comparing the percent of stocks above the 50 day to the Equal Weight Index because the S&P 500 Percent of Stocks Above 50 Day Moving Average itself is equally weighted, not cap-weighted. It’s a percentage and cares nothing about the size of the company.
With that in mind, here is the S&P 500 Equal Weight Index giving each stock the same 0.25% weighting compared to the S&P 500 Percent of Stocks Above 50 Day Moving Average, which gives each stock the same weight.
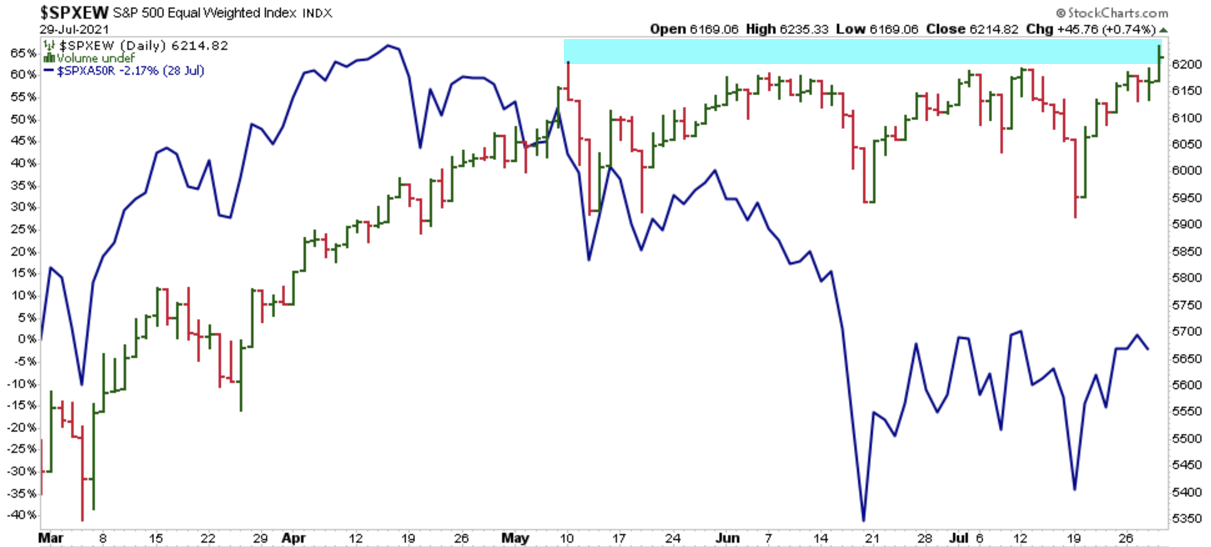
What I see here is the S&P 500 Equal Weight price trend peaked in early May, but it was preceded by a divergence in the S&P 500 Percent of Stocks Above 50 Day Moving Average. That is, the S&P 500 Percent of Stocks Above 50 Day Moving Average started trending down in April as the index was making new highs for a few more weeks. It signaled some of the stocks had peaked and started trending down, and then the whole index finally paused and has trended sideways for two months, until today.
I’m not real bullish right now about the stock market, and we had reduced our exposure significantly, but this is a positive sign. I’ll be watching for more stocks to trend up showing increasing participation so if this continues the wind will be in the markets sails again.
Mike Shell is the Founder and Chief Investment Officer of Shell Capital Management, LLC, and the portfolio manager of ASYMMETRY® Global Tactical. Mike Shell and Shell Capital Management, LLC is a registered investment advisor focused on asymmetric risk-reward and absolute return strategies and provides investment advice and portfolio management only to clients with a signed and executed investment management agreement. The observations shared on this website are for general information only and should not be construed as advice to buy or sell any security. Securities reflected are not intended to represent any client holdings or any recommendations made by the firm. Any opinions expressed may change as subsequent conditions change. Do not make any investment decisions based on such information as it is subject to change. Investing involves risk, including the potential loss of principal an investor must be willing to bear. Past performance is no guarantee of future results. All information and data are deemed reliable but is not guaranteed and should be independently verified. The presence of this website on the Internet shall in no direct or indirect way raise an implication that Shell Capital Management, LLC is offering to sell or soliciting to sell advisory services to residents of any state in which the firm is not registered as an investment advisor. The views and opinions expressed in ASYMMETRY® Observations are those of the authors and do not necessarily reflect a position of Shell Capital Management, LLC. The use of this website is subject to its terms and conditions.

You must be logged in to post a comment.