I’ve been busy making improvements to my systems the past several months, so I haven’t shared any of my market observations with the public.
Although we’ve certainly had many requests for it, I’ve waited until I notice a material change in the risk level.
I think we are now entering a materially higher risk level.
First, I’ve gotten a call from two different friends, two days in a row, who have no investment management experience, and both were asking my opinion about investing in speculative stocks.
Ruh-roh.
Talking with other hedge fund managers lately, I’ve mentioned the investor sentiment reminds me of 1999. Back in the late 90s everyone was a stock market genius, and that seems to be the belief again as price trend up confirming their expertise.
We know how that played out, and it will again.
Those who don’t believe it have a lesson to learn, and they will.
I prefer to follow the trend until the end when it bends, but sometimes trends, which are driven by an under-reaction that takes time to catch up can eventually result in an overreaction and an extreme. This uptrend hasn’t yet reached a major extreme by some measures, but it’s getting there enough to be a warning of a higher risk level.
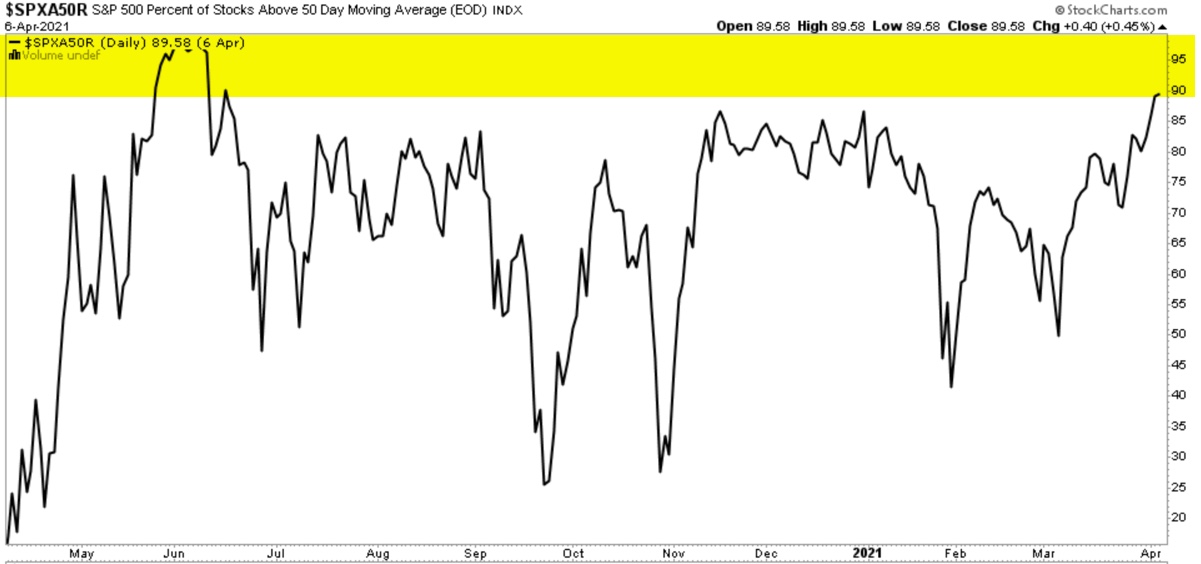
As of now, the percent of S&P 500 stocks trending above their average price of the past 50 days has reached about 90%, so most of the stocks are already in an intermediate term uptrend. Broad participation in an uptrend is a positive sign, but once most of the stocks are already trending up, I start to wonder when the trend will pause and reverse. This breadth indicator signals investor sentiment at the extremes, and it’s reached the point we should be prepared for an interruption of this uptrend. Of course, the market can remain irrational longer than you can remain solvent, so this doesn’t require a reversal, it’s a warning shot across the bow.
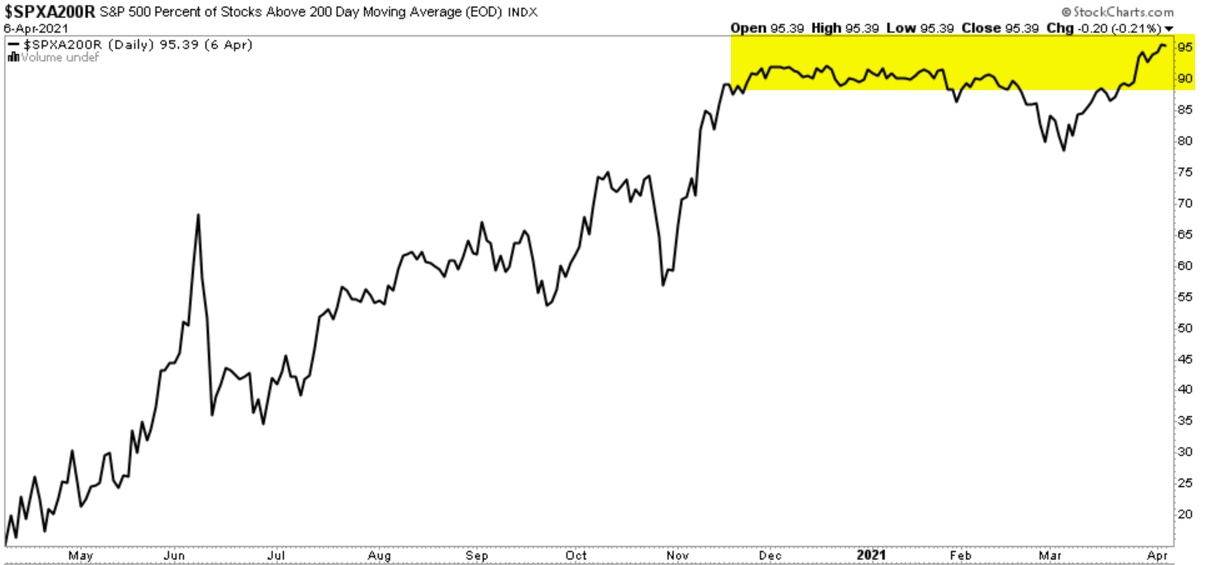
Next up is the percent of S&P 500 stocks above the 200 day moving average, which is a longer term uptrend signal. Here we highlight it reaching its highest level in over a year at 95% of the stocks in a long term uptrend. Again, it’s a positive sign that all but 5% of these stocks are in an uptrend, but once they’ve mostly trended up like this, it’s prone to be the end of the cycle.
Anyone who has been following along with my observations the past two decades know I love me some volatility trading, so my systems monitor for volatility expansions and contractions. What we have here is, a volatility contraction seen in the CBOE Volatility Index (VIX) fading down to the 17 handle range.
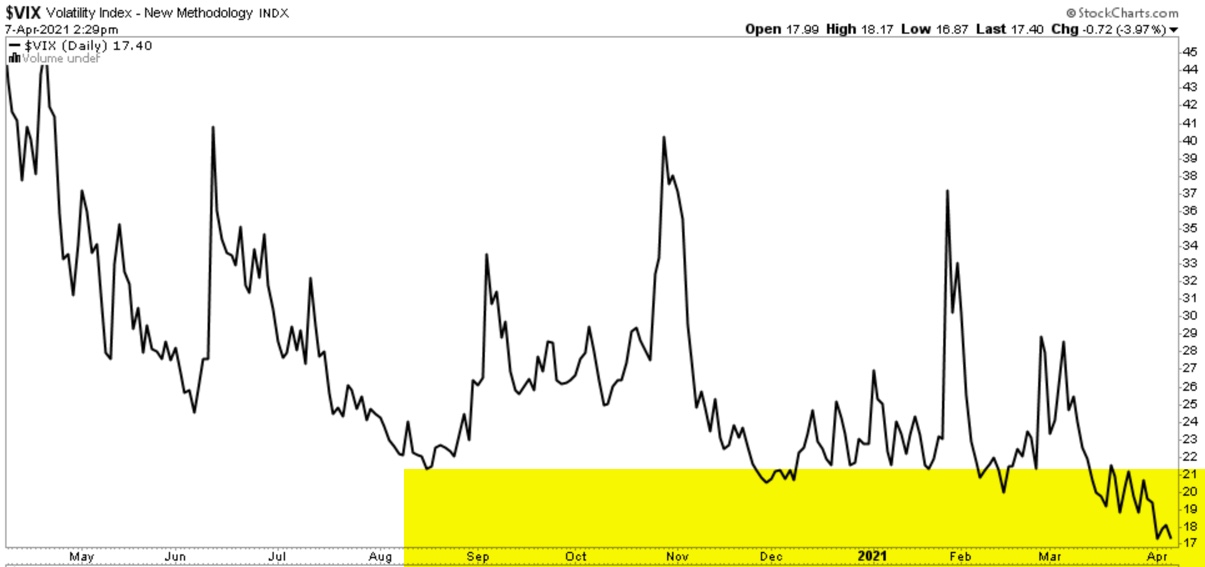
After prices have trended up for a while, I’ve observed the price trends tighten up as investors become more and more confident the trend will continue. Once something happens to cause a reaction, we’ll see prices spread out, which is volatility, and specially, a volatility expansion. The 17 range is far from an extreme low in the expected volatility over the next 30 days, which is what VIX indicates based on options prices, but as seen in the charge above, it’s trended to a new low.
Volatility contractions are eventually followed by volatility expansions. As soon as something surprises the market, we’ll probably see indecision, which leads to prices spreading out as investors and traders try to figure out what’s going to happen next.
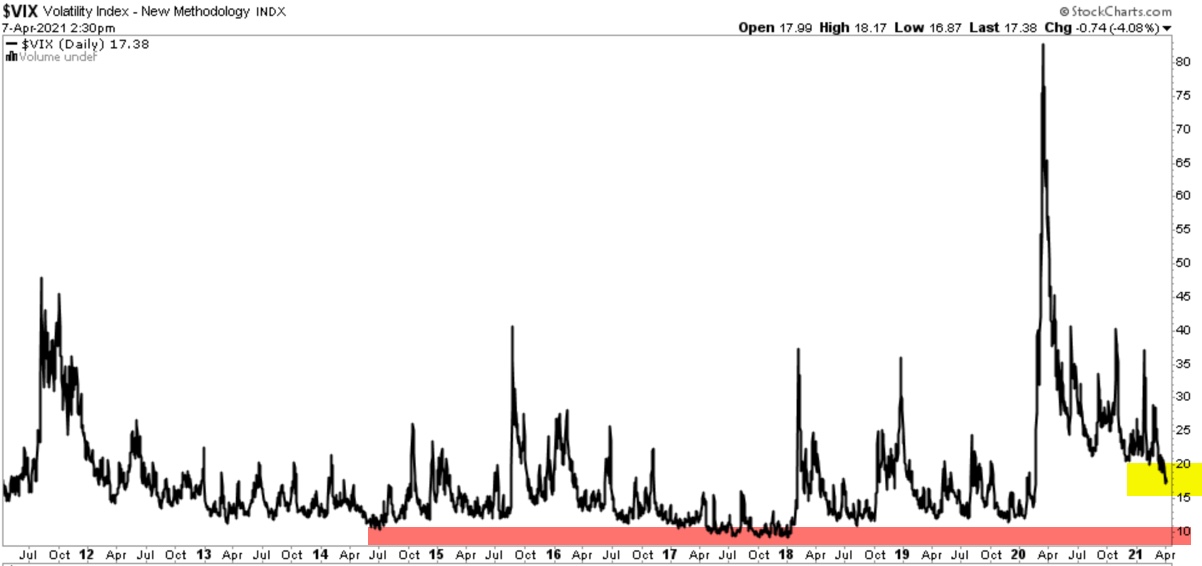
Looking at a longer time frame of the past decade, here we see volatility can contract down to the 12% range, so an overall tightening of the range of prices can always continue longer than expected.
Next up is the fundamental valuation of the stock index. I’m not a fundamental analyst, despite my advanced accounting degree. I learned the hard way a long time ago a stock price can trend far away from anyones perception of fundamental value.
If you’re an analyst at Goldman Sachs researching a company to see if they can pay for the loan the investment bank is considering giving them, you want to discover the potential to pay, and it’s a fundamental analysis to make an educated guess. When that company has stock trading on an exchange, it’s an auction market determined by supply and demand, which is driven by sentiment as much as anything. Many momentum stocks like Tesla are bid up based on enthusiasm for what may eventually be, not what is today.
With that said, I do believe the fundamental valuation level does have some predictive ability in the long run. When the S&P 500 Shiller CAPE Ratio is at its second highest level in 139 years, it suggest to me the corrections may be deeper in magnitude and quicker to unfold. We’ve seen that these past several years, and I expect to see it more.
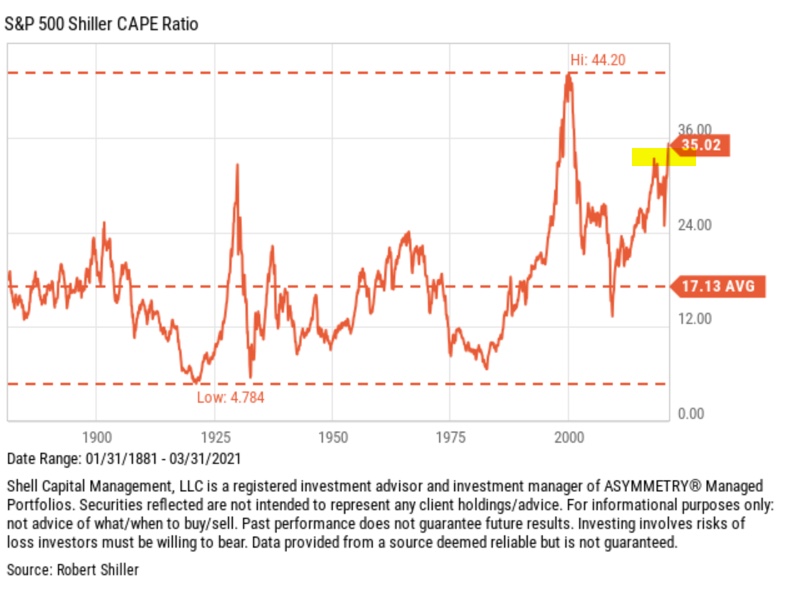
Because stocks are generally expensive based on the price to earnings ratio, it suggests we row, not sail.
If you wait for the wind to keep blowing, you may find yourself in the middle of the ocean running out of resources to stay afloat.
I prefer to get out the oars and start rowing to get where we want to be.
Speaking of the price to earnings ratio of S&P 500 stocks, here is another interesting observation. The S&P PE Indicator shows the average P/E Ratio for stocks in the S&P 500. It’s essentially a fundamental breadth indicator, similar to the percent of SPX stocks above their moving averages, which is price based breadth. This indicator is calculated by dividing the closing value of the S&P 500 by the trailing twelve months (TTM) of GAAP earnings for SPX, and multiplying the result by 100.
As you can see in the chart, it’s in uncharted territory of the past decade.
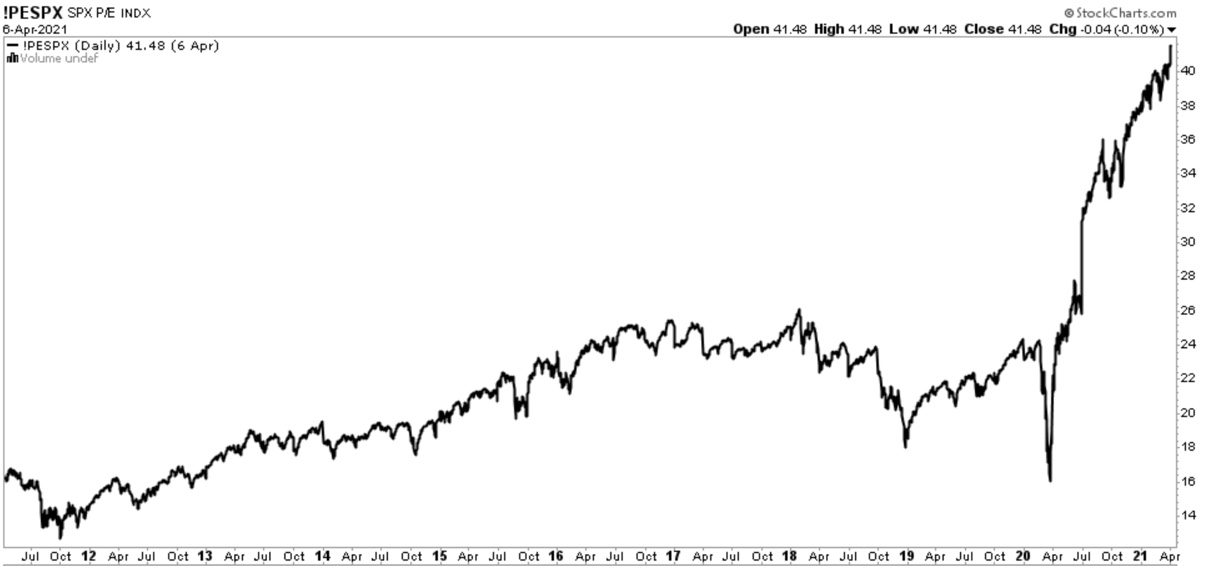
Of course, a high price to earnings ratio may be more justified as long as inflation is low, as it is now. If inflation begins to trend up, it’ll likely put longer term pressure on these price trends.
For these reason and more, I think it’s a good time to reduce exposure to the possibility of loss and/or hedge off downside risk.
I hope this helps!
Mike Shell is the Founder and Chief Investment Officer of Shell Capital Management, LLC, and the portfolio manager of ASYMMETRY® Global Tactical. Mike Shell and Shell Capital Management, LLC is a registered investment advisor focused on asymmetric risk-reward and absolute return strategies and provides investment advice and portfolio management only to clients with a signed and executed investment management agreement. The observations shared on this website are for general information only and should not be construed as advice to buy or sell any security. Securities reflected are not intended to represent any client holdings or any recommendations made by the firm. Any opinions expressed may change as subsequent conditions change. Do not make any investment decisions based on such information as it is subject to change. Investing involves risk, including the potential loss of principal an investor must be willing to bear. Past performance is no guarantee of future results. All information and data are deemed reliable but is not guaranteed and should be independently verified. The presence of this website on the Internet shall in no direct or indirect way raise an implication that Shell Capital Management, LLC is offering to sell or soliciting to sell advisory services to residents of any state in which the firm is not registered as an investment advisor. The views and opinions expressed in ASYMMETRY® Observations are those of the authors and do not necessarily reflect a position of Shell Capital Management, LLC. The use of this website is subject to its terms and conditions.

You must be logged in to post a comment.