Let’s get right to it.
Which do you prefer?

What you see in the chart is The S&P 500 stock index, which is an unmanaged index of 500 or so stocks, weighted by their capitalization (size of company) and it’s long-only, fully invested, and therefore fully exposed to the risk/reward of the stocks. The S&P 500 is often considered a proxy for “the stock market”, like the Dow Jones. The risk of the S&P 500 is unlimited, although all 500 stocks would have to fall to zero to lose all your money. It hasn’t done that before, but it has declined -56% just a decade ago. See the red arrow.
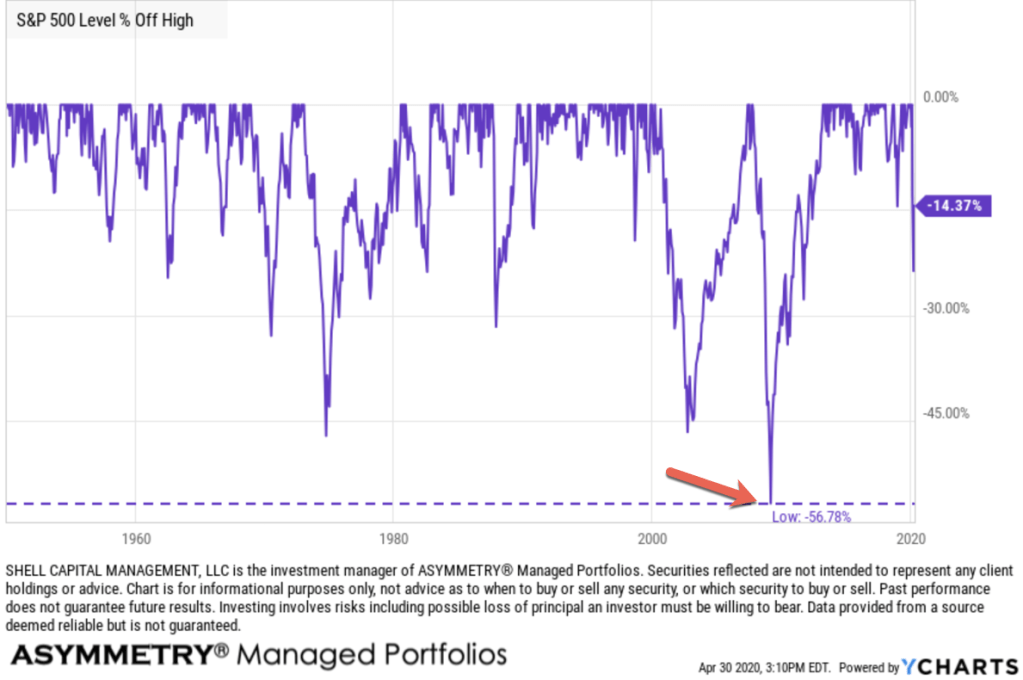
Before that period 2008-09, the S&P 500 declined -50% from 2000 to 2003. If something has declined this much before, it should be assumed it can and will again.
So, it’s risky.
And that’s the true risk. The worst historical drawdown is the real measure of risk. If some advisor is telling you risk is two or three standard deviations, run, don’t walk, out that door.
Since being fully invested in the stock market all the time is so risky, real investors with real money tend to want real risk management.
That is, not just “diversification”, which is often touted as “risk management.” Buying 500 stocks isn’t true diversification. Niether is buying 1,000 or 3,000 stocks.
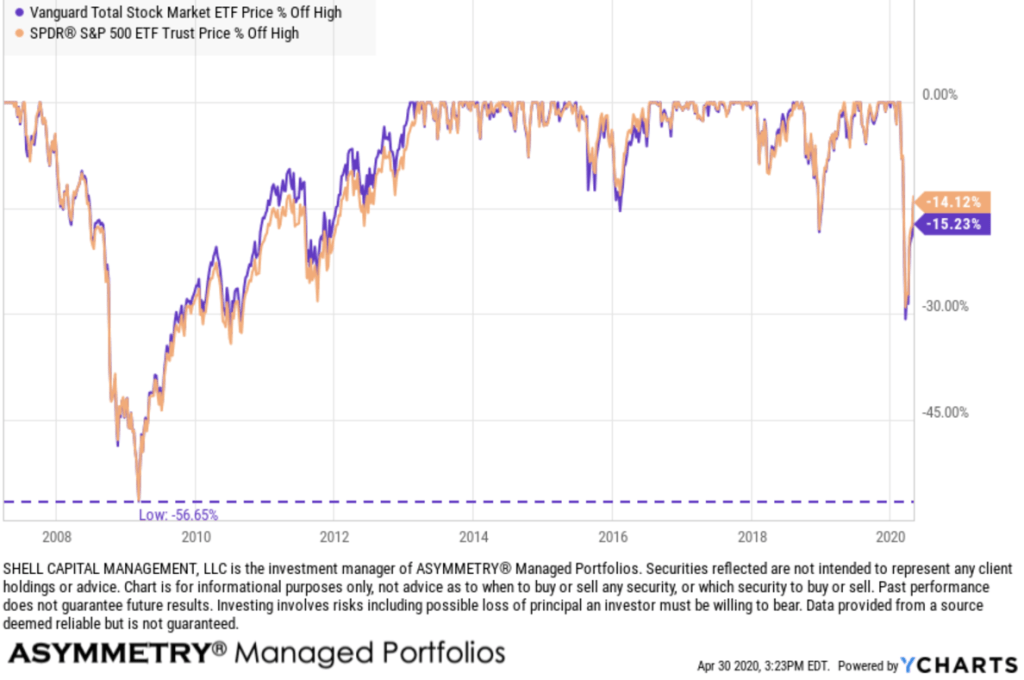
To be sure, the Vanguard Total Stock Market ETF holds 3,542 stocks. The next chart is the Vanguard Total Stock Market fund vs. the S&P 500 ETF. We don’t own either of them, so this doesn’t represent anything we’re doing at my investment company. It’s just an example, that yeah, the stock market is risky, not matter who you are, or how many you hold. Even with over 3,000 more stocks than the S&P 500, it falls the same.
But, to their credit, Vanguard does a good job saying their funds are risky. When I visited their website to see the number of holdings, it says:
Plain talk about risk
An investment in the fund could lose money over short or even long periods. You should expect the fund’s share price and total return to fluctuate within a wide range, like the fluctuations of the overall stock market. The fund’s performance could be hurt by:
- Stock market risk: The chance that stock prices overall will decline. Stock markets tend to move in cycles, with periods of rising stock prices and periods of falling stock prices. The fund’s target index may, at times, become focused in stocks of a particular sector, category, or group of companies.
- Index sampling risk: The chance that the securities selected for the fund, in the aggregate, will not provide investment performance matching that of the index. Index sampling risk for the fund should be low.
Risks associated with moderate to aggressive funds
Vanguard funds classified as moderate to aggressive are broadly diversified but are subject to wide fluctuations in share price because they hold virtually all of their assets in common stocks. In general, such funds are appropriate for investors who have a long-term investment horizon (ten years or longer), who are seeking growth in capital as a primary objective, and who are prepared to endure the sharp and sometimes prolonged declines in share prices that occur from time to time in the stock market. This price volatility is the trade-off for the potentially high returns that common stocks can provide. The level of current income produced by funds in this category ranges from moderate to very low.
Ok, so we’ve established that the stock market is risky and even a fund invested in thousands of stocks can decline over -50% and take years to recover.
So, we just answered: Why risk management?
It doesn’t matter how much the return is if downside drawdowns are so high you tap out before the gains are acheived.
It also doesn’t’ matter how big the gains are if you give it all up before selling and realizing a profit.
I digress.
I specialize in active dynamic management strategies. I’ve been developing and operating investment risk management systems for the past two decades. Since my focus is on managing the downside, within our risk tolerance, I’m left to let the horses run. If we can direct and control our drawdowns, within reason, it’s never a sure thing, then we are left to focus on the upside of profits.
To illustrate two different methods of risk management, I’m going to use the most simple examples possible. I’m also going to use indexes managed by others, instead of my own. It’s all about keeping it simple to make a point.
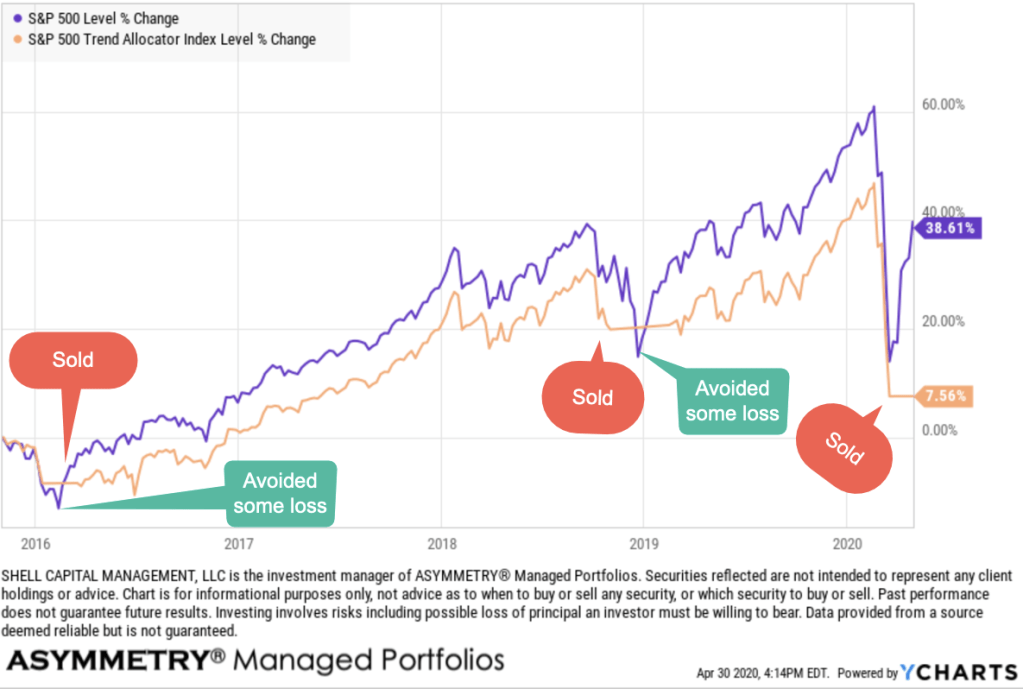
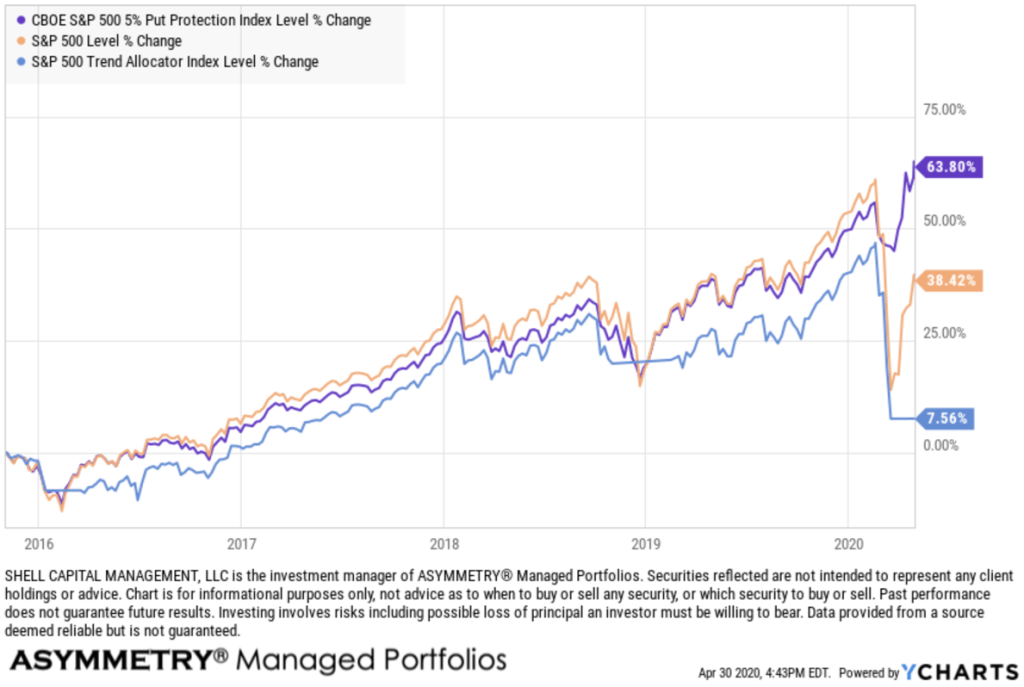
So, here we go. I explained the orange line is the S&P 500, fully invested in stocks, all the time, no risk management beyond the diversification of investing in 500 stocks across 10 sectors like financial, healthcare, and tech.
The blue line in the chart is the S&P Trend Allocator Index. The S&P 500® Trend Allocator index is designed to track the performance of a systematic trend-following strategy allocating between the S&P 500 and cash, based on price trends. If the S&P 500 is observed to be in a positive trend, then the index is allocated to the S&P 500, otherwise, it is allocated to cash. It’s a very simple form of trend following applied to stocks. When the S&P 500 is above its 200 day simple moving average, it invests in stocks. When it trends below the 200 day for more than 5 days, it shifts to cash.
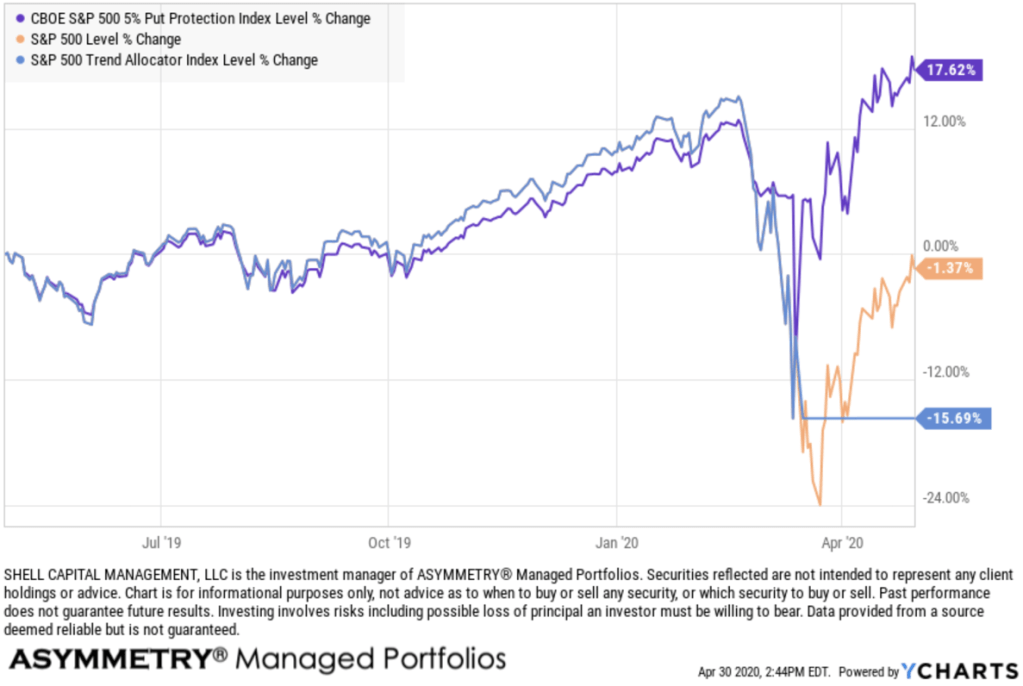
The purple trend line, which has achieved the highest return, is the CBOE S&P 500 5% Put Protection Index. The CBOE S&P 500 5% Put Protection Index is designed to track the performance of a hypothetical strategy that holds a long position indexed to the S&P 500® Index and buys a monthly 5% out-of-the-money S&P 500 Index (SPX) put option as a hedge. It’s a defined risk strategy, using put options for dynamic hedging.
Trend Following vs. Hedging with Options
Which worked better?
For a closer look, here is the year to date return streams.
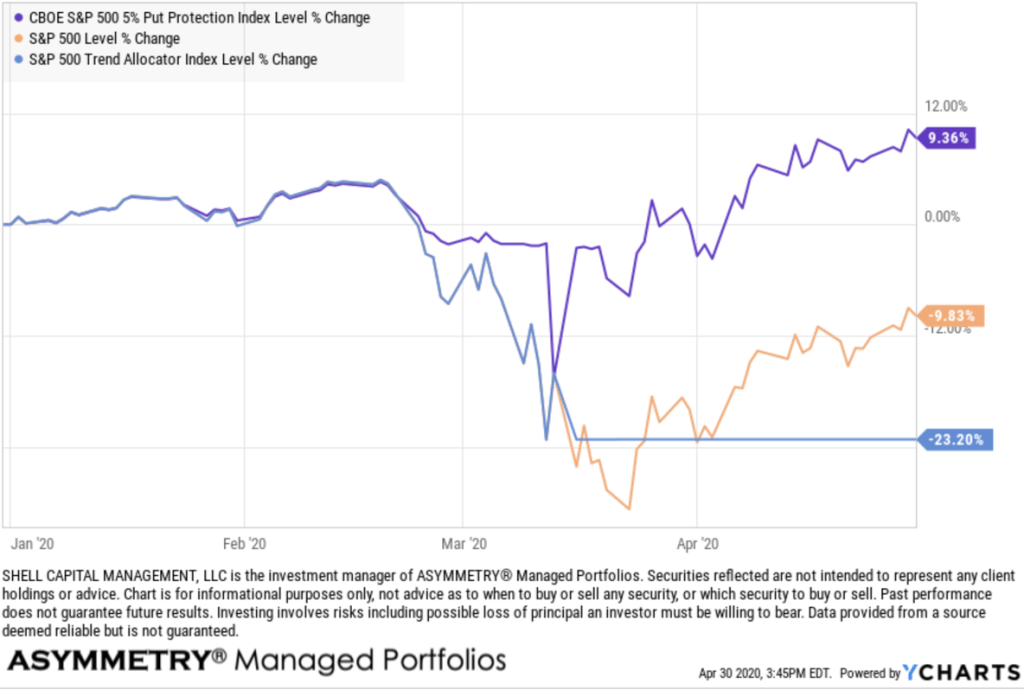
Clearly, hedging with 5% out of the money put options has achieved the better asymmetric risk/reward this time. Applying the simple trend following strategy of selling after the stock index declines below its 200 day moving average exited before the low of the S&P 500, but it remains uninvested, missing out on the upside. The trend following streastgy is down -23% year to date, which is worse than the S&P 500. The hedged index is actually positive for 2020. The hedge paid off, according to this index.
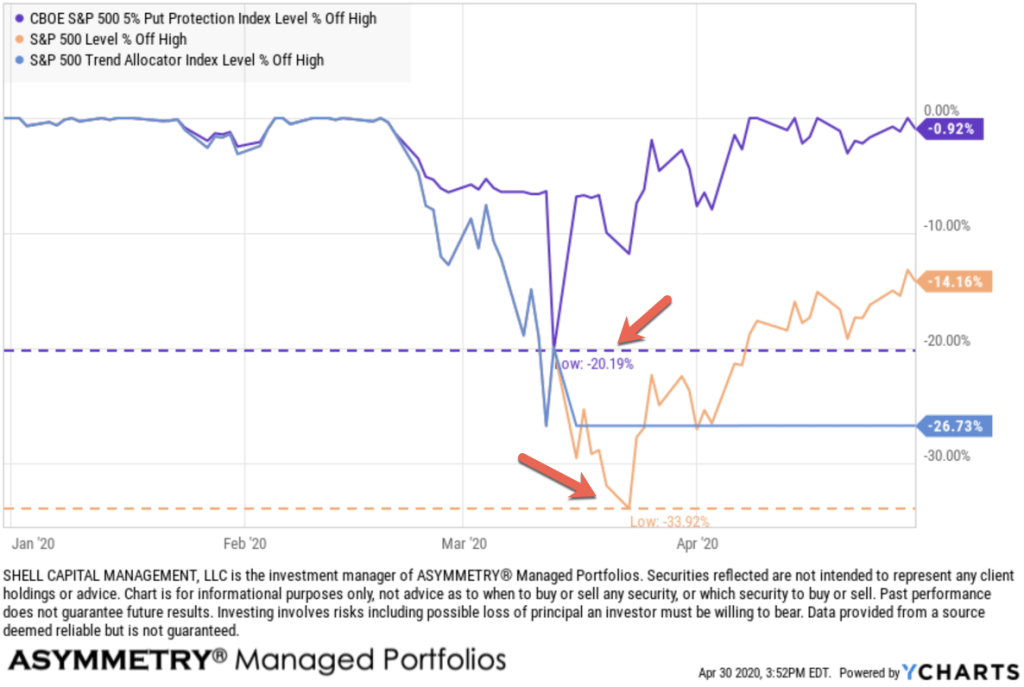
Let’s take a closer look at the downside via a drawdown chart, the % off highs. As expected, the S&P 500 stock index had the worst drawdown, so far. It declined -34%.
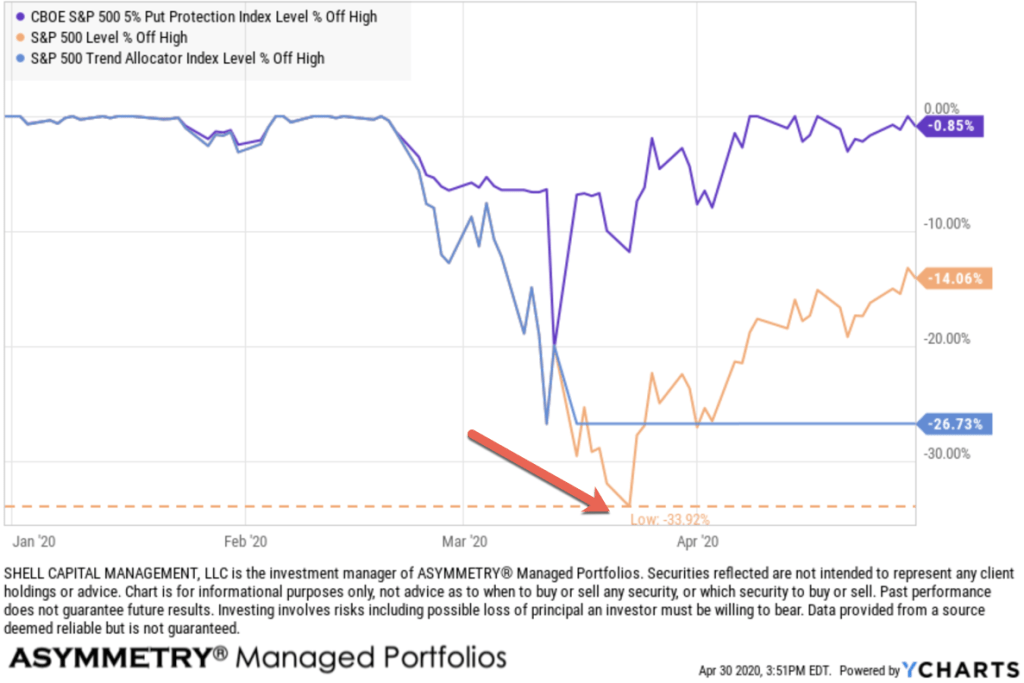
The strategy of buying 5% out of the money put options had a drawdown of -20%, which is about half of the S&P 500. The systematic trend following strategy was able to cut the drawdown a little short at -27%. The trend following strategy is currently still in its drawdown.
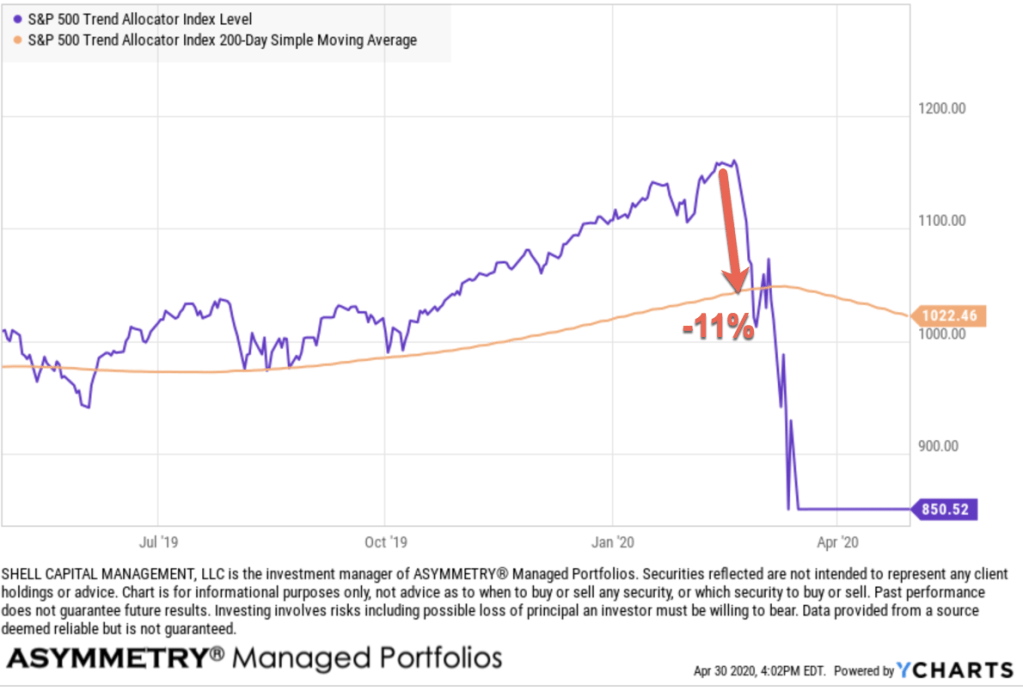
It’s out of the stock market, so it has also missed out on the recent uptrend. Although, it the stock market enters another waterfall decline, that may turn out better. But, to catch up with the fully invested stock index, that’s what would have to occur. The stock market would have to fall a lot, then the strategy reenter at a better point. However, trend following never enters the lows, and never sells the highs, either. Instead, it enters and exits on a lag and the 200 day moving average is a significant lag. For example, I new this trend following strategy would have at least a -11% drawdown, because when the stock market was at its high in February, the 200 day moving average sell signal was -11% lower.
However, this simple system also requires the index to remain below the 200 day average for 5 days, which is intended to reduce whipsaws. That’s why it didn’t initially sell on the first leg down. Instead, it sold after the second leg down. Since the S&P 500 is still below its 200 day moving average, this trend following system hasn’t invested in the stock market yet. In fact, it would have to stay above the 200 day for 5 days. It’s a symmetric trading system. It applies the same signal for the entry and the exit. I know that price trends drift up and crash down, so my version of this is an asymmetric trading system. I apply a different exit than the entry to account for the unique behavior of price trends since they drift up, but crash down.
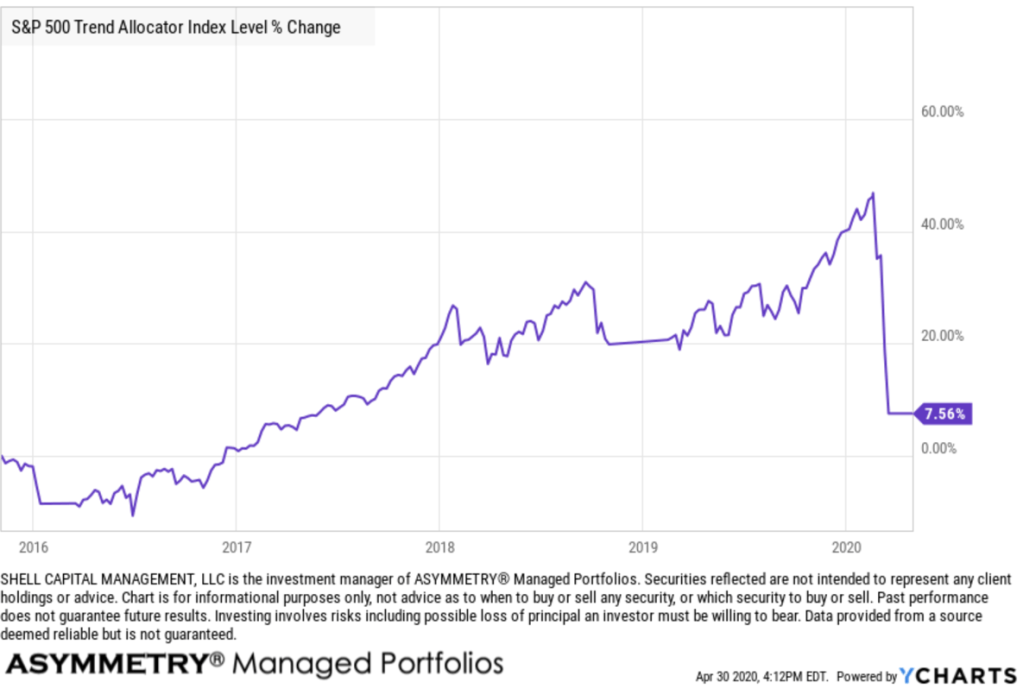
How has systematic trend following worked on stocks over a longer period?
It’s had some challenges. Volatile periods, when a market swings up and down over shorter time frames, are hostile conditions for trend following methods. This index has only gained 7% the past 5 years after this recent drawdown. While it does cut the losses short, which is what trend following is known for, it has struggled due to market conditions.
I marked up the next chart, where I include its trend relative to the S&P 500 index. I labeled when it sold, which was three times. The first two times, selling with the trend following sell signal of a 200 day SMA avoided a little of the downside. This time it hasn’t helped so much. Overall, the trend following applied to stocks had lower relative strength than the fully invested stock index with no risk management. But, it avoided some downside. Over this short time frame, the downside loss mitigation probably isn’t deemed enough to account for the difference in the outcomes.
With risk management systems, we never expect them to achieve the same or better return than a fully invested stock index that is always exposed to the risk/reward of stocks. The stock index also doesn’t include expenses and it may not be invested in directly. Investors demand risk management because they don’t want the -50% declines they would endure being invested in the stock market with no exit and no hedge.
Speaking of hedge.
Neither of these risk management indexes I’m using for this example have been around long. The CBOE CBOE S&P 500 5% Put Protection Index started in 2015.
The CBOE S&P 500 5% Put Protection Index is designed to track the performance of a hypothetical risk-management strategy that consists of a long position indexed to the S&P 500 Index (SPX Index) and a rolling long position in monthly 5% Out-of-the-Money (OTM) SPX Put options. This is a relatively simple example, though executing it well isn’t so simple. The protective put strategy has achieved better asymmetry, this time. I say this time, because it doesn’t always work as well as it did this time. But, here it is.
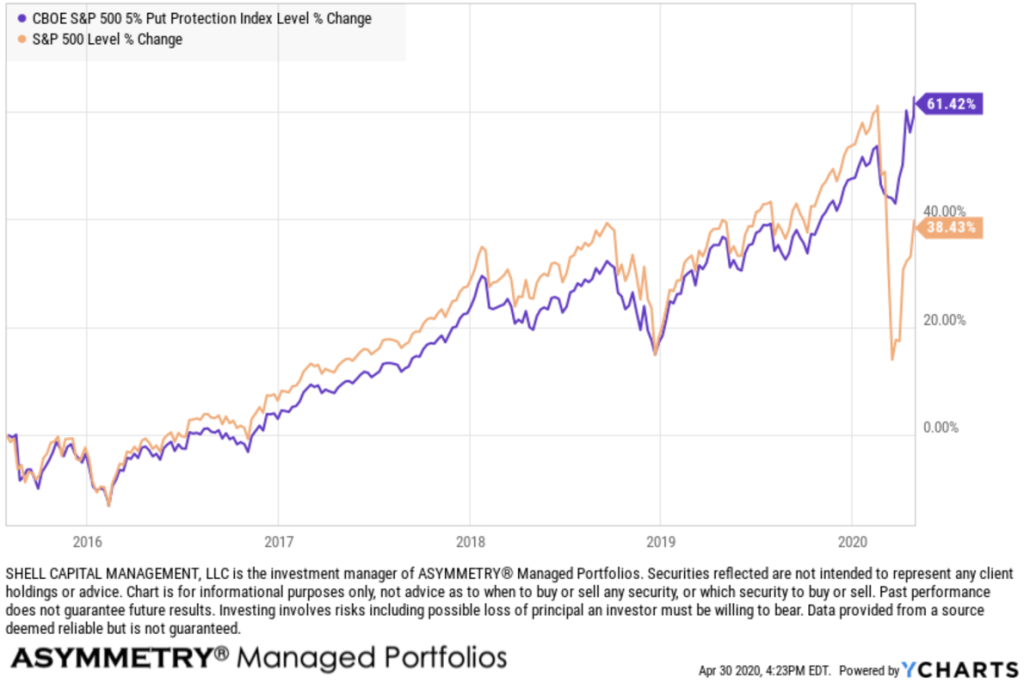
As you can see, it lagged the stock index in the uptrend, until now. Lagging in the uptrend is expected. Buying a put option gives us the right to sell our stock below a certain price. It’s similar to buying home or car insurance. When we buy a protective put option, we literally pay a “premium” for a time period to expiration, like insurance. Some call it portfolio insurance. If we pay an insurance premium for years, it reduces our personal profit and loss statement. The protection is an expense. We’re willing to pay it to avoid large drawdowns. A skilled options trader can potentially execute it better, if an edge can be gained with timing the relative value of the options.
Asymmetric hedging beat the simple following strategy this time. I call it asymmetric hedging, because when we buy a put option, we have limited downside risk (the premium paid) but we have a maximum gain of the Strike price – premium paid. To learn more about a Long Put option, here is a video from the OIC.
The protective put strategy has achieved better risk/reward. I say this time, because it doesn’t always work as well as it did this time. Also, I said the Long Put protection strategy is an “asymmetric hedge” because it has a larger potential profit than the cost for the exposure. There are much better examples of what I call an asymmetric hedge, for example, going long volatility can have a substantial asymmetric payoff. Just look at the VIX. It spiked up more than ever in history, so even a small option position to be long volatility would have a tremendous payoff. Imagine if we spent just 1% of a portfolio but the payoff was 10% at the portfolio level. Yeah, that’s asymmetry.
Back to the comparison of trend following to hedging with options, here is the return streams over the past five years. I consider both of these risk management methods to be basic asymmetric risk/reward payoffs. The trend following system didn’t do so well this time, at least so far, but it still has limited downside risk and unlimited upside gain potential. If the stock market keeps going up and never trends down below its 200 day average, it would keep gaining.

But, if we believed that was what it will do, we wouldn’t care about risk management. Some people actually do put their money in stocks and stock funds and don’t consider limiting their downside. To each their own. Before this bear market is over, they may be crying about their large losses, as they did last time. But I’m guessing this time, if they do it again, they may learn the lesson. The stock market is risky, all investing involves risks as do all strategies. No strategy is perfect. We have to be willing to accept the imperfections and settle with a C sometimes, if we want to A over the long run. This isn’t college. Money compounds.
This leads me to one more thought to share. I was watching this video from Ray Dalio, the founder of the largest hedge fund in the world. Dalio was speaking of this chart in his presentation. He calls it “The Holy Grail.”
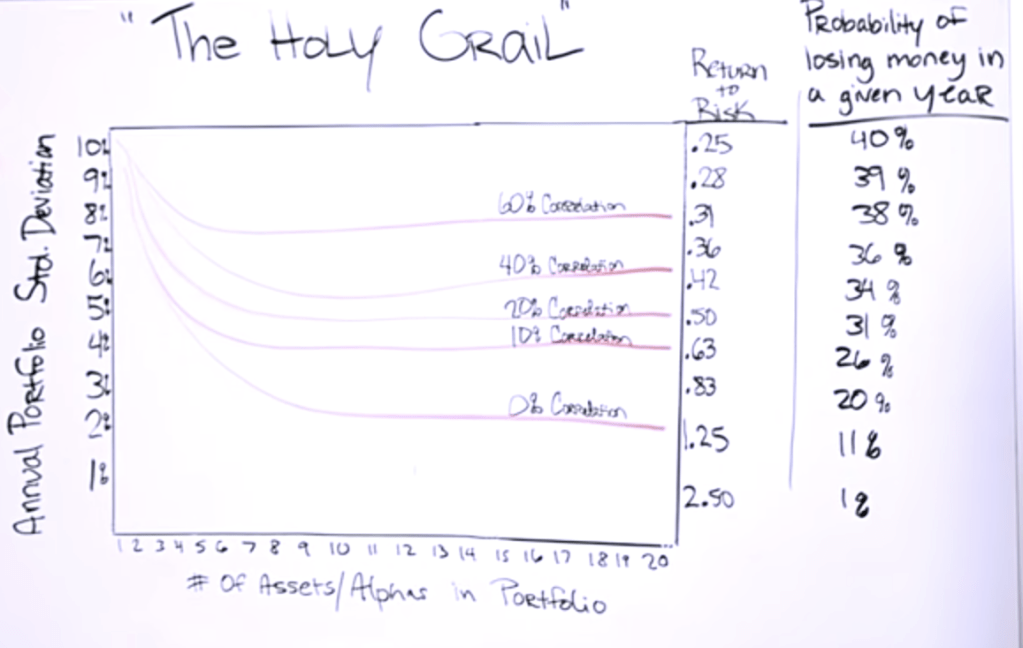
In an ideal world, we could invest in 15-20 different assets that are uncorrelated and because one trends up with others are trending down, similar to the hedging strategy, we would achieve an edge from pure diversification. He says The Holy Grail is combining these unique returns streams, which has gains and losses at different times, but overall, the portfolio trends up to the upper right corner.
That’s in an idealized world.
You may know better. Shit happens in the real world. A joke going around is:
Started the year off January 1st: THIS IS MY YEAR!
By April, wiping my …. with coffee filters.
Now that’s funny right there! I don’t care who you are!
Yeah, I said it. It’s a sign of the times. We need to lighten up and laugh as much as we can, especially about the simple things in life, like running out of tp.
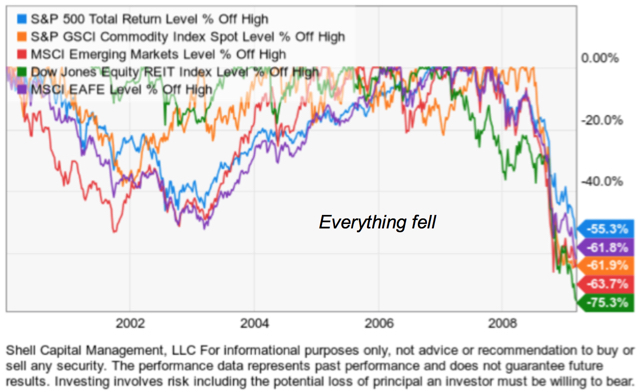
In bear markets, correlations go to one. That is, most everything falls. Why? Even if you have gains in some uncorrelated markets, if you have big losses in others, as a fund manger, you take the profits to help deal with the losses. It eventually pushes down the leaders, too. That’s just one of many examples. Here’s an old chart I’ve used for years to illustrate how diversification along can fail.
There is no free lunch, but Dalio is right, if we could combined 15 or so unique return streams, it could be an edge. The trouble is, what markets can you simply invest in that are truly disconnected from the others?
No many. Maybe long term US Treasuries along with stocks, but going forward, it’s not going to look like the past. US Treasuries will be tradable, but with the interest rate down to 1%, the upside in price is very limited, so is the interest income.
Uncorrelated Return Streams
I did both of this type of strategy, and more, in Asymmetry Global Tactical Fund, LP which was a private managed by another company I founded in 2012, Asymmetry Fund Management, LLC. What I believe is more of “The Holy Grail” isn’t making simple investment allocations into different funds or markets hoping for diversification from non-correlation, but instead, combining asymmetric trading systems that have unique return drivers and asymmetric risk/reward profiles. My different trading systems have different return drivers. Instead of market factors and conditions driving the return stream, the buy, sell, and risk management system extracts from the market a unique return stream. It’s a return stream we can’t get from just investing in some funds with different managers. They are mostly correlated, multiple asymmetric trading systems may be very uncorrelated from each other. For example, one system may trend follow longer term trends. Another may trend follow short term trends. Then, they are applied to difference markets, say stocks, bonds, currency, and commodities. Another complete different system may be volatility trading, aiming to gain from a volatility expansion. Add in some countertrend systems, that buys short term oversold and sell short term overbought, and it’s going to produce a unique return stream from everything else. What if the countertrend system is applied to different markets, then, each extracting a unique return stream.
That’s real diversification.
It can’t be achieved by just investing in different markets, or investing in a bunch of funds. But, someone like Dalio, or me, who has multiple trading systems and strategies, we may benefit from the edge of combining them, o even shifting between them.
But I have an edge, and a very big one, over Dalio. He’s got to move around billions. He can’t trade nimble as I can. My flexibility and nimbleness is an edge. I’m not ever going to manage 50 billion or 100 billion and would never want to. I already have what I want. I have enough. It allows me to focus, and be dynamic. I’m happier with little to no distraction.
Now, this is an overly simplified idealized example I’ve used here with the trend following and put buying hedging strategy, but just thing about how this would look if we combine them along with 15-20 others. The larger the money we manage, the more we need to just allocate capital into something rather than trading.
You can probably how these three trends are correlated in uptrends, then disconnect in downtrends. Some combination of them can smooth the ride. In this overly simple example, it would mean some exposer to long-only fully invested in stocks, all the time, no matter how far they fall. Another is always hedged, so it will lag on the upside, but limit the risk on the downside. Then, the trend following system absolutely exits in downtrends and waits for an uptrend. When the market is crashing, nothing looks better in our account that FDIC insured cash deposits.
But, I rotate, instead of allocate.
I would rather shift between markets to be exposed when I believe the risk/reward is asymmetric and avoid it when it isn’t.
Then, imagine if each of these have its own risk management to predefine risk in advance and a portfolio level drawdown control to limit overall drawdowns to less than the -30% of more than is common with the stock market.
So, there you go, a trend following system relative to a options hedging system, and a hint at how we see it. I’m an unconstrained tactical money manager. I don’t constrain myself to a box. I never liked being put in a box and I don’t fit well in any box. I’ll go were the money is treated best. Flexible, adaptable, nimble, unconstrained, and unbiased.
That’s just how I roll.
Mike Shell is the Founder and Chief Investment Officer of Shell Capital Management, LLC, and the portfolio manager of ASYMMETRY® Global Tactical. Mike Shell and Shell Capital Management, LLC is a registered investment advisor focused on asymmetric risk-reward and absolute return strategies and provides investment advice and portfolio management only to clients with a signed and executed investment management agreement. The observations shared on this website are for general information only and should not be construed as advice to buy or sell any security. Securities reflected are not intended to represent any client holdings or any recommendations made by the firm. Any opinions expressed may change as subsequent conditions change. Do not make any investment decisions based on such information as it is subject to change. Investing involves risk, including the potential loss of principal an investor must be willing to bear. Past performance is no guarantee of future results. All information and data are deemed reliable but is not guaranteed and should be independently verified. The presence of this website on the Internet shall in no direct or indirect way raise an implication that Shell Capital Management, LLC is offering to sell or soliciting to sell advisory services to residents of any state in which the firm is not registered as an investment advisor. The views and opinions expressed in ASYMMETRY® Observations are those of the authors and do not necessarily reflect a position of Shell Capital Management, LLC. The use of this website is subject to its terms and conditions.

You must be logged in to post a comment.