Indicators of the internal strength of the market measure the breadth of the market trend using the number of individual stocks participating in a move.
On December 24, 2018, I shared my observation in An exhaustive stock market analysis… continued that the stock market was washed out since most stocks had fallen. This gave us a signal the selling may have been exhausted and we could look for signs the prices had reached a low enough level to attract buying interest.
That’s exactly what we’ve seen since.
But, what is the current state of the stock market and those indicators?
The percent of the S&P 500 stocks above their 200 day moving average is a longer-term indicator since the lag is 200 days. It takes more time for more stocks to trend above this longer moving average, so by the time they all do, it may be a better long term indicator of a higher risk level. The thinking is once most stocks are already above their longer trend line, it could be closer to the end of the trend and visa versa. In the chart below, we see the only 10% of stocks were in a positive trend at the December low and today it’s closer to midfield. I consider this to be within a normal range. It shows us the current uptrend could have plenty of room to keep trending up before this breadth indicator would suggest longer-term buying exhaustion.
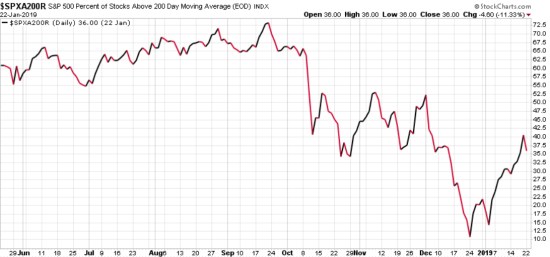
However, it’s possible this is the early stage of a bigger bear market. If it is, we’ll see swings up and down to eventually lower highs and lower lows. In that scenario, we’ll see the shorter term indicators reach extreme highs and extreme lows as bear market trends historically unfold as cycles.
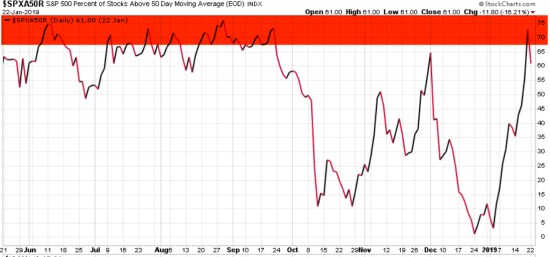
The percent of the S&P 500 stocks above their 50 day moving average is a shorter term indicator. Here we see most stocks were participating in the uptrend and have trended above their short term 50-day moving average. In fact, by this measure, we should be surprised to see at least a short term decline in stocks. Price trends don’t often trend straight up, they are more like a stair step as they pause along the way.
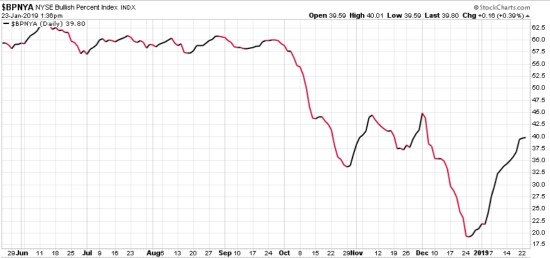
The NYSE Bullish Percent is another breadth indicator showing the percent of stocks trading on the NYSE stock exchange that is in a positive trend. Specifically, it’s the percent on a Point & Figure buy signal. The NYSE listed stocks are mostly larger companies so we can see the 40% range is about midfield like the % of stocks above their 200 day. No extreme here. New buy signals are expanding when the indicator is rising.
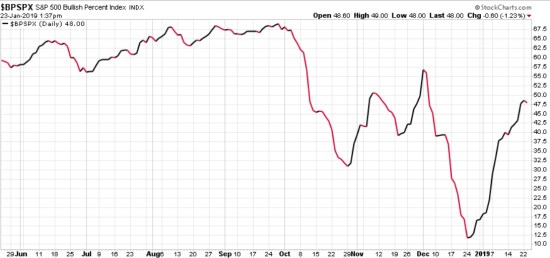
I don’t see any extreme level in the S&P 500 Bullish Percent, either, so there is plenty of room for trends in either direction.
Record High Percent is a breadth indicator that confirms when new highs outnumber new lows and when new highs are expanding. Record High Percent is new 52-week highs divided by the sum of new 52-week highs plus new 52-week lows. When the indicator is above 50, new highs outnumber new lows. New highs are expanding when the index is above 50 and rising. We can see visually this is a faster moving breadth indicator, so it reaches extremes faster and more often.
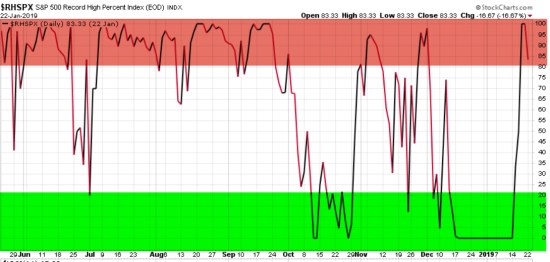
Overall, since the most recent low on December 24th, the breadth indicators suggest there has been broad participation in the uptrend, and the trend may have entered a stage where we could see some short term momentum and buying interest wane. However, the longer term indicators signal there is plenty of room for a continuation of the recent uptrend if it doesn’t instead reverse down to a lower low.
These midfield levels are harder to read since they don’t get so extreme the probability is high of a reversal. In the price trend between the extremes, I prefer to ride the trend and maybe hedge.
For tactical traders and risk managers, this is probably a good time to reduce exposure or hedge off some downside risk and get more neutral in the short term to see how it all unfolds.
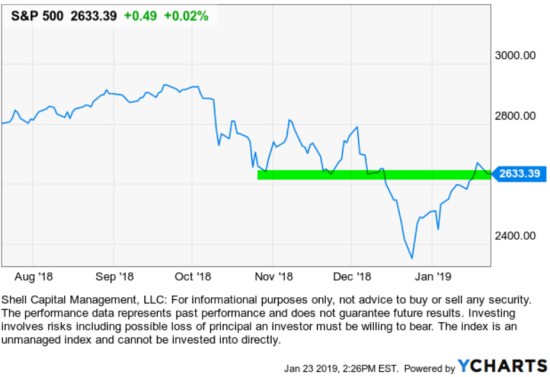
In fact, all of the above is just confirming what I see in the above price trend of the S&P 500. It’s oscillating around the line where there could exist some prior resistance, or it could become support. It’s at an inflection point.
We’re seeing some pause around the level and we’ll soon see what direction supply and demand drive it next.
Mike Shell is the Founder and Chief Investment Officer of Shell Capital Management, LLC, and the portfolio manager of ASYMMETRY® Global Tactical.
The observations shared on this website are for general information only and are not specific advice, research, or buy or sell recommendations for any individual. Investing involves risk including the potential loss of principal an investor must be willing to bear. Past performance is no guarantee of future results. The presence of this website on the Internet shall in no direct or indirect way raise an implication that Shell Capital Management, LLC is offering to sell or soliciting to sell advisory services to residents of any state in which the firm is not registered as an investment advisor. Use of this website is subject to its terms and conditions.

You must be logged in to post a comment.