People tend to overreact and under-react to new information.
We observe it in the global capital markets more frequently than anywhere, and with immediate feedback.
So, those of us who are adept at identifying and monitoring directional trends in global markets have an advantage in researching trends of all kinds if our quantitative trend methods are robust, and our qualitative judgment and decision-making process is repeatable.
Intellectual skills that are associated with acquiring reliable information about nature are parts of the scientific process. Scientists of all kinds need skills like: communicating, observing, classifying, measuring, predicting, inferring, and researching.
Science isn’t just science, there’s also some art to it. I believe the first skills are more art, such as communicating, observing, classifying.
Many say investing and investment management is both art and a science. Some believe investment management is more art than science, others believe it’s more science than art. Quants try to make it more scientific than artistic.
I do a combination. I am Man + Machine.
The way I look at trends and how time series interact with each other is a robust process that may be applied to anything.
I don’t read articles in Bloomberg or The Wall Street Journal to hear the opinions of others to decide what I believe for myself. When I was a young rookie I did read a lot at first, as we all do, then learned the hard way to focus my efforts on my own original research and thinking.
I do best when I do my own work, as an independent thinker.
So, over the decades as a professional researcher, I first inspect the data to observe any trends and then make sense of it afterward. Sometimes my intention is for predictive analytics, other times it’s just prescriptive. predictive and prescriptive analytics. Predictive analytics provides us with the raw information for making informed decisions, while prescriptive analytics provides us with data-backed, evidence-based decision points that we can weigh against one another.
The scientific method is an empirical method of acquiring knowledge through careful observation, and applying rigorous skepticism about what is observed, realizing how cognitive assumptions and bias can distort how one interprets the observation.
- Descriptive Analytics, applying data aggregation and data mining to provide observations and insight into the past to answer:
- “What has happened?”
- Predictive Analytics, applying statistical models and probabilistic forecasting methods to understand the future and answer:
- “What could happen?”
- Prescriptive Analytics, applying simulation and testing algorithms to advise on possible outcomes and answer:
- “What should we do?”
The Scientific Method and experimenting is a systematic approach to problem-solving and decision-making.
An algorithm may look something like this:
Problem —> Hypothesis —-> Prediction —-> Test Predictions —> Evaluation
We all have biases. All industries have biases. Sometimes these biases gave blindspots. Our biases that can narrow our vision and influence behavior and beliefs. It’s why in asset management, we often consult with researchers outside the industry to help avoid blind spots from industry bias. For example, the personal financial planning profession has a tendency to blindly say “balance your risks and rewards” and “balance your portfolios”, which is about the silliest things I’ve ever heard.
If you balance your risk and reward, you get symmetry on your statement.
If we want asymmetry, we have to skew the risk and reward positively.
It’s essential to identify blind spots, own them without being defensive, and adjust our behavior to avoid it.
MY OBSERVATIONS OF COVID 19
I have an advantage, because I observe COVID 19 trends and rates of change as it is, without any bias as to beliefs about the disease and such. That is, I’m just purely looking at the data we collect and feed into our systems for observation.
It’s like this:
- I focus on; what has changed?
- I look for extremes in levels, like new high or low breakouts.
- I also monitor the rates of change. Fast breakouts are more likely to form an ongoing trend than slow.
FLORIDA COVID 19 UPDATE
As COVID 19 and the mass quarantine strategy for suppressing the spread has become a political debate lately, so some of you may perceive what you are about to read that way.
Don’t.
I have no political bias about this whatsoever. My personal preference is to get past this virus as quickly as possible with as little human suffering as possible. Ignoring the data and facts doesn’t get us there. Exaggerating the data and facts doesn’t either. So, I suggest you try to see the trends for what they are, as I am.
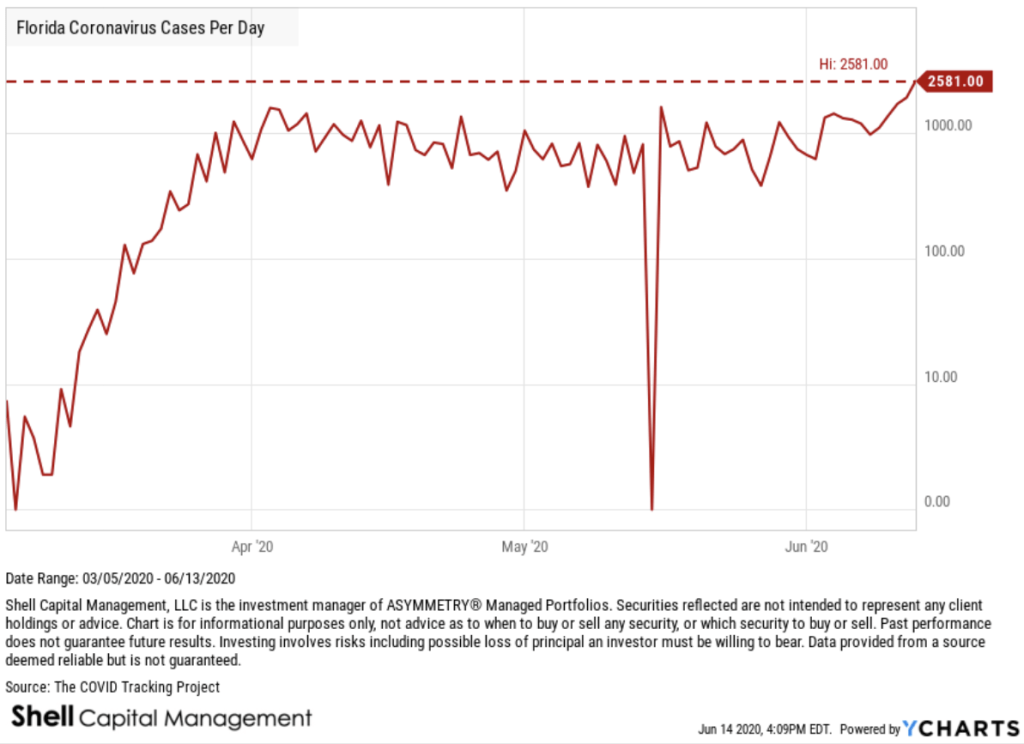
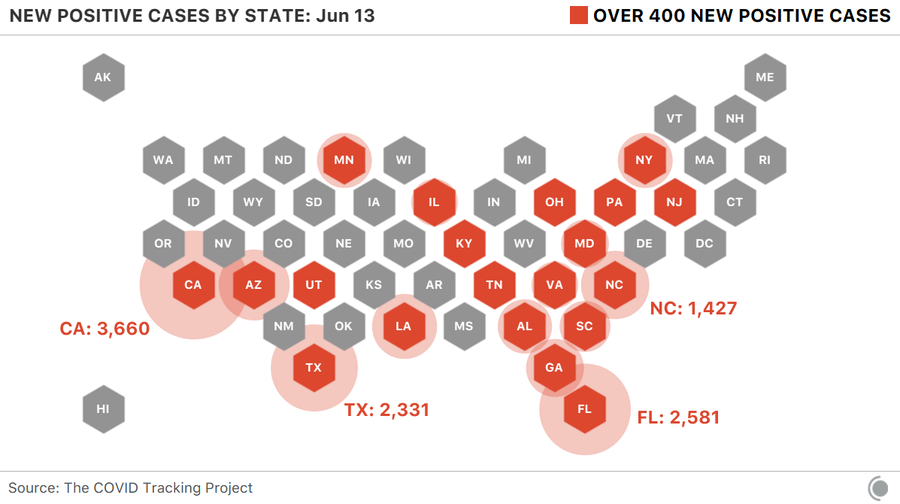
My home state of Florida is now, unfortunately, trending in the wrong direction. I pointed it out with some fellow money manager friends last week of a potential breakout in the trend and it has since trended higher for a meaningful and material breakout. No one wants businesses to open and get back to normal more than me, but what is, is. The cases per day is in a strong uptrend. The prior high was 1575 on April 3rd and 1601 on May 16th. Yesterday was 2581. I hope to see this trend down.
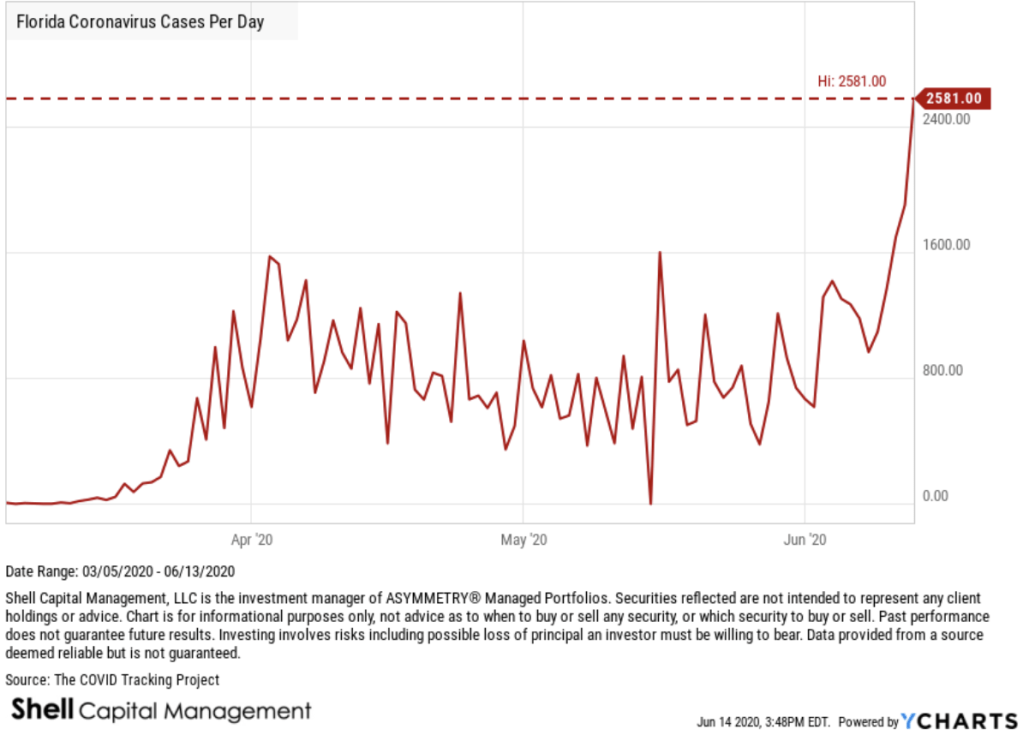
NEW UPTREND IN FLORIDA CASES NOT DRIVEN BY NEW TESTING
The first hypothesis we think of is, well, maybe the uptrend in driven by an increase in testing. Naturally, increasing the absolute testing also should increase the number of positive tests. That isn’t the case. The high in testing was May 20th in Florida. The testing per day remains materially below that level according to the most recent data.
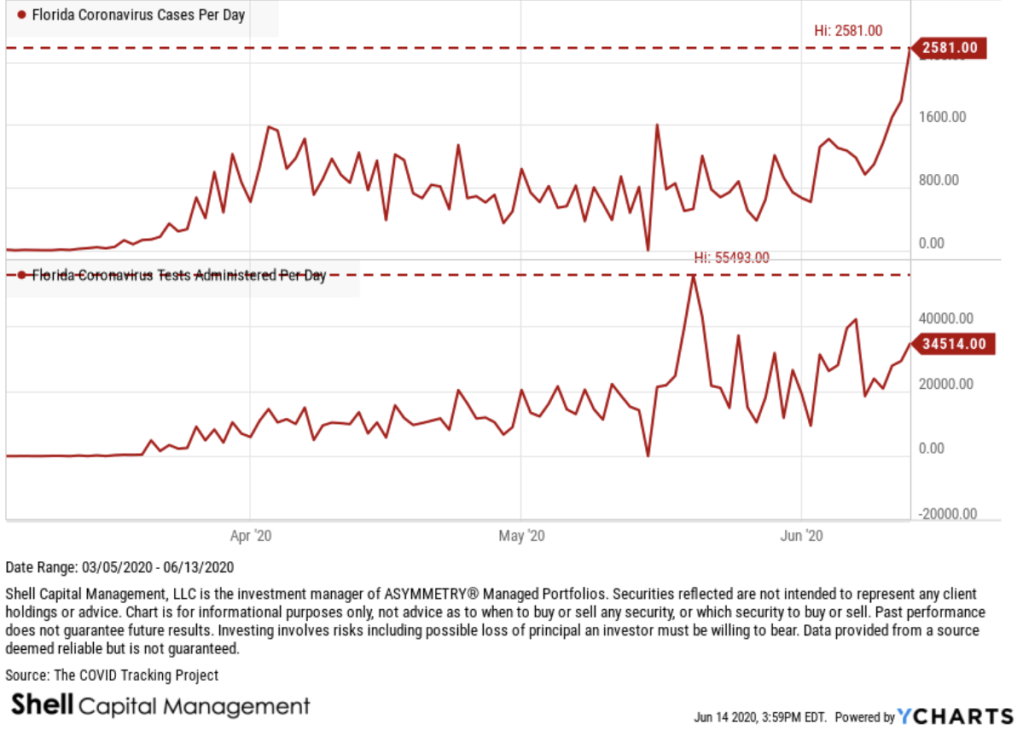
Keep in mind, the lower line is tests administered per day, so there is a lag between testing and the classification of a positive case. In fact, there are natural lags in all of this data. For example, I don’t expect to see the results of the protests until a week or two afterward to account for the lag in showing symptoms, going to get tested, and getting the test results. If there is any increase in the protesting areas, we’ll hear about it next week or later.
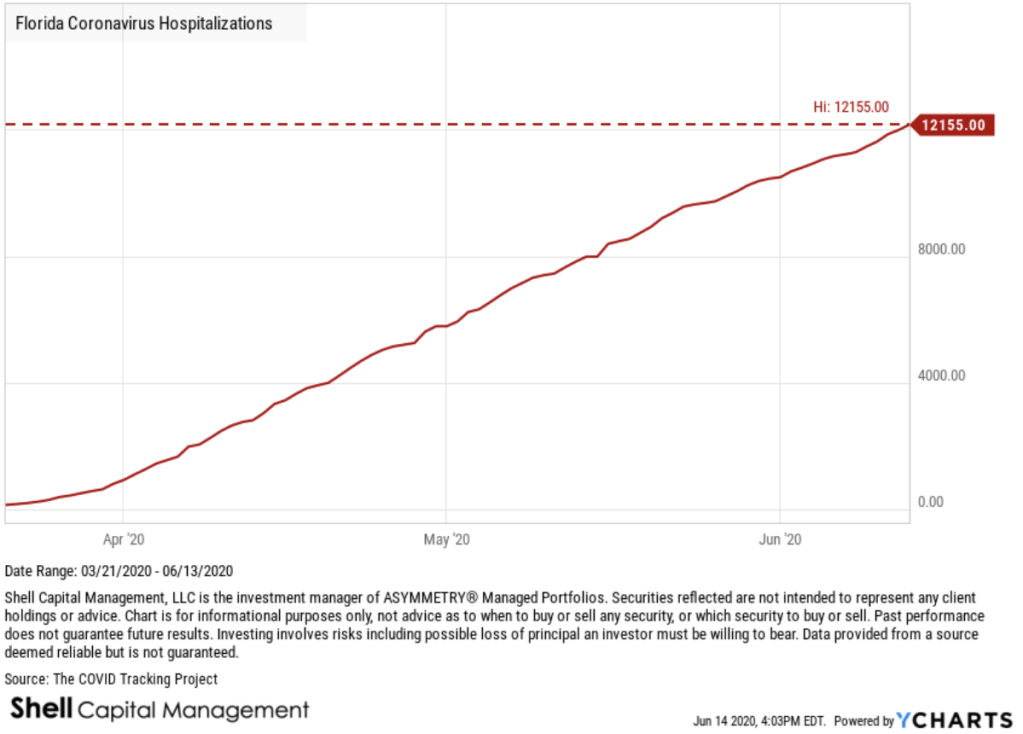
FLORIDA COVID 19 HOSPITALIZATIONS AT AN ALL TIME HIGH
Not much to add here. It is what it is.
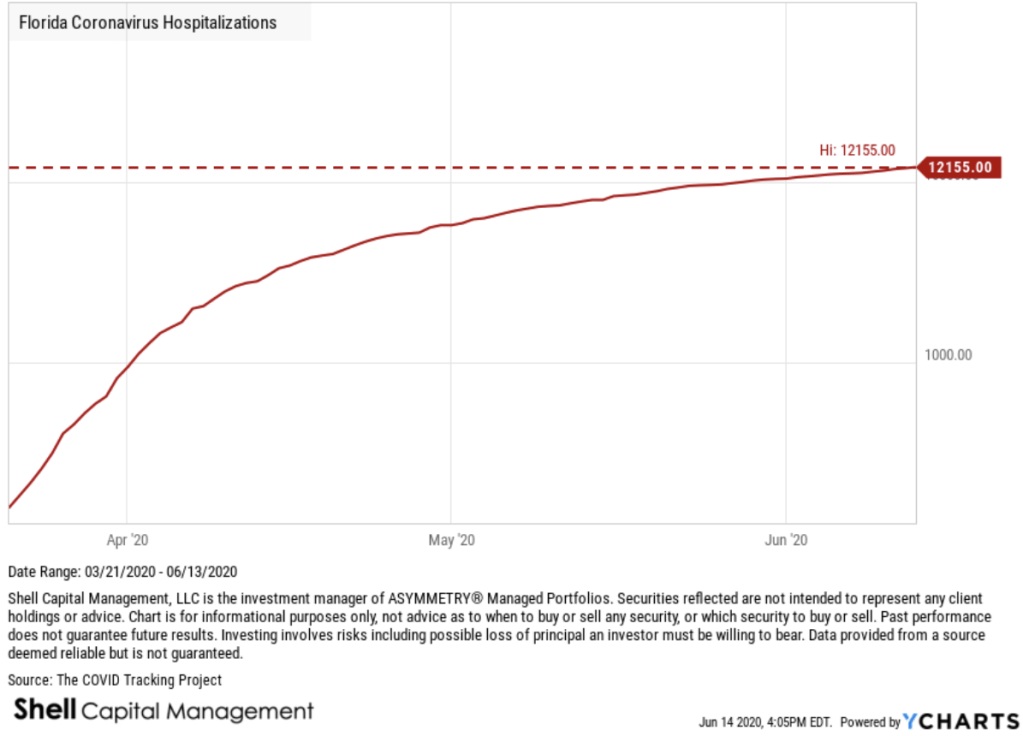
I can try to make it seem better with a logarithmic based chart, which draws the chart in a way that two equal percent changes are plotted as the same vertical distance on the scale. It visually normalizes the rate of change. The good news is the rate of change overall is slowing. The bad news is this could look like an S-curve later, which would be typical of a spread.
By the way, here is the log chart of the new cases per day. We normally use a logarithmic chart scale for long term charts to normalize the data especially if I’m comparing it to something else where relative strength (rate of change) is measured. But here, we still see a breakout in rate of change. So, it’s a material breakout in my opinion, but I hope it breaks down.
Unfortunately, three of the new uptrends are in states were we have clients; Florida, California, and Texas. Next up is Texas.
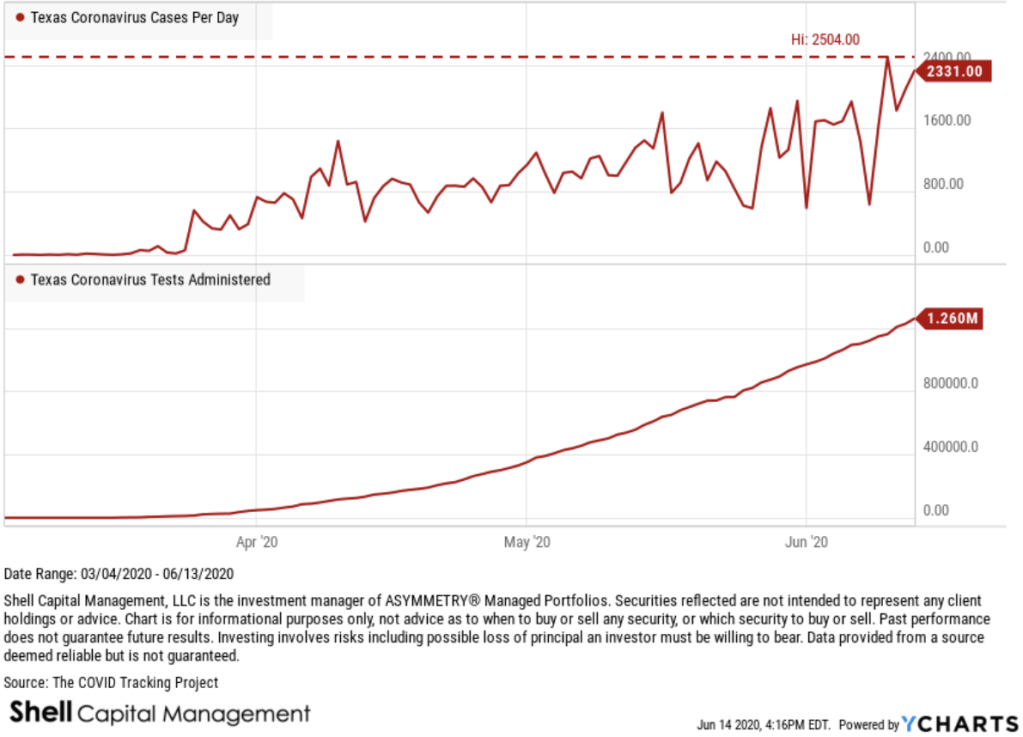
TEXAS COVID 19 UPTREND
New cases in Texas is trending up to all time highs. I think Houston, Texas is now at risk of another stay-at-home order.
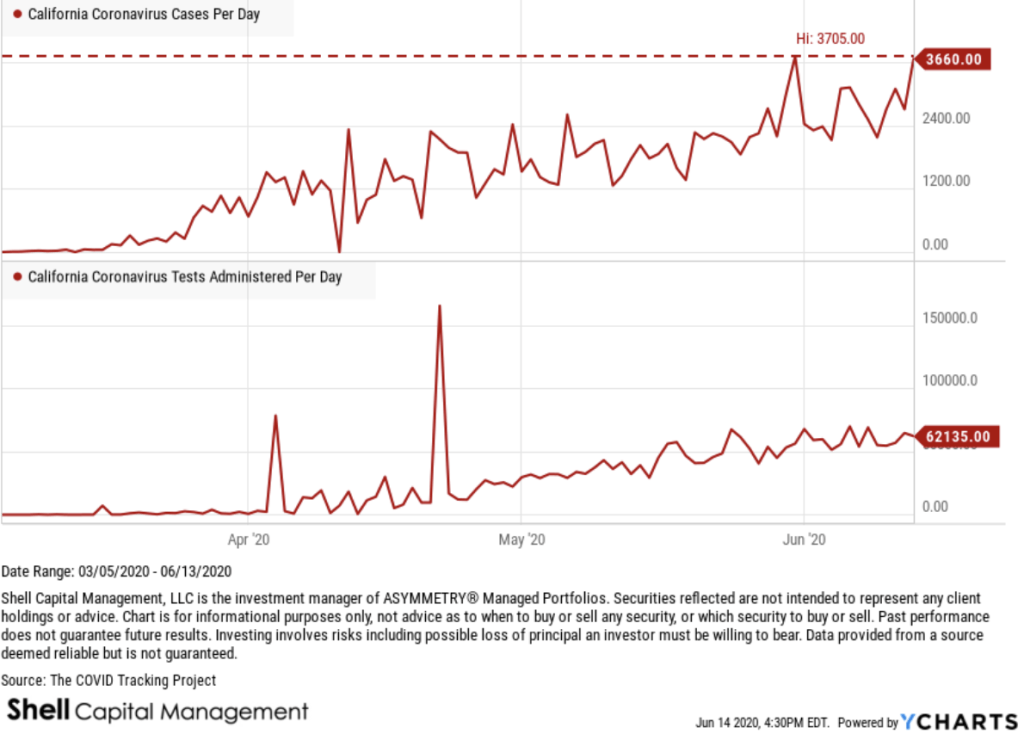
CALIFORNIA COVID 19 TREND
California new cases per day has trended up to the all time high again. It doesn’t seem to be in direct result of more testing per day, either.
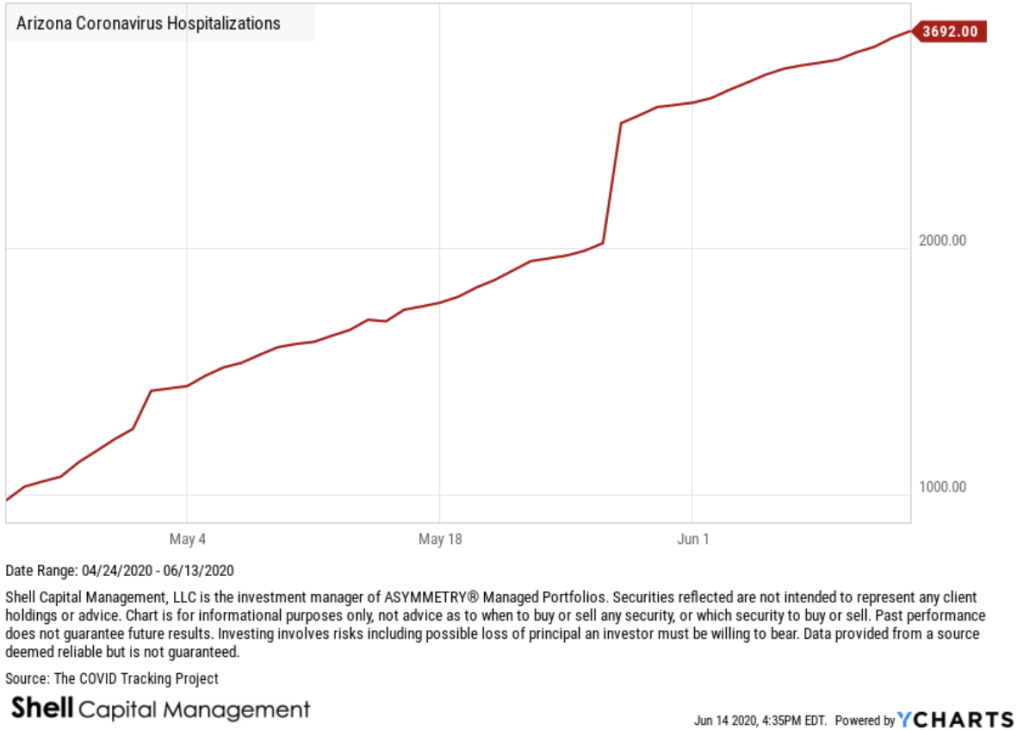
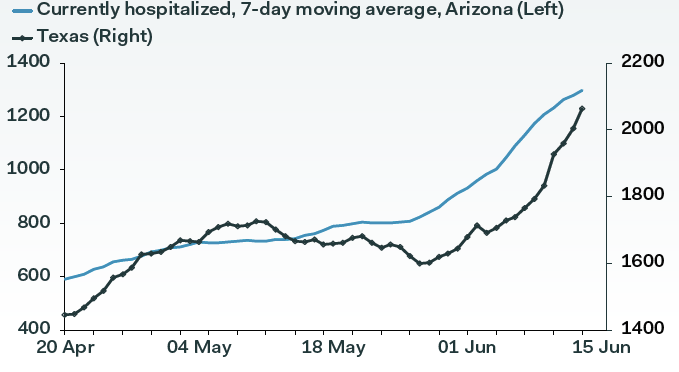
ARIZONA COVID 19 CASES AT NEW HIGH
Arizona is at a high in new daily cases reported, but also in tests per day. The trouble in Arizona is the material new uptrend in hospitalizations.
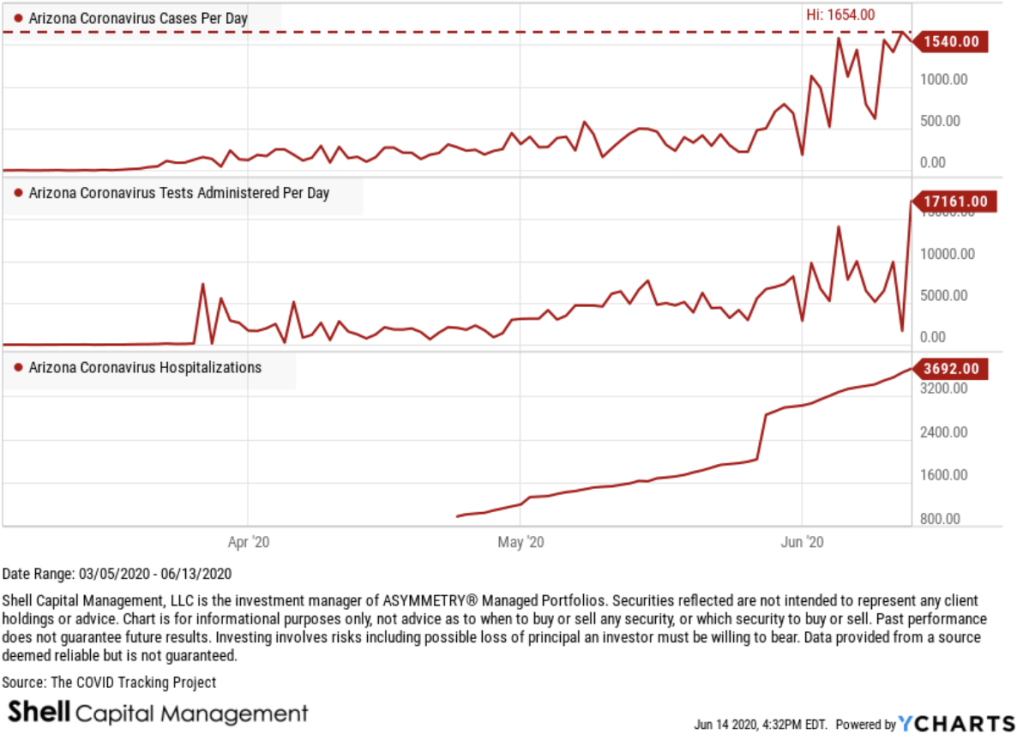
The momentum in hospitalizations in Arizona is a real problem, and I’m using a logarithmic scale below, but it doesn’t help.
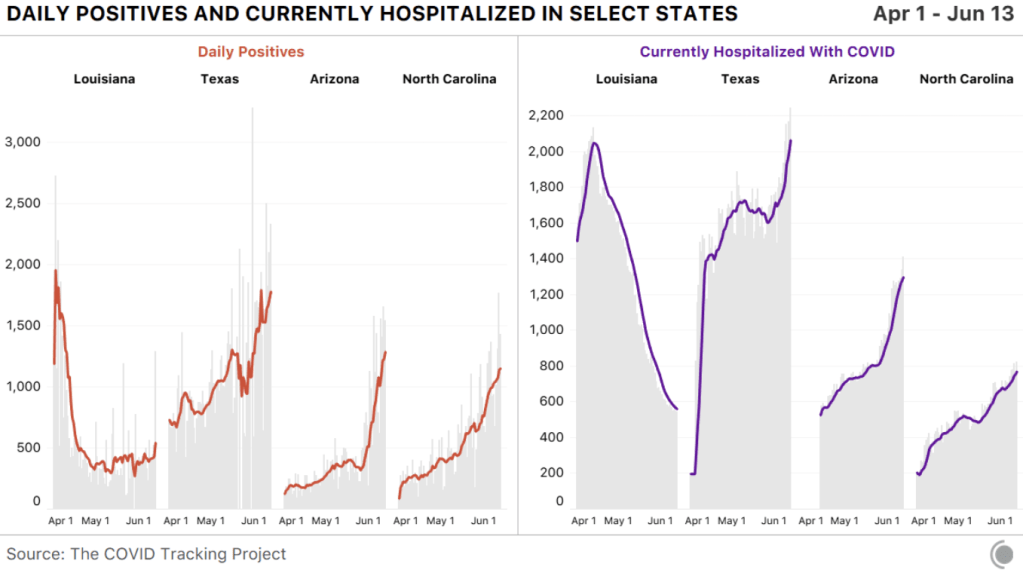
So, we are seeing new hospitalization highs in Texas, Arizona, and North Carolina. We’re showing Louisiana here as well for context, since it had an early COVID-19 outbreak.
We saw 3 states report more than 2,000 cases yesterday: California, Florida, and Texas. A picture speaks a thousand words.
COVID HAS HIT THE NORTH MUCH HARDER THAN THE SOUTH
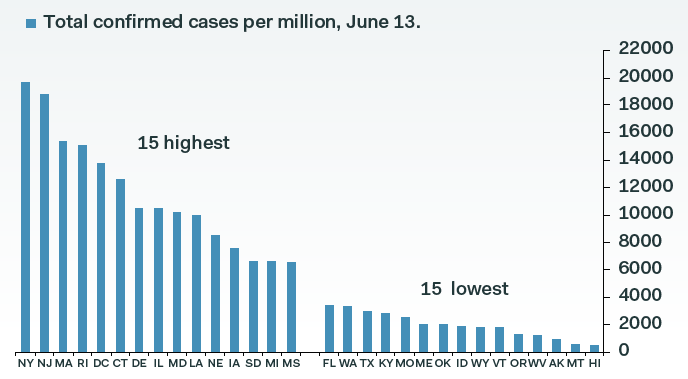
But the South is now seeing a surge in cases…
And it doesn’t seem to be an increase in testing.
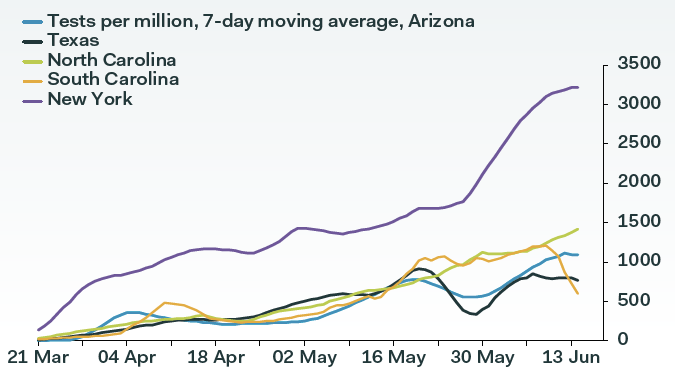
Can hospitalizations keep falling if cases are rising?
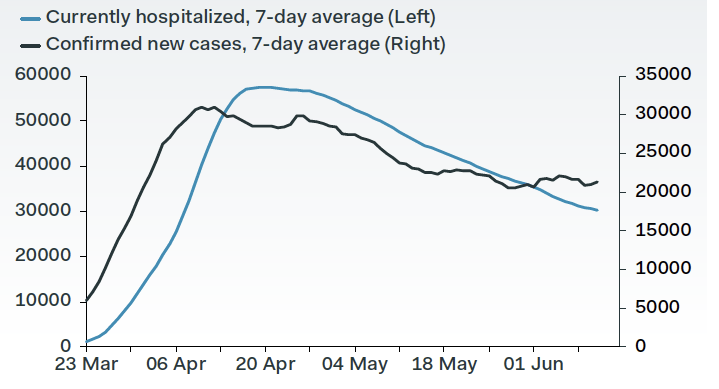
Because hospitalizations are rising rapidly in some Southern states.

I expect we’ll be hearing a lot about these new high breakouts in Arizona, Florida, Texas, and California. All of which, by the way, are the hottest and most humid states in the U.S., so much for the heat and humidity killing the virus.
What we have here is, a a notable uptrend across the South. I hope to see it fade, but based on what I’m seeing, it’s more likely to continue. Only time will tell.
If you are at risk, I recommend remaining cautious, wearing the dang mask, and treating this virus with respect.
Speaking of the scientific method used for decision-making.
If you want to get as technical as possible, here’s some homework for the wannabe scientists and armchair mathematicians who really want to get into the maths of the matter. The virus has sparked a lot of important debates around the globe among though leaders. As researchers, we argue and debate our beliefs in hopes to gain new knowledge. One of the most heated public debates has been Taleb and Ioannidis.
The International Journal of Forecasting (IJF) is organizing a special section devoted to “Epidemics and forecasting with focus on COVID-19”. Based on their blog posts, John P. Ioannidis and Nassim N. Taleb will be given the opportunity to think of each other’s arguments about the COVID data and how to use it. Consequently, they will both be invited to write a full paper to better detail their views and why they think the opposite side’s views may not be adequate under the current circumstances. These opinion papers will then appear in the IJF, after scientific review by their peers. IJF should reserve the right to publish a closure based on this debate. This debate will not only allow us to better understand the points of view of the two great scientists but be also left as a guide for how to deal with future pandemics.
Nassim N. Taleb believes that all efforts and resources should be directed to halt its spread and reduce the number of infected and deaths without any concern about forecasting its future course as the uncertainty of doing so cannot be measured and the risks involved are highly asymmetric. See “On single point forecasts for fat tailed variable by Nassim Nicholas Taleb.”
John P. Ioannidis, on the other hand, claims that more reliable information is needed to make multiple billion-dollar decisions and that forecasting has failed us by being too pessimistic about the future growth of the pandemic and by exaggerating its negative effects. See “Forecasting for COVID-19 has failed”
Both of their observations are well worth a read.
In addition to the equity markets entering a higher risk level of a drawdown and volatility expansion, we now have a renewed risk of the scary COVID narrative driving more fear.
Mike Shell is the Founder and Chief Investment Officer of Shell Capital Management, LLC, and the portfolio manager of ASYMMETRY® Global Tactical. Mike Shell and Shell Capital Management, LLC is a registered investment advisor focused on asymmetric risk-reward and absolute return strategies and provides investment advice and portfolio management only to clients with a signed and executed investment management agreement. The observations shared on this website are for general information only and should not be construed as advice to buy or sell any security. Securities reflected are not intended to represent any client holdings or any recommendations made by the firm. Any opinions expressed may change as subsequent conditions change. Do not make any investment decisions based on such information as it is subject to change. Investing involves risk, including the potential loss of principal an investor must be willing to bear. Past performance is no guarantee of future results. All information and data are deemed reliable but is not guaranteed and should be independently verified. The presence of this website on the Internet shall in no direct or indirect way raise an implication that Shell Capital Management, LLC is offering to sell or soliciting to sell advisory services to residents of any state in which the firm is not registered as an investment advisor. The views and opinions expressed in ASYMMETRY® Observations are those of the authors and do not necessarily reflect a position of Shell Capital Management, LLC. The use of this website is subject to its terms and conditions.

You must be logged in to post a comment.