ASYMMETRY® Observations are Mike Shell’s observations of investor behavior causing directional price trends, global macro, tactical ETF trading, momentum stock trading, hedging, volatility trading, and risk management that creates asymmetric investment returns. An asymmetric return profile is a risk/reward profile with a positive asymmetry between profit and loss. Mike Shell is the founder of Shell Capital Management, LLC and the portfolio manager of ASYMMETRY® Global Tactical
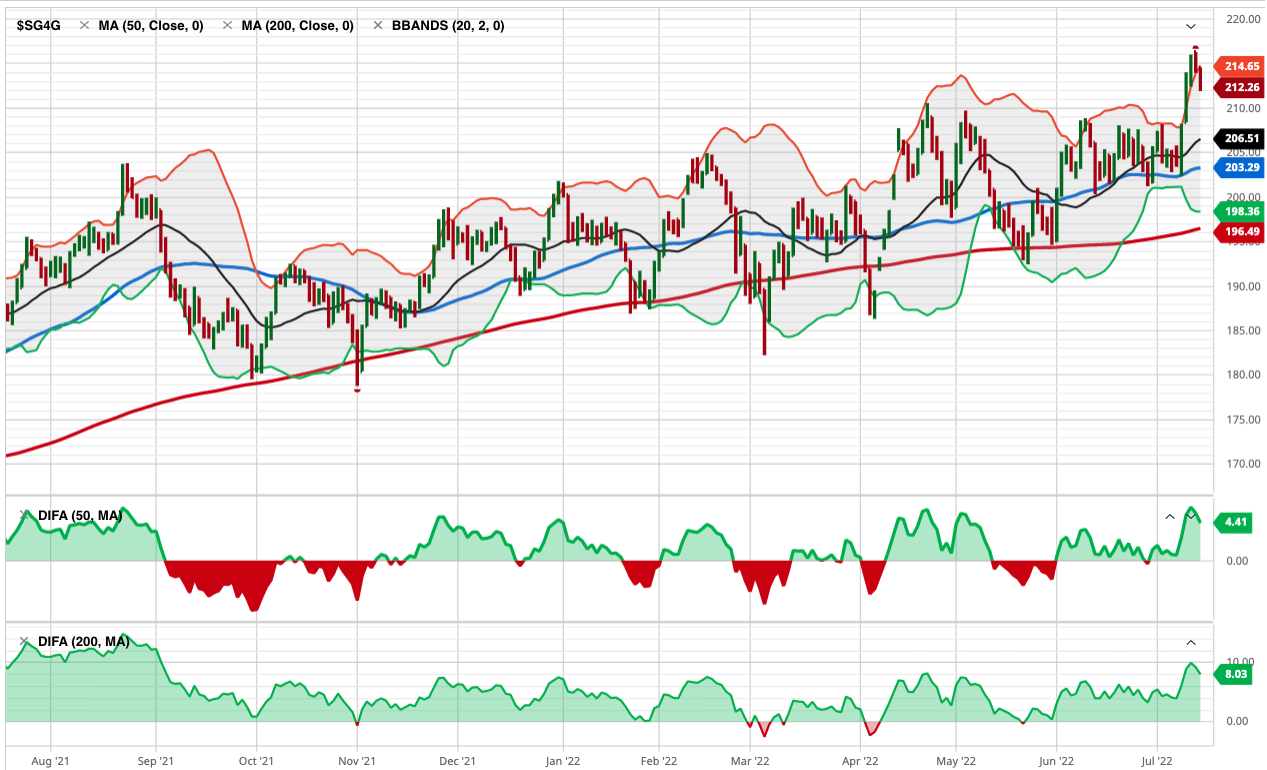
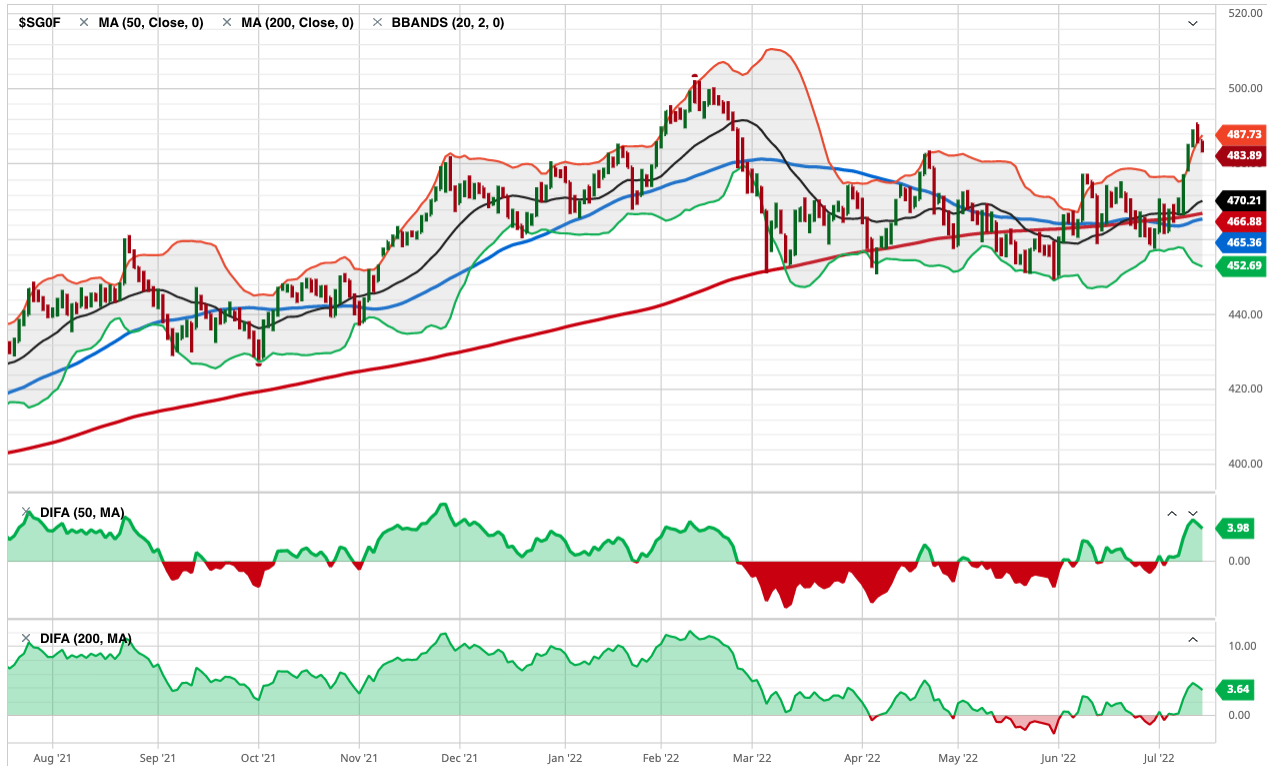
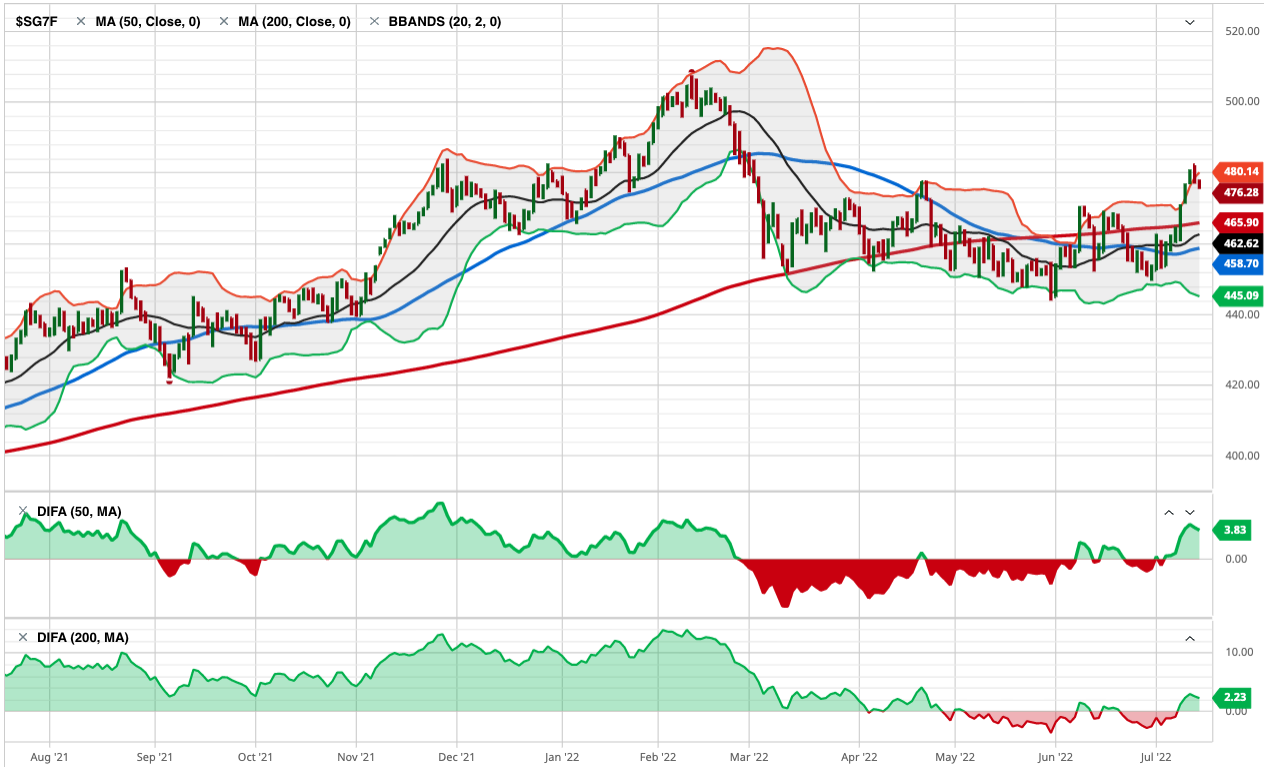
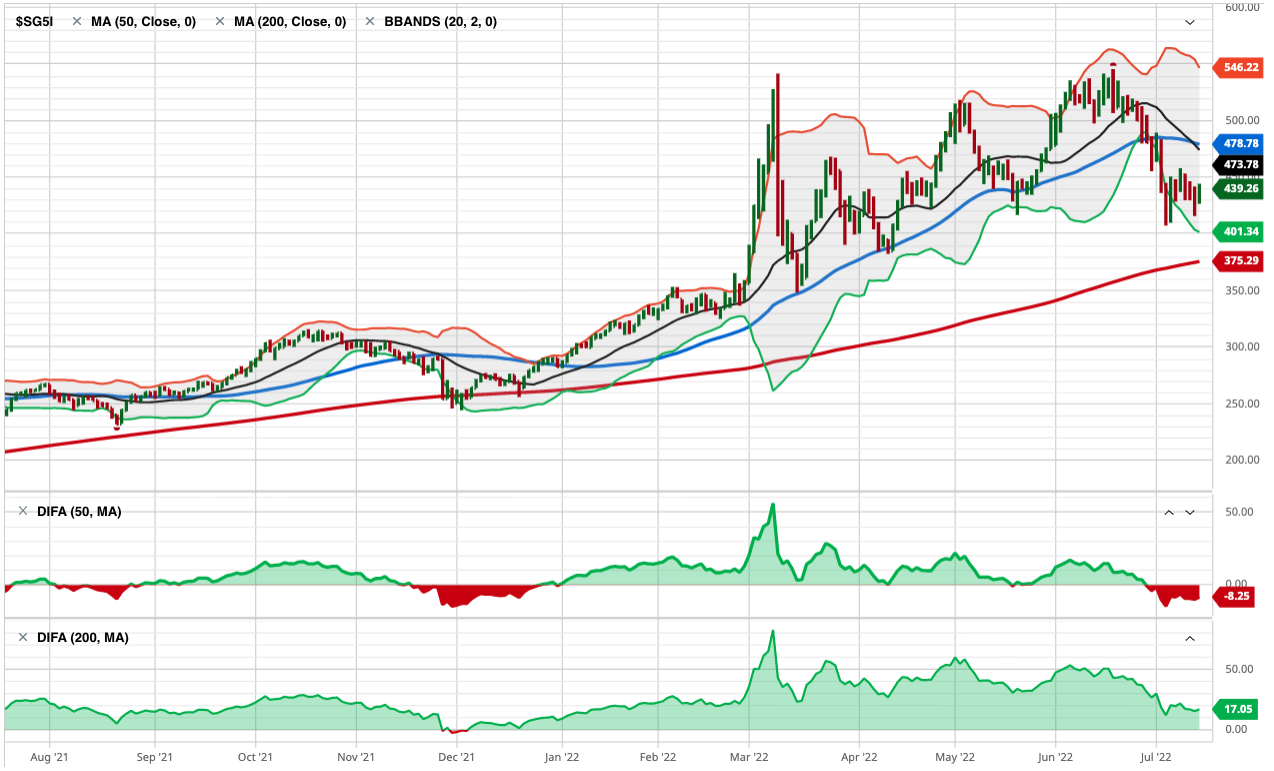
Sector dispersion is a gift to the asymmetric investor. When sectors diverge this sharply in trend, volatility, and valuation, the environment rewards those who are willing to rotate tactically and structure trades to capture exponential upside while controlling downside risk. We may use this data to identify setups with capped downside and high upside optionality—hallmarks of true asymmetry.
When industry performance disperses this widely, the opportunity for asymmetric positioning multiplies. Whether through long/short pairs, structured options, or sector rotation with predefined exits, we may use this dashboard data to seek positive asymmetry—capping downside while preserving exponential upside. At Shell Capital, this is the edge we pursue in dynamic markets.
You wouldn’t know it from watching the VIX index alone, but something interesting is happening beneath the surface. The VIX futures curve — the structure that really drives volatility-linked products like VXX, VIXY, and UVXY — is showing signs of indecision. Here’s what it means for asymmetric hedging.
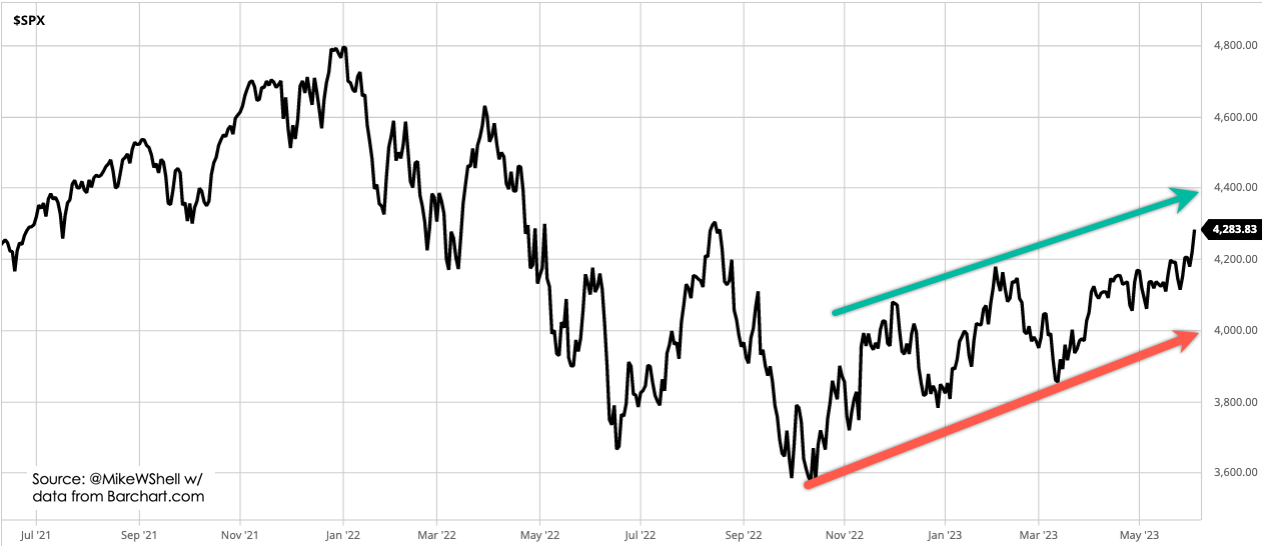
The stock market is a constant battle between buying pressure and selling pressure, and recently, that battle has shifted in a meaningful way. After a strong rally earlier in the year, we’ve now seen a notable change in the risk/reward asymmetry. Markets don’t move in a straight line, and shifts in trend strength often signal the potential for new opportunities—or new risks. Read more: The Stock Market Risk/Reward Asymmetry Has Shifted
Ray Dalio and Elon Musk see the U.S. debt problem for what it is: an unsustainable ticking time bomb.They aren’t just speculating—they’re using decades of experience in finance, economics, and business to sound the alarm.And when two of the sharpest minds in their fields are saying the same thing, it’s time to connect the dots.
Howard Marks has a unique ability to distill complex market dynamics into clear, actionable insights, and his latest memo, “On Bubble Watch,” is no exception. It’s a powerful reminder of the importance of recognizing the telltale signs of a market bubble, the psychology driving it, and the necessary caution that comes with it.
The ICE BofA US High Yield Index Option-Adjusted Spread (OAS) is a key measure of risk sentiment in the credit markets. Historically, extreme levels in credit spreads have preceded major shifts in market conditions, often serving as a leading indicator for broader financial stress or recovery.
Today, as we find ourselves in one of the tightest credit spread environments in decades, it’s worth asking: Are investors underpricing risk, and does it present an asymmetric opportunity?
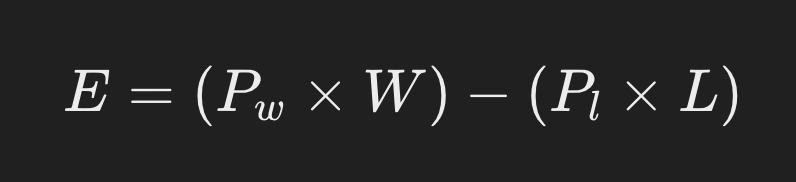
For more than two decades, I’ve required a mathematical basis to maintain confidence in my decisions, especially during challenging periods inherent in every investment or trading strategy.
Many investors believe they are pursuing asymmetric opportunities when they buy stocks they think are undervalued or have more upside than downside.
But true asymmetry isn’t just about perceived valuation gaps—it’s about structuring risk in a way that limits the downside while allowing for uncapped or asymmetric upside.
The reality is, just buying a stock you think is undervalued doesn’t create asymmetry.
It may offer potential upside, but if there’s no predefined risk management, the downside remains open-ended.
Asymmetry isn’t about hoping you’re right—it’s about ensuring that even if you’re wrong, the damage is controlled, and if you’re right, the reward is exponentially greater.
The Flawed Assumption of “Undervalued” Stocks
Many investors assume they have an asymmetric opportunity when they buy a stock trading below what they believe to be its intrinsic value.
The thinking goes:
The downside is “limited” because the stock is already cheap.
The upside is large because the market will eventually recognize its value.
The problem?
Cheap stocks can get cheaper, and markets don’t always correct “mispricings” in a timely manner—if ever.
Many deep-value stocks stay undervalued for years, and some go to zero.
Buying something just because it “should” go up does nothing to limit risk.
A true asymmetric investment isn’t just about identifying opportunities with more upside than downside—it’s about structuring the position to ensure a capped downside and disproportionate upside.
There are several ways we do this:
Options Strategies: Buying call options allows for defined risk (the premium paid) with unlimited upside potential. Likewise, strategies like risk reversals or spreads can enhance asymmetry.
Stop-Losses & Exit Strategies: Setting a predefined exit point ensures the downside is controlled rather than open-ended.
Hedging & Position Sizing: Using hedges or maintaining proper position sizing ensures that no single position can derail a portfolio.
The Key Difference: Hope vs. Structure
The key distinction is that just buying something undervalued is based on hope, while structuring asymmetric trades is about controlling risk.
Hope is not a strategy—a predefined downside is.
If you enter a trade where: 1. Downside is capped (through predefined exits or contractual limits like options). 2. Upside is uncapped or exponentially larger (through compounding, leverage, or event-driven catalysts). 3. The approach is repeatable (not relying on luck but a systematic framework).
Then you are truly executing an asymmetric strategy.
But the process of creating asymmetric investment returns doesn’t stop there; it continues at the portfolio level.
Conclusion: Asymmetry Is Intentional, Not Accidental
Simply believing a stock has more upside than downside does not create asymmetric risk/reward—it’s just a market opinion. Asymmetry must be structured in advance, not assumed after the fact.
For investors who seek true asymmetric payoffs, the focus shouldn’t just be on finding “cheap” stocks but on structuring trades where the worst-case scenario is predefined and limited while the best-case scenario remains disproportionately large.
That’s the difference between hoping for a high return and engineering an asymmetric edge like we do.
Volatility in general, and VIX in particular, is widely thought to influence hedge fund returns. This article shows that not only is VIX negatively correlated to hedge fund returns, the correlation profile is asymmetric with the correlation being more negative in negative months for hedge funds. When hedge funds are delivering the worst quartile returns, the diversification benefit is best. Equally interestingly, when the diversification or protection is least needed, i.e. in highest quartile months, the correlation is positive. It is explored whether a small allocation to VIX can be constructively used for risk reduction or downside protection in broad based hedge fund portfolios. Standard mean variance measures suggest a static allocation of 0% to 10%, which is consistent with the common sense approach of allocation only a very small portion of the portfolio to volatility. This range, together with the mean reverting property of VIX, and the asymmetric correlation of VIX and hedge fund returns is used to explore a tactical allocation strategy that outperforms a simple static allocation of VIX or a portfolio with no VIX allocation on a risk adjusted basis, while reducing downside risks.
Asymmetry isn’t just about asymmetric risk/reward for asymmetric investment returns, it’s also the probability of one outcome over another when it’s skewed.
Up until now, the trend S&P 500 index has failed to break above the 4200 level.
I highlighted 4200 in yellow on the chart to point out the SPX has trended around 4200 several times over the last two years, but until this week, these higher levels were met with selling pressure. The selling pressure was enough to provide overhead resistance, selling pressure not allowing the index to move to a higher high.
Such resistance is caused by investors and traders who may have been trapped at lower prices after adding exposure around this level.
Once the index gets back to the level it tapped multiple times, those who wished they’d sold sooner (before the down-trends below 4200) sell to break even.
But that’s just one example of the thinking behind the concept of resistance from selling pressure preventing a new high breakout.
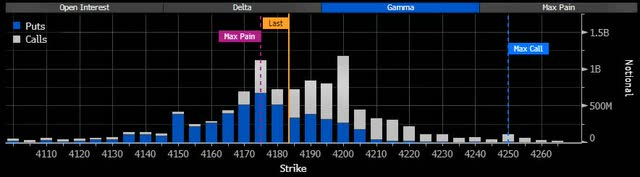
Another resistance has been a large wall of call options.
A Call Wall is the strike with the largest net call option gamma. Market maker (dealer) positioning can create some of the biggest resistance levels and holds a lot of the time when a Call Wall defines the upper boundary of the probable range.
Below is a recent example. The grey bars are a lot of call options on the SPX.
We expect the price to slow down as it reaches the Call Wall level, but it sometimes trends above it, then drifts back below within a few days. So, it takes more than a few days to confirm the wall of calls has increased to a higher level.
No market analysis is ever perfect.
It’s always probabilistic, never a sure thing.
Call Walls can have a sticky gamma effect, making it difficult for the price to break out. When market makers are long gamma, it accelerates their directional exposure favorably as the size of their positions dynamically increases when they are positioned in the right direction creating an open profit. When these designated market makers have a large profit from being positioned on the correct side of the trend, they can sell some of the underlying positions (like SPX) to get their directional exposure closer to neutral and realize a profit. That’s why market makers trade in the opposite direction of the underlying (like SPX) when they are positive gamma, and this suppresses volatility and creates a pin.
So, up until now, the large Call Wall at 4200 was hard to break out of because there are so many calls the dealers were hedging and/or taking profits as the level was reached.
This form of derivatives resistance matched up with the aforementioned technical trend resistance can create a formidable overhead supply of sellers.
The selling pressure has been enough to mute the SPX, for now.
But, looking at the SPX today, up 1.5% to 4286 as of the time of this writing, the index is pushing up and may be enough to clear out all this overhang.
What could go wrong?
There is no shortage of negative macro risks, but that’s beyond the scope of this technical observation.
Interestingly, today I noticed a very bullish flow into VIX options betting on a volatility expansion with VIX down to 14.80 for the first time since 2021.
Meanwhile, the VIX term structure is 11% contango between July and June, so ETFs like VXX are rolling from 16.8 to 18.7 (aka selling low, buying high) which is a headwind even if VIX spikes.
So, the stock market index is trending up and trying to print higher highs and higher lows, and implied (expected) volatility is contracting.
Can the S&P 500 gain enough momentum to keep trending up?
One way to view the directional trend is the price channel the stock index is creating. with higher lows and higher highs.
I see this and wonder if the SPX will reach the 4400 level it’s trending toward.
To see if it has enough momentum left to move up that far, I look at recent velocity.
Its relative strength suggests it could move up enough to tap the 4300 level before it starts to get overbought, but then it will be overbought.
So, 4400 may be a resistance without a flat base or ~5% correction.
Only time will tell if the Call Wall, expirations, and long-vol positioning today has more impact or if there’s enough momentum to drive it higher, but we’ll be watching to see how it all unfolds.
Mike Shell is the founder and Chief Investment Officer of Shell Capital Management, LLC, and the portfolio manager of ASYMMETRY® Managed Portfolios. Mike Shell and Shell Capital Management, LLC is a registered investment advisor focused on asymmetric risk-reward and absolute return strategies and provides investment advice and portfolio management only to clients with a signed and executed investment management agreement. The observations shared on this website are for general information only and should not be construed as investment advice to buy or sell any security. This information does not suggest in any way that any graph, chart, or formula offered can solely guide an investor as to which securities to buy or sell, or when to buy or sell them. Securities reflected are not intended to represent any client holdings or recommendations made by the firm. In the event any past specific recommendations are referred to inadvertently, a list of all recommendations made by the company within at least the prior one-year period may be furnished upon request. It should not be assumed that recommendations made in the future will be profitable or will equal the performance of the securities on the list. Any opinions expressed may change as subsequent conditions change. Please do not make any investment decisions based on such information, as it is not advice and is subject to change without notice. Investing involves risk, including the potential loss of principal an investor must be willing to bear. Past performance is no guarantee of future results. All information and data are deemed reliable but are not guaranteed and should be independently verified. The presence of this website on the Internet shall in no direct or indirect way raise an implication that Shell Capital Management, LLC is offering to sell or soliciting to sell advisory services to residents of any state in which the firm is not registered as an investment advisor. The views and opinions expressed in ASYMMETRY® Observations and Asymmetric Investment Returns are those of the authors and do not necessarily reflect the position of Shell Capital Management, LLC. The use of this website is subject to its terms and conditions.
Bridgewater Associates, Inc.Co-CIO Karen Karniol-Tambour joins Positive Sum CEO Patrick O’Shaughnessy at the 2023 Sohn Investment Conference. Below is the interview she says the market is very asymmetric right now because of the asymmetry between the upside vs. the downside, and I agree.
I’ll summarize:
If the economy enters a recession, it’s very bad for stocks, and this time the Fed is unlikely to immediately respond by lowering rates since inflation is a problem. So, the downside risk is large. It’s already priced-in to the stock market, so it won’t be a big surprise. Not a lot of upside potential.
If the economy doesn’t enter a recession, the Fed will be in a tough decision point, because inflation is unlikely to come down without a recession. If the Fed doesn’t ease like it’s already price-in, the market is going to be disappointed.
It’s asymmetric because the downside potential is greater than the upside.
The interview:
Patrick O’Shaughnessy:
What do you think that prevailing valuations, let’s say, just on like the big asset classes tell us about what the market thinks is going on? Like, what does it seem like is in prices right now, if you will, as you look at S&P 500 you know, multiples or something very basic like that?
Bridgewater Co-CIO Karen Karniol-Tambour:
WellI think the stock market is telling you that there’s going to be a modest economic slowdown, a pretty contained economic slowdown, nothing like you know a significant recession or anything like that, With that slowdown alone, the Federal Reserve is going to find that sufficient to go ease from you know, 5% to 3% extremely quickly, and that its going to do that despite where inflation is today because inflation is going to go back to totally reasonable levels that they want very very quickly. You see that kind of across stock and bond pricing you know bond pricing is telling you in places to be fine we’re not there’s no inflation from anything like resembling long term and the Fed’s about to ease pretty significantly without a significant slowdown.
Where that sort of leaves you is if the market I believe is asymmetric it’s very asymmetric because it you actually get an economic slowdown; that’s obviously very bad for stocks. I don’t have to tell you that that would be you know pretty bad for stocks. But there’s really not much of a recession priced into them it would be pretty bad. Usually the way you get out of that (as I was saying) is that every time there’s a slowdown the Central Bank just comes and eases right away. Now, not only will it be much harder for them to ease because inflation’s been more a problem. Tension is there, but that easing is already priced in and so even if they do kind of bite the bullet and say “I’m not going to worry about inflation” and ease, it’s already in the market prices it’s not going to surprise the market so much.
Then, on the other hand, if the market doesn’t slow, if the economy doesn’t slow so much, if we don’t get that kind of recession if the equity prices are right that you’re not going to get a big recession and the fed’s going to be a tough spot because I don’t really see why inflation’s going to come down with no recession. You have a very very strong labor market if nothing slows and so if they don’t ease like it’s already price they’re going to be disappointing. So, every day once we hit summer the Federal Reserve doesn’t pivot and ease that’s effectively a tightening relative to what’s priced in that’s also disappointing.
That’s a lot of room for disappointment that can happen whether the economy is strong or weak.
Patrick O’Shaughnessy:
That’s all sort of like what I’ll call you know relatively near to intermediate term future how do you think about portfolio positioning in light of that general view when you know like you for a long time it’s paid to just be long risk and have a very simple portfolio because of everything you’ve discussed. How’s that different today like how would you how do you think about positioning against this asymmetric setup that you described
Karen Karniol-Tambour:
I think it’s one of the toughest times to be an investor in many years because you know as you’re saying risk assets has been so good and I think risk assets are about as unattractive as we’ve seen a very long time and they’ve and that’s we’re seeing that come to fruition they don’t just bounce back you don’t just get kind of automatic rallies no matter what so it’s a hard time to be an investor I think as an investor you have to think about diversification in a different way diversification just wasn’t that important because the one asset people hold “equities” was just the strongest outperformer and the different places investors can kind of look they can look at geographically so they can look at geographies that have less of this tension places like Japan or China where you’re in a different situation you’re not about to hit a big Central Bank tension Japanese Central Bankers are pretty excited about getting higher inflation they’ve won for a long time and it’s far from, you know, out of control.
She basically suggests U.S. stocks are overrated and Japan stocks, Emerging Markets stocks, and Gold, are underrated.
“Although the cheetah is the fastest animal in the world and can catch any animal on the plains, it will wait until it is absolutely sure it can catch its prey. It may hide in the bush for a week, waiting for just the right moment.
It will wait for a baby antelope, and not just any baby antelope, but preferably one that is also sick or lame; only then, when there is no chance it can lose its prey, does it attack.
That, to me, is the epitome of professional trading.
When I trade at home, I often watch the sparrows in my garden.
When I feed them bread, they take just a little piece at a time and fly away. They keep on flying back and forth, taking small bits of bread. They may have to make a hundred stabs at a piece of bread to get what a pigeon gets at one time, but that is why a pigeon is a pigeon.
You will never be able to shoot a sparrow, it is just too fast.
That is the way I day trade.
For example, there are times during the day when I am sure that the S&P is going up, but I don’t try to pick the bottom, and I am out before it tops. I just take the mid-range where the momentum is greatest.
Technical indicators get a bad rap among some groups in the quantitative trading profession, but many of the most famous profitable investment managers apply technical indicators to global markets.
According to Cboe, the objective of a strangle is to capture the volatility premium inbedded in option prices, but with less risk than in a straddle, another established premium capture strategy.
I tend to focus on risk management in these occasional observations I share.
My focus is on risk management because that’s my edge.
If I can direct and control my possibility of loss through tactical trading decisions, then I’m left to focus on the upside of profits.
I pinned that on my wall twenty years ago when I was testing asymmetric trading systems for asymmetric risk/reward and asymmetric investment returns.
As I intensely studied the mathematical expectation of trading systems, I concluded the downside drawdown is the part I have the potential to control.
If a position is trending down, I can exit, and reduce my exposure to zero.
I could also use exchange-traded options for defined risk. ie. if I buy a call option for $5 that’s all I can lose if the position doesn’t become profitable.
I could instead place a stop loss exit $5 below the entry price for a similar effect, but the position could gap down $10, and the loss would be larger than the limited call option would have been.
These are the kind of portfolio management decisions we get to choose from as investment portfolio managers.
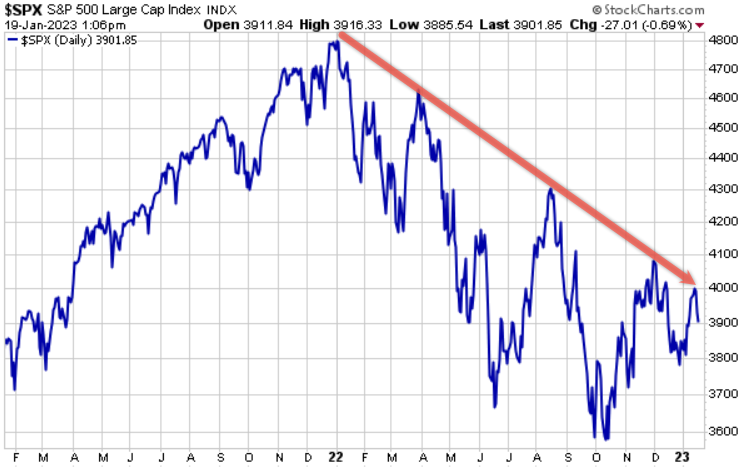
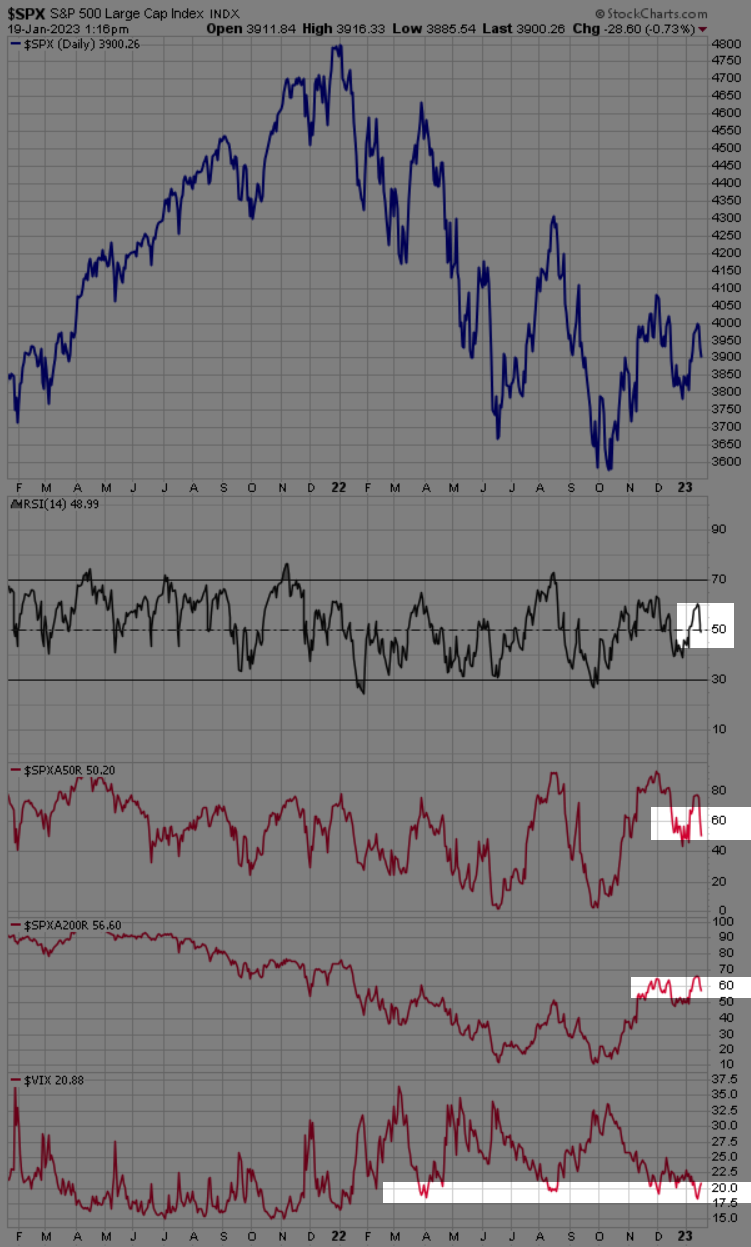
Our issue at hand today is the trendline whipsaw of the stock market index.
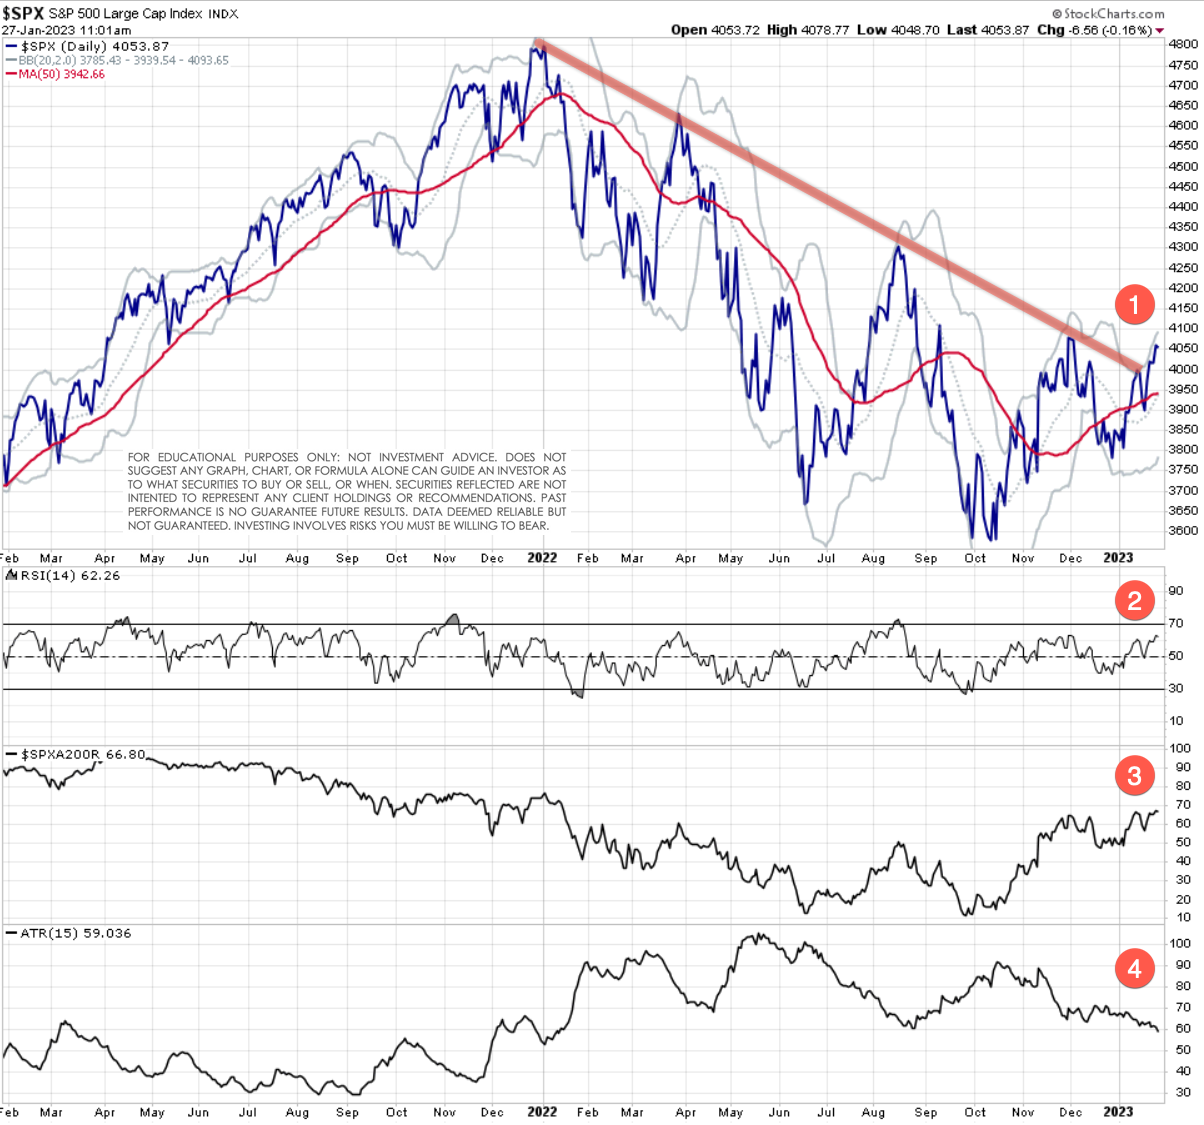
In Stock Market Resumes Downtrend I shared the observation the U.S. stock market as measured by the S&P 500 stock index, has trended down from a lower high.
Here’s the chart:
I went on to point out the stock index wasn’t yet oversold, and the number of stocks in the 500 in an uptrend was trending down.
Trend lines aren’t magic; they’re just a general trend guide.
I wasn’t seeing heavy selling pressure, so I thought “we’ll see.”
Here’s an update. See below for the context of the numbers.
The downtrend line for the S&P 500 is now negated as the stock market has reversed back up and the index easily trended above the trendline and broke out to the upside. This will likely drive some to call the bear market over and suggest a new bull market has begun.
Momentum, as measured by 14-day relative strength, indicates the SPX isn’t yet overbought at 62, and I’d only consider it so above 80. Read: there’s still room to run if it wants. There will be little resistance from velocity moving too far too fast.
The percent of SPX 500 stocks trending above their 200-day moving averages is at 67%, so 33% of the stocks could still trend up, and 67% isn’t a level I consider resistance. That is, if it were at 80% it would indicate most stocks have already trended up, so the desire to buy may be getting exhausted.
The average true range of the past 15 days shows a visual representation that realized volatility is declining. In fact, realized vol has declined to the August 2022 level.
I’ll stop there to keep this succinct.
The bottom line is the stock market was trending down, and it’s now reversed back up into a notable uptrend.
I started with observations of risk management because no indicator is ever perfect, they’ll all imperfect.
When every new moment is unique, and we’ve never been “here” before, anything can happen.
The best we can do is define the direction of the trend and follow it, until it reaches an extreme, or reverses down.
Ironically, as the realized volatility is now as low as it was in August 2022, that’s also when I shared Whipsaw and warned I have a hunch we’re going to hear the word “whipsaw” a lot in the coming months.
For the past year, we’ve survived and thrived through a prolonged bear market that may be much longer and deeper if the U.S. economy enters a recession.
Only time will tell if the U.S. is in a recession, or if we’ll instead see the soft landing our friends at Goldman Sachs expect.
But for now, the U.S. equities trend is back up again, and the Fed’s interest rate decision next week will likely be the driver of what happens next.
I expect 2023 to be a very challenging year for macro economics, and it’ll be fun to watch.
At Shell Capital, we just want to repeat another profitable year like last year, or better.
Mike Shell is the founder and Chief Investment Officer of Shell Capital Management, LLC, and the portfolio manager of ASYMMETRY® Managed Portfolios. Mike Shell and Shell Capital Management, LLC is a registered investment advisor focused on asymmetric risk-reward and absolute return strategies and provides investment advice and portfolio management only to clients with a signed and executed investment management agreement. The observations shared on this website are for general information only and should not be construed as investment advice to buy or sell any security. This information does not suggest in any way that any graph, chart, or formula offered can solely guide an investor as to which securities to buy or sell, or when to buy or sell them. Securities reflected are not intended to represent any client holdings or recommendations made by the firm. In the event any past specific recommendations are referred to inadvertently, a list of all recommendations made by the company within at least the prior one-year period may be furnished upon request. It should not be assumed that recommendations made in the future will be profitable or will equal the performance of the securities on the list. Any opinions expressed may change as subsequent conditions change. Please do not make any investment decisions based on such information, as it is not advice and is subject to change without notice. Investing involves risk, including the potential loss of principal an investor must be willing to bear. Past performance is no guarantee of future results. All information and data are deemed reliable but are not guaranteed and should be independently verified. The presence of this website on the Internet shall in no direct or indirect way raise an implication that Shell Capital Management, LLC is offering to sell or soliciting to sell advisory services to residents of any state in which the firm is not registered as an investment advisor. The views and opinions expressed in ASYMMETRY® Observations are those of the authors and do not necessarily reflect the position of Shell Capital Management, LLC. The use of this website is subject to its terms and conditions.
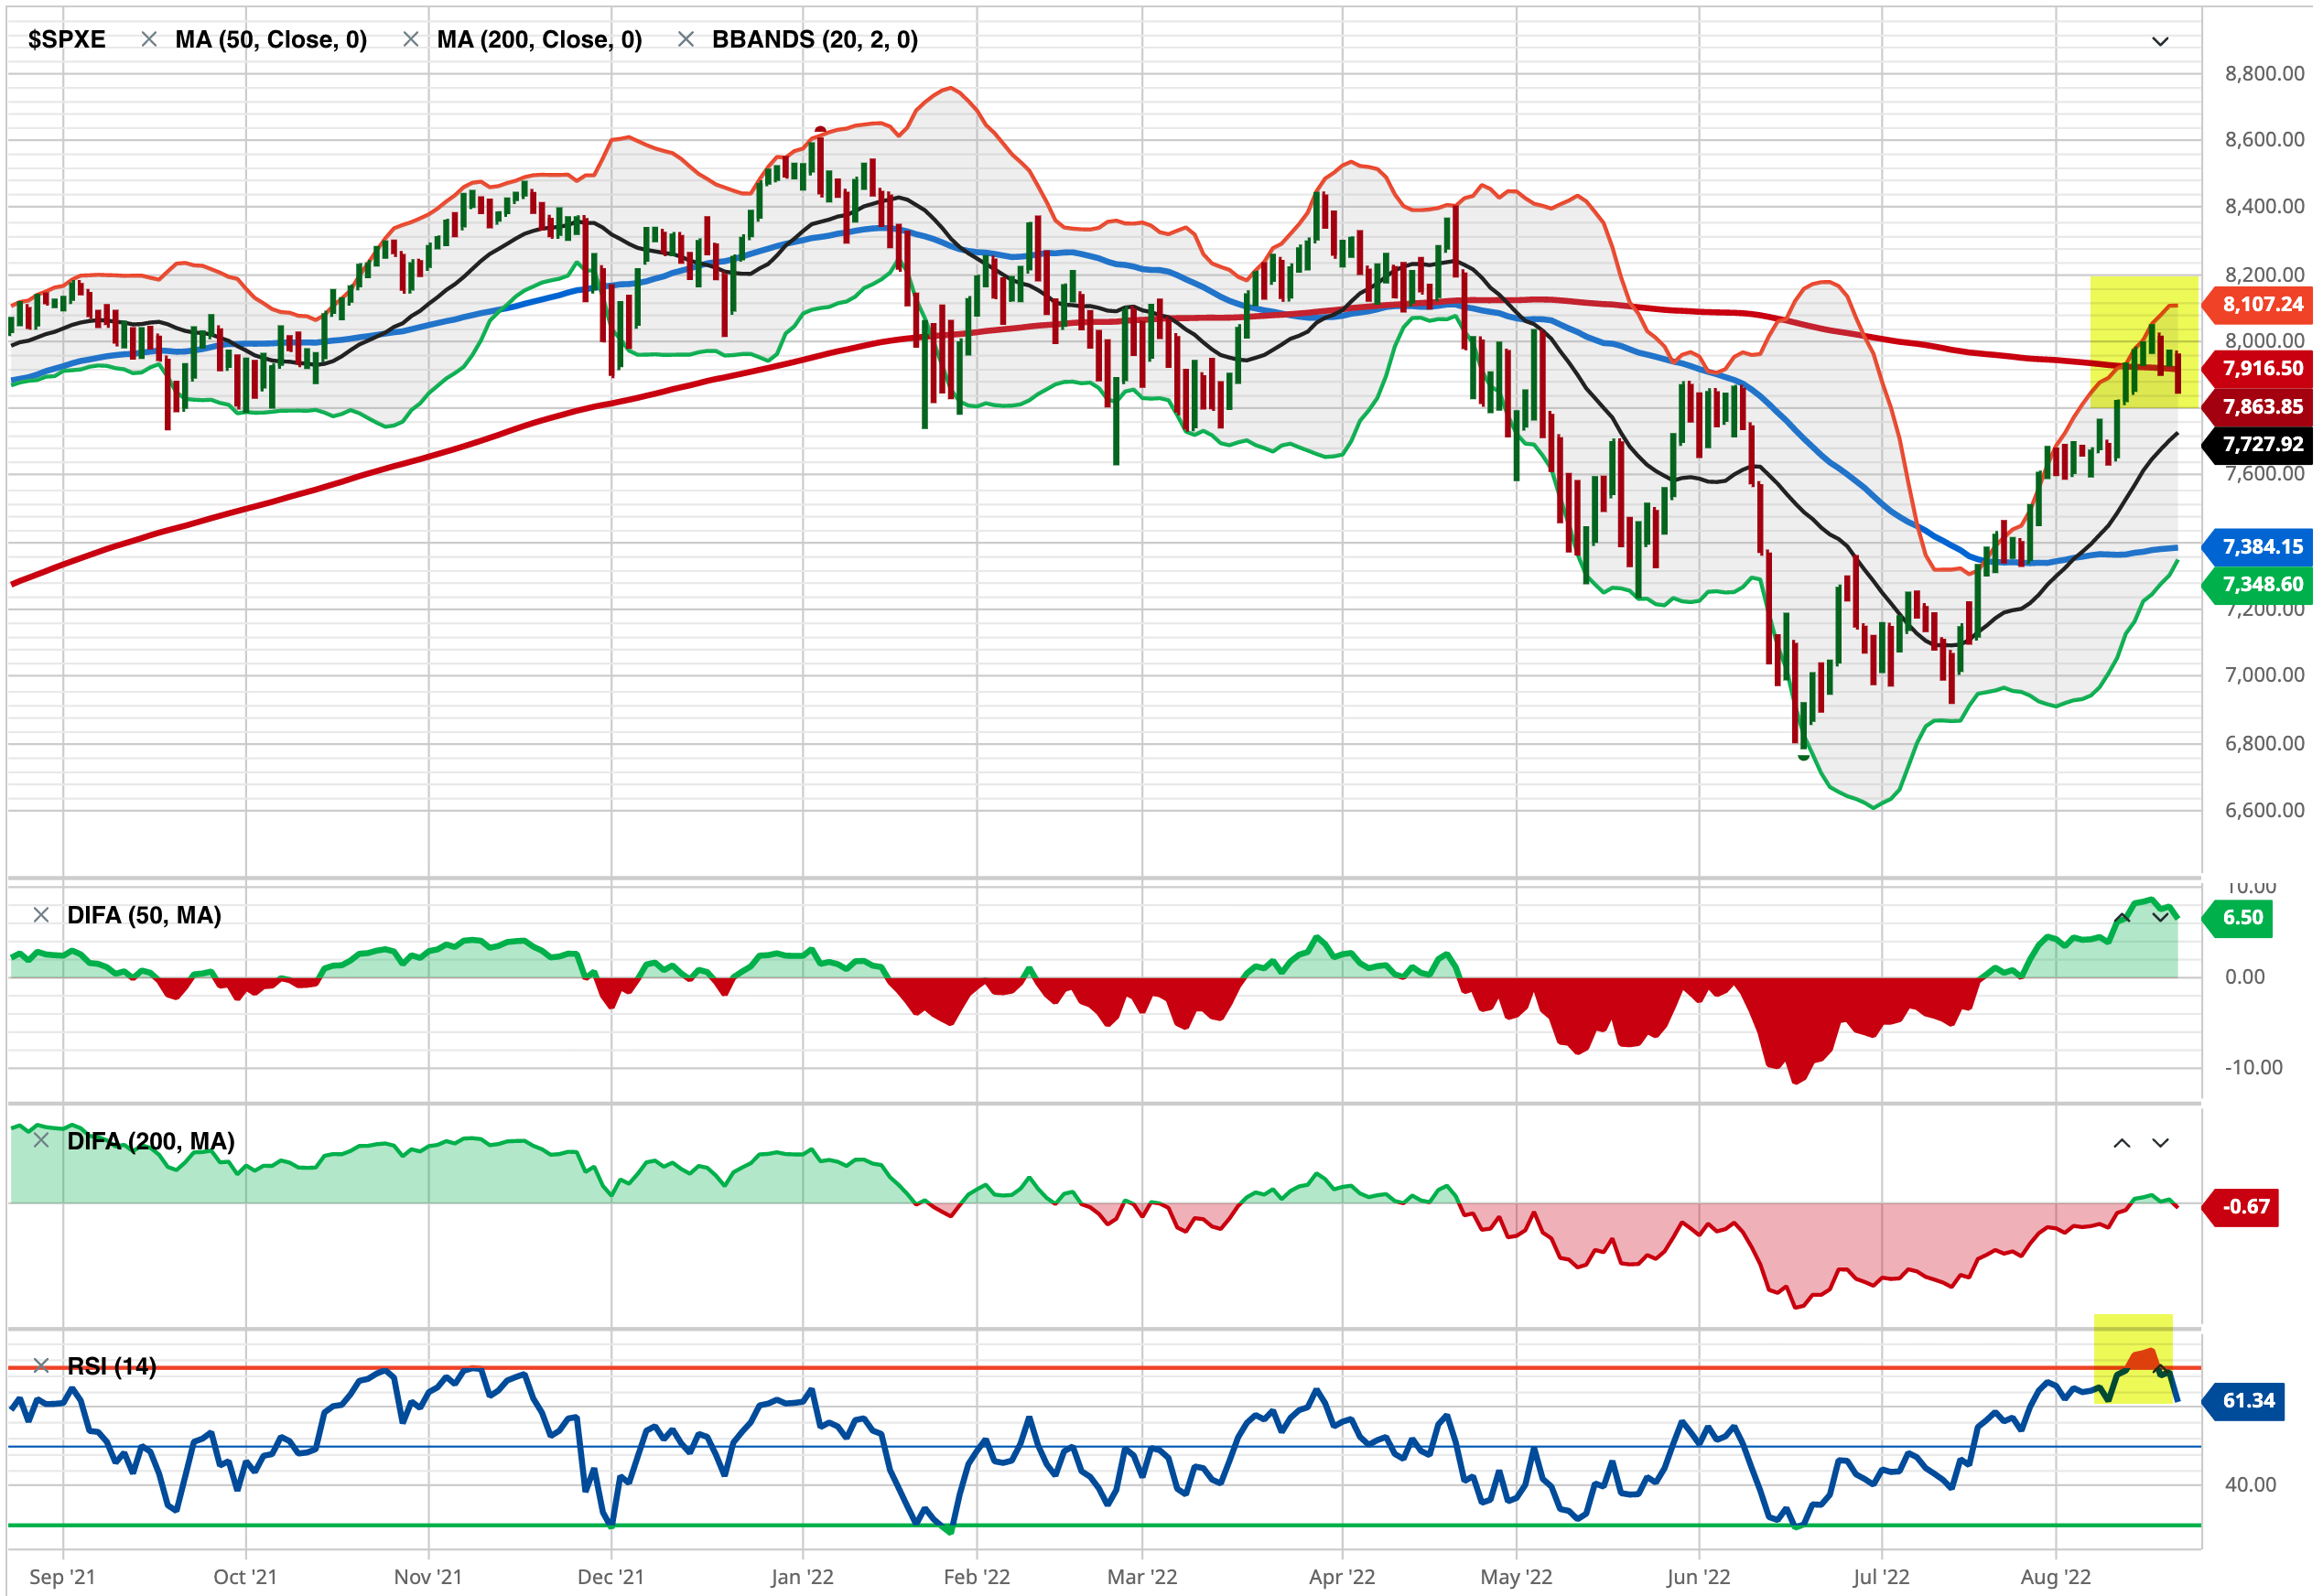
The U.S. stock market as measured by the S&P 500 stock index, has trended down from a lower high.
The S&P is not yet oversold, and implied volatility is around 20%, which is the prior lows over the past year.
At the recent high, 60% of the stocks in the index were trending above their 200-day average and about 80% of the stocks were trending above their 50-day average, both of which have now turned down as an increasing number of stocks are trending down.
Trend lines aren’t magic; they’re just a general trend guide.
I’m not seeing heavy selling pressure, so we’ll see.
Mike Shell is the founder and Chief Investment Officer of Shell Capital Management, LLC, and the portfolio manager of ASYMMETRY® Managed Portfolios. Mike Shell and Shell Capital Management, LLC is a registered investment advisor focused on asymmetric risk-reward and absolute return strategies and provides investment advice and portfolio management only to clients with a signed and executed investment management agreement. The observations shared on this website are for general information only and should not be construed as investment advice to buy or sell any security. This information does not suggest in any way that any graph, chart, or formula offered can solely guide an investor as to which securities to buy or sell, or when to buy or sell them. Securities reflected are not intended to represent any client holdings or recommendations made by the firm. In the event any past specific recommendations are referred to inadvertently, a list of all recommendations made by the company within at least the prior one-year period may be furnished upon request. It should not be assumed that recommendations made in the future will be profitable or will equal the performance of the securities on the list. Any opinions expressed may change as subsequent conditions change. Please do not make any investment decisions based on such information, as it is not advice and is subject to change without notice. Investing involves risk, including the potential loss of principal an investor must be willing to bear. Past performance is no guarantee of future results. All information and data are deemed reliable but are not guaranteed and should be independently verified. The presence of this website on the Internet shall in no direct or indirect way raise an implication that Shell Capital Management, LLC is offering to sell or soliciting to sell advisory services to residents of any state in which the firm is not registered as an investment advisor. The views and opinions expressed in ASYMMETRY® Observations are those of the authors and do not necessarily reflect the position of Shell Capital Management, LLC. The use of this website is subject to its terms and conditions.
We’re entering a point in the stock market trend that could be an inflection point. My market risk indicators are elevated, suggesting DEFENSE, but they’re imperfect. In bear markets, we’ll see lots of whipsaws and head fakes, and OVERBOUGHT and EXTENDED can continue.
Our objective is asymmetric risk/reward for asymmetric investment returns; we are unconstrained as to strategy or market.
A skillful trend follower wants to catch a trend early in its stage and capitalize on it until it ends, so if we want to identify them early, we must necessarily focus on short-term trends to see if they can become longer-term trends and asymmetric profits.
With that said, in the month of October 2022, eight of the eleven sectors tracked by S&P sector indices are in the green, and three are in the red.
Volatility measures the frequency and magnitude of price movements, both up and down, that a financial instrument experiences over a certain period of time. The more dramatic the price swings in that instrument, the higher the level of volatility. Volatility can be measured using actual historical price changes (realized volatility) or it can be a measure of expected future volatility that is implied by option prices.
It is widely accepted that a portfolio diversified across a number of stocks will provide an inherent return over time, that buying and holding stocks for the long term is virtuous and pragmatic, and that the longer your perspective, the lower your investment risk.
This strategy is flawed because it is based on a single set of baseline conditions and return drivers, and there is no guarantee that the future will not deviate significantly from the past.
In fact, “past performance is no guarantee of future results” is a required regulatory statement for registered investment advisors like my firm.
Year to date the widely followed S&P 500 stock index that tracks 500 stocks, fully invested, all the time, is down -25% for 2022.
In the chart, we show the index is about 9% below its 50-day average and 14% below the 200-day average. These simple trend-following indicators have signaled defense most of the year, and you can see the red when they’re underwater.
Though it’s oversold on a short-term basis and could see some countertrend follow-through from yesterday’s radical swing, the primary trend is clearly down. So, we declined to participate in its descent like a passive investor does.
Investments and markets require active risk management to avoid larger losses and to create the positive risk-adjusted investment returns people want.
Active risk management and hedging aren’t a sure thing, either, but for me, it’s far better than just sitting there doing nothing.
You can probably see why I’ve preached active risk management and dynamic hedging for drawdown control for over two decades.
More importantly, I’ve done it.
Investing involves risks of loss you must be willing to bear, or actively manage and hedge.
All our endeavors involve some degree of risk, but we all get to tactically decide which risks we want, and which we prefer to hedge off.
Check out our new website, which is a work in progress. We’ll eventually transfer these observations to the new site. https://shell-capital.com/
Mike Shell is the Founder and Chief Investment Officer of Shell Capital Management, LLC, and the portfolio manager of ASYMMETRY® Managed Portfolios. Mike Shell and Shell Capital Management, LLC is a registered investment advisor focused on asymmetric risk-reward and absolute return strategies and provides investment advice and portfolio management only to clients with a signed and executed investment management agreement. The observations shared on this website are for general information only and should not be construed as investment advice to buy or sell any security. This information does not suggest in any way that any graph, chart, or formula offered can solely guide an investor as to which securities to buy or sell, or when to buy or sell them. Securities reflected are not intended to represent any client holdings or recommendations made by the firm. In the event any past specific recommendations are referred to inadvertently, a list of all recommendations made by the company within at least the prior one-year period may be furnished upon request. It should not be assumed that recommendations made in the future will be profitable or will equal the performance of the securities on the list. Any opinions expressed may change as subsequent conditions change. Please do not make any investment decisions based on such information, as it is not advice and is subject to change without notice. Investing involves risk, including the potential loss of principal an investor must be willing to bear. Past performance is no guarantee of future results. All information and data are deemed reliable but are not guaranteed and should be independently verified. The presence of this website on the Internet shall in no direct or indirect way raise an implication that Shell Capital Management, LLC is offering to sell or soliciting to sell advisory services to residents of any state in which the firm is not registered as an investment advisor. The views and opinions expressed in ASYMMETRY® Observations are those of the authors and do not necessarily reflect the position of Shell Capital Management, LLC. The use of this website is subject to its terms and conditions.
A whipsaw in trading and investment management is when you enter a trend and it almost immediately reverses in the other direction, resulting in a loss.
Whipsaws are a normal part of any trend system because trends do reverse, and sometimes sooner than you expect.
“The breadth thrusts we’ve seen are typical of a new uptrend — unless* it’s a prolonged bear market. *IF this is the early stage of a prolonged bear market that is likely accompanied by a recession, then we’ll see many swings like this as it unfolds along the way.”
The stock index and the most weighted sectors like technology and consumer discretionary are very close to breaking price levels that should be short-term support.
Any further decline will increase the odds the U.S. is in the early stage of a prolonged bear market, which will include many swings up and down of 10 to 20% lasting several weeks.
Such swings lead to whipsaws for many tactical traders as they enter just in time to catch the top, and/or sell just in time the trend reverses in the other direction.
I’ve tactically operated through this many times before over more than two decades, and I’ve historically shown my edge during these conditions.
I have a hunch we’re going to hear the word “whipsaw” a lot in the coming months, so let’s go ahead and kick it off with The Whipsaw Song I had fun with back in April 2008 when Ed Seykota published it.
Give it a listen!
Mike Shell is the Founder and Chief Investment Officer of Shell Capital Management, LLC, and the portfolio manager of ASYMMETRY® Managed Portfolios. Mike Shell and Shell Capital Management, LLC is a registered investment advisor focused on asymmetric risk-reward and absolute return strategies and provides investment advice and portfolio management only to clients with a signed and executed investment management agreement. The observations shared on this website are for general information only and should not be construed as investment advice to buy or sell any security. This information does not suggest in any way that any graph, chart, or formula offered can solely guide an investor as to which securities to buy or sell, or when to buy or sell them. Securities reflected are not intended to represent any client holdings or recommendations made by the firm. In the event any past specific recommendations are referred to inadvertently, a list of all recommendations made by the company within at least the prior one-year period may be furnished upon request. It should not be assumed that recommendations made in the future will be profitable or will equal the performance of the securities on the list. Any opinions expressed may change as subsequent conditions change. Please do not make any investment decisions based on such information, as it is not advice and is subject to change without notice. Investing involves risk, including the potential loss of principal an investor must be willing to bear. Past performance is no guarantee of future results. All information and data are deemed reliable but are not guaranteed and should be independently verified. The presence of this website on the Internet shall in no direct or indirect way raise an implication that Shell Capital Management, LLC is offering to sell or soliciting to sell advisory services to residents of any state in which the firm is not registered as an investment advisor. The views and opinions expressed in ASYMMETRY® Observations are those of the authors and do not necessarily reflect the position of Shell Capital Management, LLC. The use of this website is subject to its terms and conditions.
The stock market is now reaching its first short-term higher probability of a countertrend pullback.
The S&P 500 stock index tapped its 200-day average and reached a short-term overbought level based on relative strength and volatility and is now stalling.
The S&P 500 Equal Weight, which gives an equal weighting to all 500 stocks instead of more exposure to the largest companies based on capitalization, crossed above its 200-day average but was reaching an overbought level at the same time.
So, it’s not surprising to see these market proxies roll over at this level.
Two weeks ago I pointed out in The stock market is at an inflection point the S&P 500 was stalling as if there is resistance at this price level, and there’s a lot of potential supply for those in a loss trap, and it was getting overbought as measured by the relative strength index. The index trended up a few more percent before pulling back today.
I don’t normally trade the S&P 500 index, I just use it as a proxy for the overall stock market.
For portfolio management, I get more granular into the sectors inside, and the stocks.
I also include global markets like commodities, bonds, and other alternatives, to provide a global unconstrained opportunity set to find potentially profitable trends.
Trend systems just want to be fed some trends, so the system can extract the parts it wants from the parts it doesn’t want. It’s best to provide a wide range of uncorrelated price trends for trend systems to create a unique return stream from them.
From the broad index like the S&P 500 it’s useful to look inside to see the percentage of stocks that are trending above their 50-day and 200-day averages to gauge the strength of participation in the uptrend.
The percent of S&P 500 stocks trending above the 50-day average has quickly trended up to the red zone.
Multiple overbought levels in breadth and relative strength oscillators are a sign of strength, not weakness.
The breadth thrusts we’ve seen are typical of a new uptrend — unless* it’s a prolonged bear market. *IF this is the early stage of a prolonged bear market that is likely accompanied by a recession, then we’ll see many swings like this as it unfolds along the way.
However, once most stocks are already in uptrends, the enthusiasm to buy may have run out, so I consider the level above 80% to be a higher risk zone. If we are looking for a lower risk entry, it’s below 30%. A strong breadth thrust like this is bullish when it starts and is typical off the lows after stocks have already trended down as much as they have.
At this point, despite the S&P 500 being down 1.5% today, it appears to be a normal pullback from overbought levels. Our relative strength index signals the index was moving up with such velocity it was a little too far, too fast, which is good in the longer term but increased the odds of a retrench in the short term.
I reduced exposure earlier this week, and the price action next week will determine if we reduce further or buy the dip at lower prices.
In the big picture, we’re strolling into the seasonally weakest month for the stock market after a big rally and no shortage of risks to the short-term uptrend, so it’s essential to determine an exit, hedge, or reduce exposure.
On the positive side, the recent decline in volatility and new uptrends suggest systematic trend-following investment programs could provide inflows of several billion dollars a day in stocks for the next few months if it continues.
While everyone else is trying to figure out what’s going to happen next with inflation, rates, and other global macro issues, we focus on keeping our hard-earned capital invested in the direction of the trend.
If the trends change, so will we.
Mike Shell is the Founder and Chief Investment Officer of Shell Capital Management, LLC, and the portfolio manager of ASYMMETRY® Managed Portfolios. Mike Shell and Shell Capital Management, LLC is a registered investment advisor focused on asymmetric risk-reward and absolute return strategies and provides investment advice and portfolio management only to clients with a signed and executed investment management agreement. The observations shared on this website are for general information only and should not be construed as investment advice to buy or sell any security. This information does not suggest in any way that any graph, chart, or formula offered can solely guide an investor as to which securities to buy or sell, or when to buy or sell them. Securities reflected are not intended to represent any client holdings or recommendations made by the firm. In the event any past specific recommendations are referred to inadvertently, a list of all recommendations made by the company within at least the prior one-year period may be furnished upon request. It should not be assumed that recommendations made in the future will be profitable or will equal the performance of the securities on the list. Any opinions expressed may change as subsequent conditions change. Please do not make any investment decisions based on such information, as it is not advice and is subject to change without notice. Investing involves risk, including the potential loss of principal an investor must be willing to bear. Past performance is no guarantee of future results. All information and data are deemed reliable but are not guaranteed and should be independently verified. The presence of this website on the Internet shall in no direct or indirect way raise an implication that Shell Capital Management, LLC is offering to sell or soliciting to sell advisory services to residents of any state in which the firm is not registered as an investment advisor. The views and opinions expressed in ASYMMETRY® Observations are those of the authors and do not necessarily reflect the position of Shell Capital Management, LLC. The use of this website is subject to its terms and conditions.
The S&P 500 is stalling as if there is resistance at this price level, and there’s a lot of potential supply for those in a loss trap.
It’s also getting overbought as measured by the relative strength index.
The yellow horizontal highlight denotes the price range with the most volume, which you can see in the Volume by Price bars on the right which show the volume at each price level that could be support or resistence.
At the current price level, you can see the yellow highlighted area is the price range of the highest volume of the past three months.
In February, the SPY declined and found support, or buying demand, at this level. Afterward, it trended up before trending down to this level again and once again was met with enough buying enthusiasm to hold it for several days, then the support failed and the S&P 500 Index ETF declined.
At that point, those who bought earlier at higher prices around the price level or higher carried a loss.
In May the stock market trended up against but selling pressure dominated and the index once again trended sideways for several days of indecision before finally breaking down in a waterfall decline for several days.
The stock market finally got oversold again and investor sentiment was extremely bearish, and it’s since climbed a wall or worry.
Now the price has trended up to this price level again that has been both support and resistance in the past three months and it seems to be stalling.
Today started off strong, up 1% or more, only to fade by the end of the day.
Investors should be cautious this may not be over yet, and far from it.
We’ll see, and probably sooner than later.
The inflation report this week may be a market mover.
Mike Shell is the Founder and Chief Investment Officer of Shell Capital Management, LLC, and the portfolio manager of ASYMMETRY® Managed Portfolios. Mike Shell and Shell Capital Management, LLC is a registered investment advisor focused on asymmetric risk-reward and absolute return strategies and provides investment advice and portfolio management only to clients with a signed and executed investment management agreement. The observations shared on this website are for general information only and should not be construed as investment advice to buy or sell any security. This information does not suggest in any way that any graph, chart, or formula offered can solely guide an investor as to which securities to buy or sell, or when to buy or sell them. Securities reflected are not intended to represent any client holdings or recommendations made by the firm. In the event any past specific recommendations are referred to inadvertently, a list of all recommendations made by the company within at least the prior one-year period may be furnished upon request. It should not be assumed that recommendations made in the future will be profitable or will equal the performance of the securities on the list. Any opinions expressed may change as subsequent conditions change. Please do not make any investment decisions based on such information, as it is not advice and is subject to change without notice. Investing involves risk, including the potential loss of principal an investor must be willing to bear. Past performance is no guarantee of future results. All information and data are deemed reliable but are not guaranteed and should be independently verified. The presence of this website on the Internet shall in no direct or indirect way raise an implication that Shell Capital Management, LLC is offering to sell or soliciting to sell advisory services to residents of any state in which the firm is not registered as an investment advisor. The views and opinions expressed in ASYMMETRY® Observations are those of the authors and do not necessarily reflect the position of Shell Capital Management, LLC. The use of this website is subject to its terms and conditions.
Every new price trend begins with a countertrend, and that’s true for uptrends that roll over into downtrends and downtrends that reverse into uptrends, so trend following starts with a countertrend.
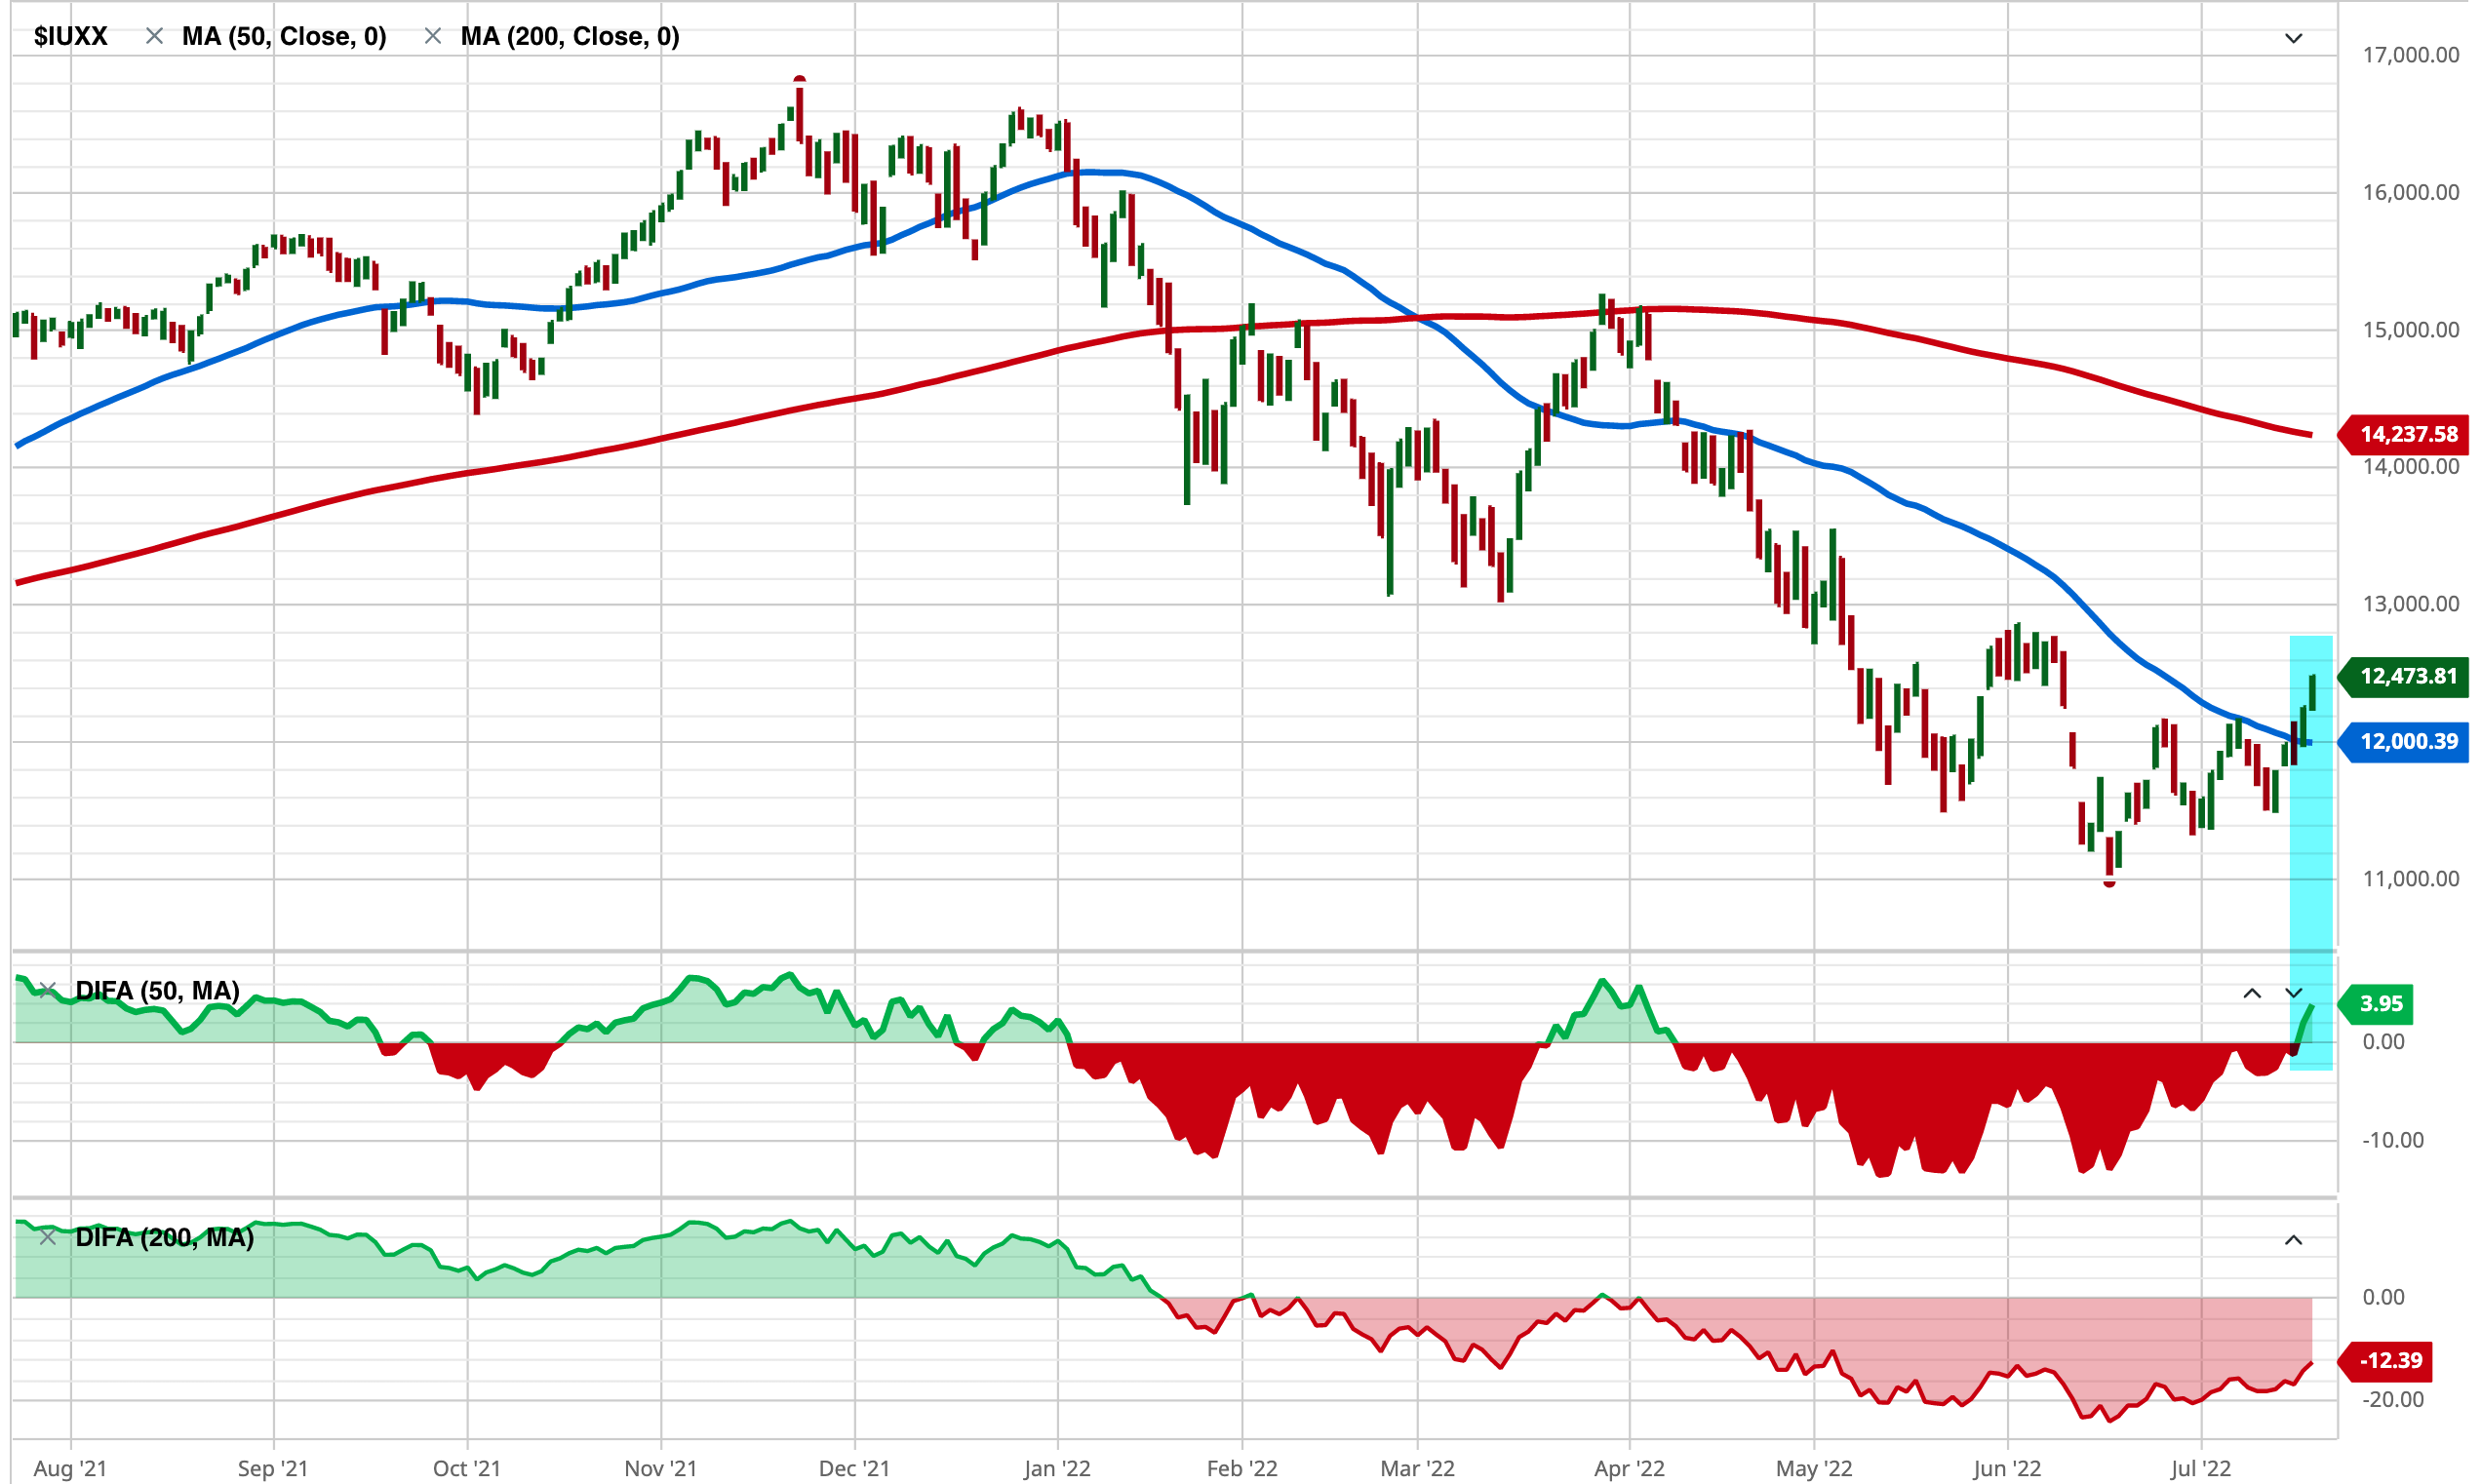
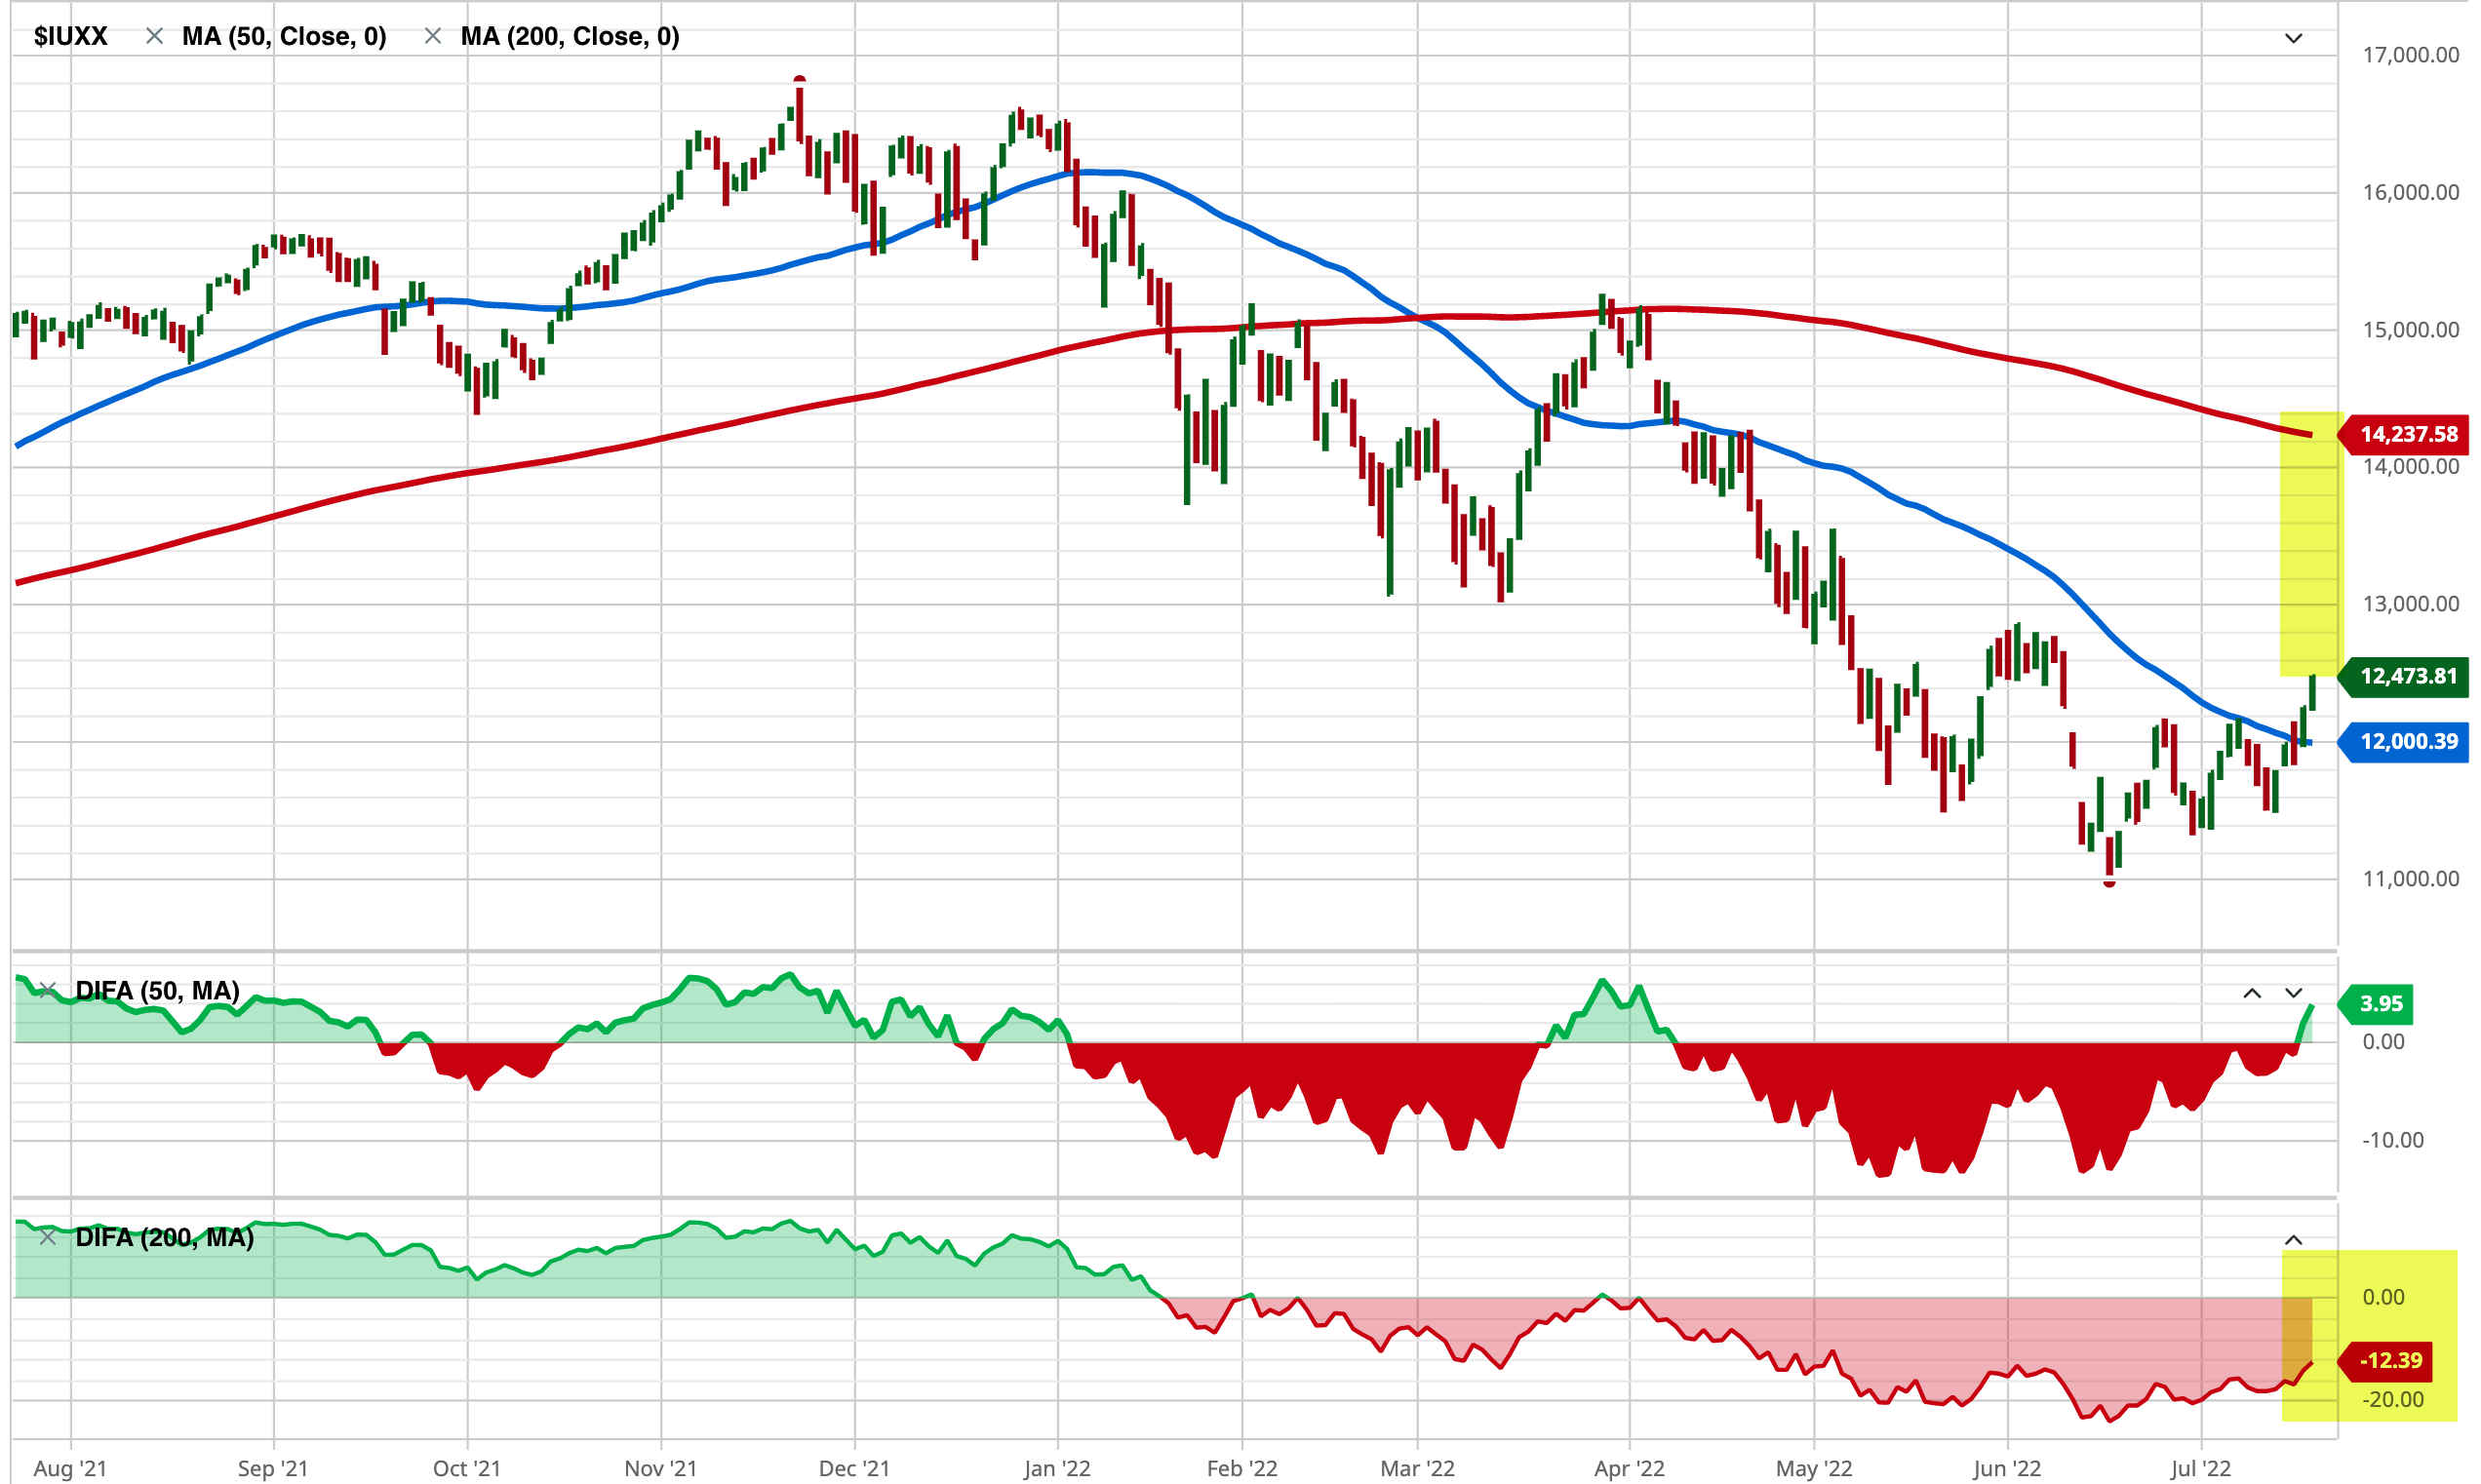
Technology-weighted Nasdaq 100 changed the short-term trend, breaking out above its 50-day average, now in a short-term uptrend.
Past performance is never a guarantee of future performance, but if the Nasdaq uptrend follows through, it’ll need to trend up more than 12% to trade above the longer-term 200-day average.
Nasdaq meets first overhead supply as potential resistant around 13,000.
All the areas above current prices are the hurdle of a trend trying to recover from losses.
Why?
Because many investors and traders may be trapped in losses around those prior lows and highs, the price levels attracted much historical trading.
Many tactical traders mistakenly claim resistance “is” at these levels, but we don’t know if there is resistance to further prices trending up until the price range is reached.
If a price trend reaches a level and reverses back, then we know there was “resistance” to that price level, which means there was selling pressure once the price got to that higher level.
Only time will tell if that is the case here, but we’ll be watching to see if new uptrends are met with selling prior price levels of interest, then we’ll know how much trouble these trends will have trending up into areas investors may have wished they had sold before taking on heavy losses.
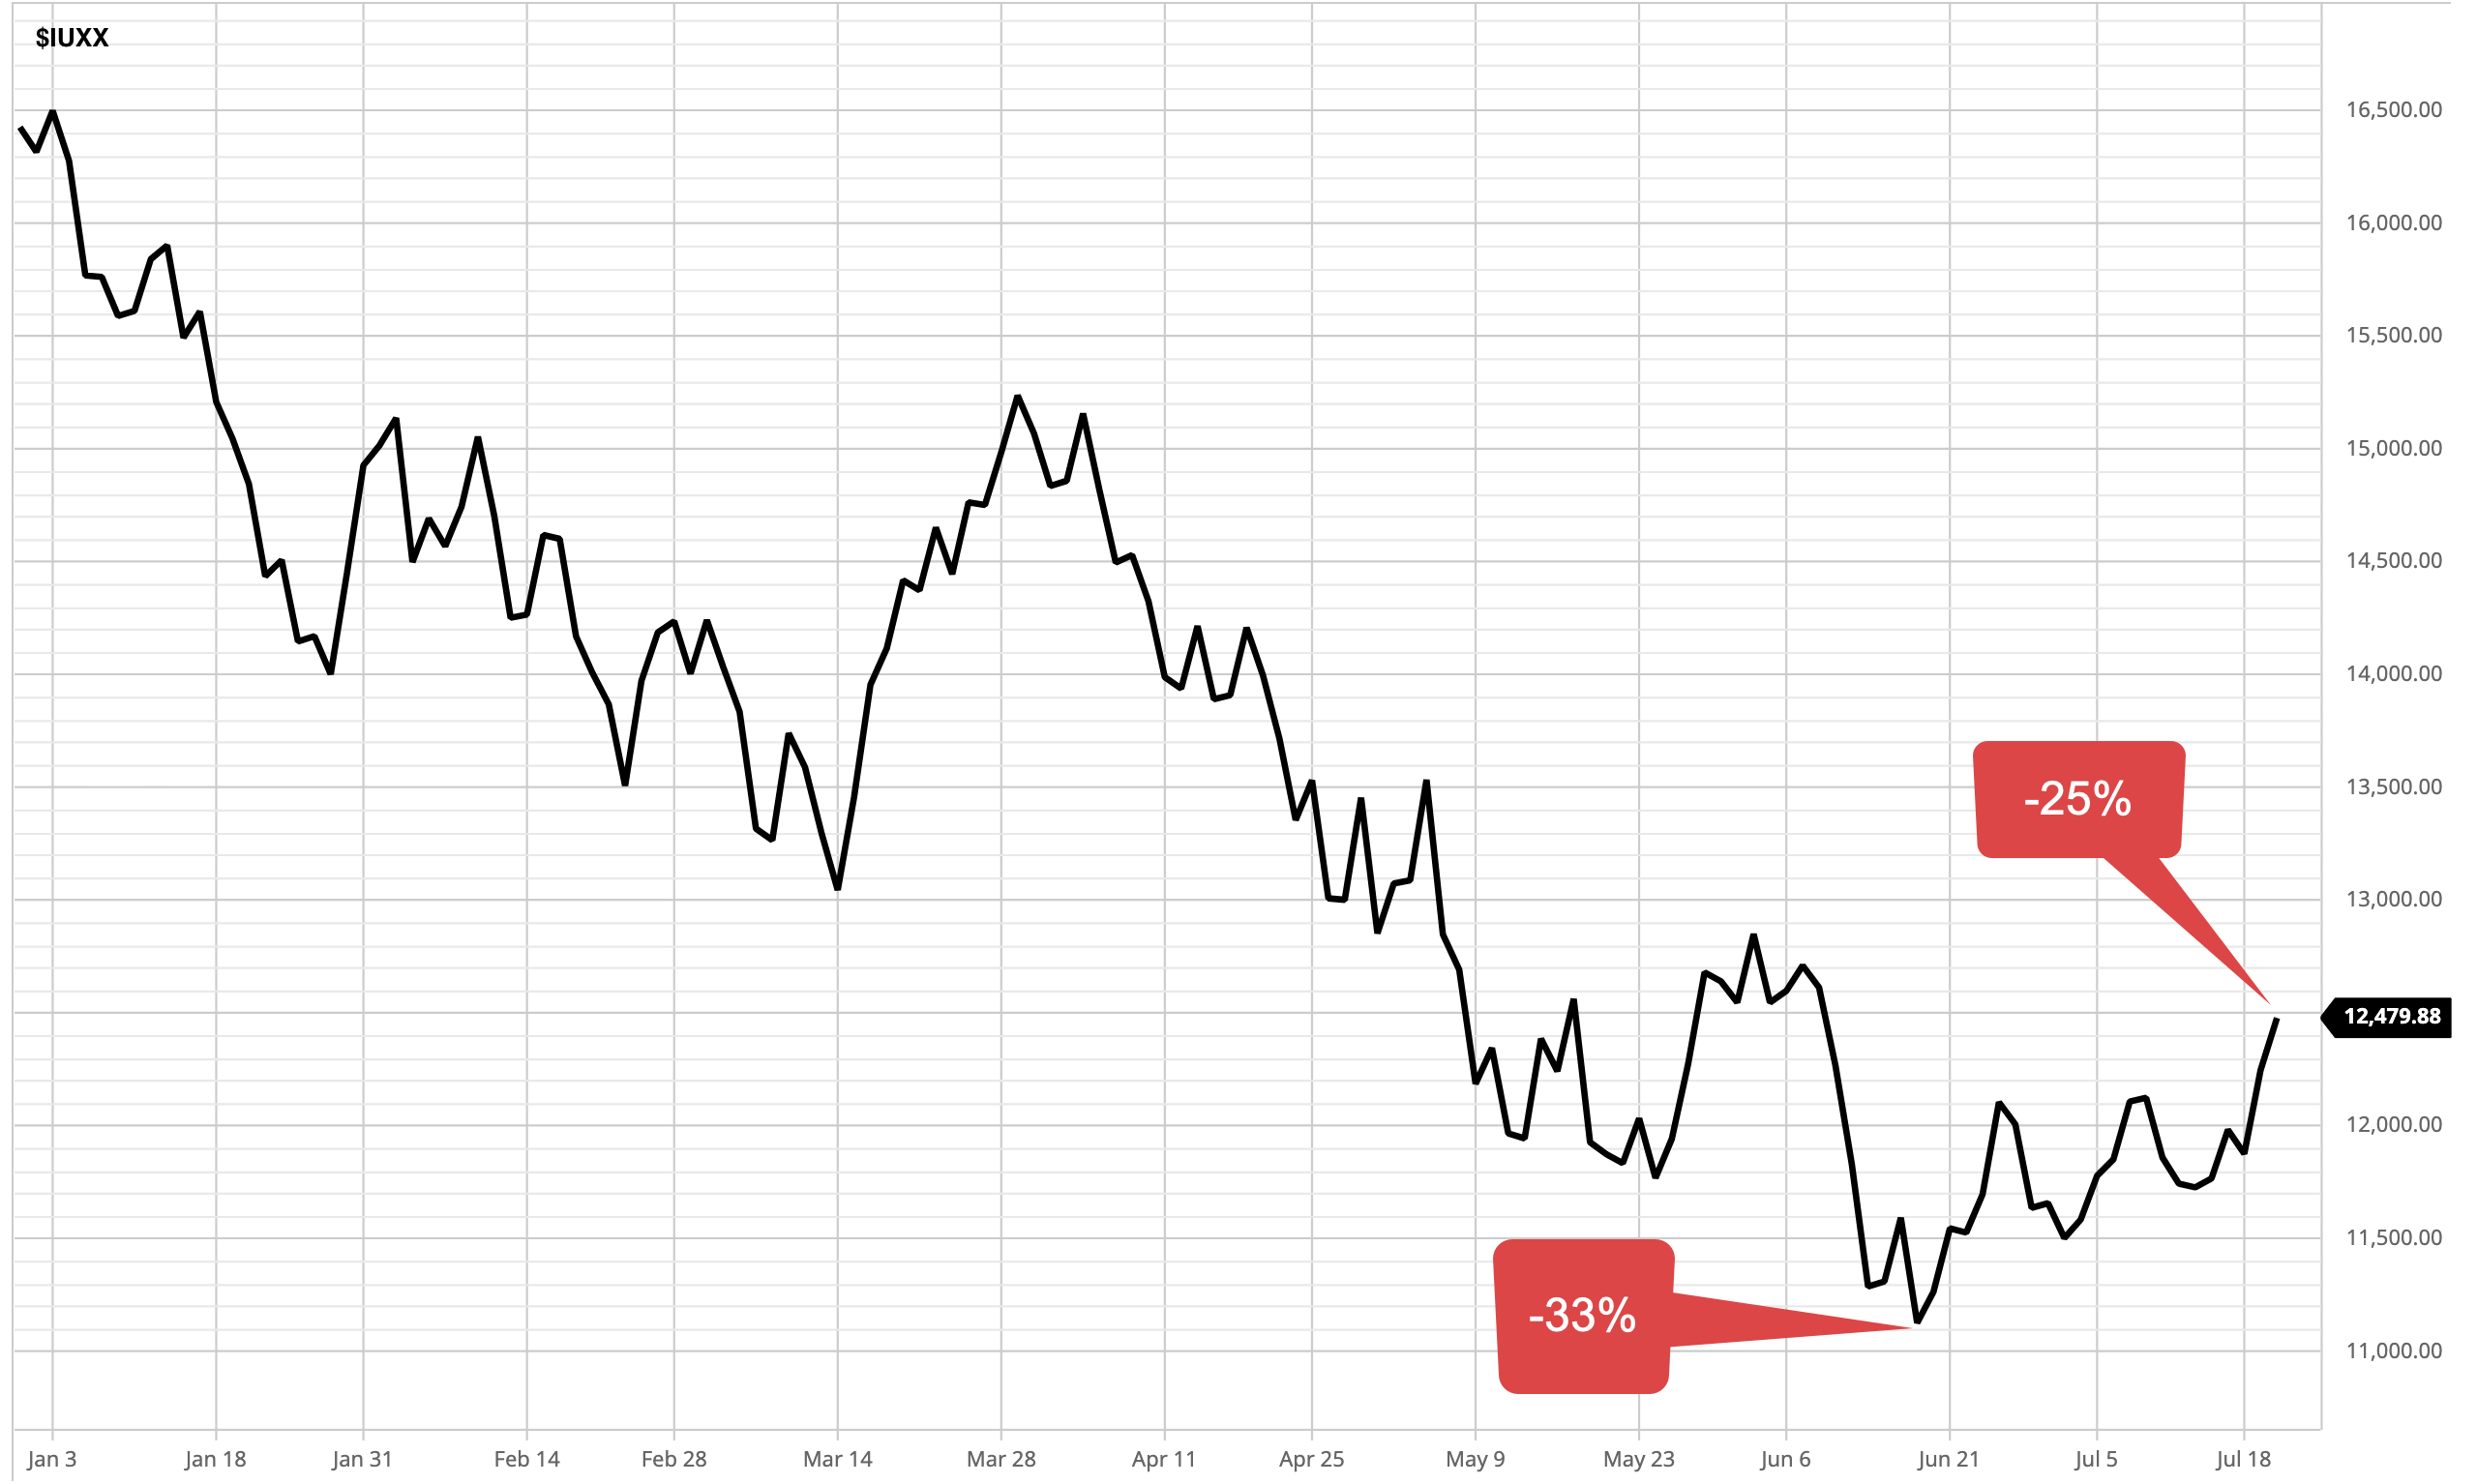
To see what I mean, the Nasdaq 100 index was down -33% year to date a few weeks ago, and after a series of higher lows and higher highs (an uptrend) it’s still down -25%.
If you were invested in the Nasdaq type investment this year, or a portfolio of similar stocks, you’ve been in a loss trap.
As prices trend back up, trapped holders may start to tap out, although others may hold on until they get back to breakeven.
This is the kind of price action we’ll observe unfold from here to see which market dynamics are more dominant.
Overhead supply of shares wanting to be sold becoming at least some pressure as resistance is why price trends look so rough and volatile after a downtrend.
At every level the trend reaches, other investors and traders are deciding to buy, hold, or sell.
It’s what makes a market.
For now, we have an uptrend in enough of the high-growth stocks as measured by the Nasdaq 100 index to clear the 50-day average, so no resistance there.
Every new price trends begin with a countertrend and a follow-through.
Let’s see how it goes from here.
Giddy up!
Mike Shell is the Founder and Chief Investment Officer of Shell Capital Management, LLC, and the portfolio manager of ASYMMETRY® Managed Portfolios. Mike Shell and Shell Capital Management, LLC is a registered investment advisor focused on asymmetric risk-reward and absolute return strategies and provides investment advice and portfolio management only to clients with a signed and executed investment management agreement. The observations shared on this website are for general information only and should not be construed as investment advice to buy or sell any security. This information does not suggest in any way that any graph, chart, or formula offered can solely guide an investor as to which securities to buy or sell, or when to buy or sell them. Securities reflected are not intended to represent any client holdings or recommendations made by the firm. In the event any past specific recommendations are referred to inadvertently, a list of all recommendations made by the company within at least the prior one-year period may be furnished upon request. It should not be assumed that recommendations made in the future will be profitable or will equal the performance of the securities on the list. Any opinions expressed may change as subsequent conditions change. Please do not make any investment decisions based on such information, as it is not advice and is subject to change without notice. Investing involves risk, including the potential loss of principal an investor must be willing to bear. Past performance is no guarantee of future results. All information and data are deemed reliable but are not guaranteed and should be independently verified. The presence of this website on the Internet shall in no direct or indirect way raise an implication that Shell Capital Management, LLC is offering to sell or soliciting to sell advisory services to residents of any state in which the firm is not registered as an investment advisor. The views and opinions expressed in ASYMMETRY® Observations are those of the authors and do not necessarily reflect the position of Shell Capital Management, LLC. The use of this website is subject to its terms and conditions.
Once the stock market catches a break and trends up enough, we’ll probably see short covering keep it going for a while.
The percent of stocks trading above their 50 and 200 day averages is a useful signal of market breadth to gauge the participation in uptrends and downtrends.
I’ve been monitoring these statistical measures of trend and momentum for more than two decades, and long concluded after most stock prices have already trended up, I start to wonder where the next demand will come from to keep the uptrend going.
After prices have already fallen to an extremely low level, it starts to signal those who want to sell may have already sold.
But, it takes falling prices to drive the downtrend to a low enough point to attract long-term value investors as stock prices get cheaper and cheaper, to them.
At this point, below is the percent of S&P 500 stocks trading above their past 200-day average. We see only about 19% of the stocks in the S&P 500 are in intermediate-term to longer-term uptrends.
Can it get worse? Can stocks trend lower? and more stocks trend lower?
Yes, it can.
A visual of the same chart above in logarithmic scale helps to highlight the lower end of the range.
In October and November 2008 only 7% of stocks were in uptrends.
In March 2020 only 10% of the S&P 500 stocks were in uptrends.
Keeping in mind the stock index has some exposure to sectors considered to be defensive like utilities, REITs, and consumer staples, it took a serious waterfall decline like -56% in 2008 to shift most of the 500 stocks into downtrends.
The point now is, that about 80% of stocks in the S&P 500 index are already in downtrends and at some point, the selling will dry up and new buying demand will take over.
I’m seeing other evidence that correlates with these price trends.
According to the investment bank Deutsche Bank, there’s a record short in equity futures positioning of asset managers. That means investment managers have high short exposure, hoping to profit from falling prices, or at least hoping to hedge off their risk in stocks they hold.
Goldman Sachs is the prime broker for many hedge funds and investment managers, including my firm, and Goldman Sachs reports long positioning aiming to profit from uptrends in stocks is off the chart.
Once the stock market catches a break and trends up enough, we’ll probably see short covering keep it going for a while.
This doesn’t suggest we buy and hold passively, but it suggests stocks have already declined into downtrends and big institutional money is positioned for further declines, so we have to wonder who is going to keep selling stocks?
Economics 101 is what drives prices, and that’s supply and demand.
There’s been a supply of stock selling that has been dominant over the desire to buy, so prices are in downtrends.
This is when I am looking for the negative sentiment to change.
You can probably see why are Shell Capital, we row, not sail, when the wind stops blowing in our preferred direction.
Mike Shell is the Founder and Chief Investment Officer of Shell Capital Management, LLC, and the portfolio manager of ASYMMETRY® Managed Portfolios. Mike Shell and Shell Capital Management, LLC is a registered investment advisor focused on asymmetric risk-reward and absolute return strategies and provides investment advice and portfolio management only to clients with a signed and executed investment management agreement. The observations shared on this website are for general information only and should not be construed as investment advice to buy or sell any security. This information does not suggest in any way that any graph, chart, or formula offered can solely guide an investor as to which securities to buy or sell, or when to buy or sell them. Securities reflected are not intended to represent any client holdings or recommendations made by the firm. In the event any past specific recommendations are referred to inadvertently, a list of all recommendations made by the company within at least the prior one-year period may be furnished upon request. It should not be assumed that recommendations made in the future will be profitable or will equal the performance of the securities on the list. Any opinions expressed may change as subsequent conditions change. Please do not make any investment decisions based on such information, as it is not advice and is subject to change without notice. Investing involves risk, including the potential loss of principal an investor must be willing to bear. Past performance is no guarantee of future results. All information and data are deemed reliable but are not guaranteed and should be independently verified. The presence of this website on the Internet shall in no direct or indirect way raise an implication that Shell Capital Management, LLC is offering to sell or soliciting to sell advisory services to residents of any state in which the firm is not registered as an investment advisor. The views and opinions expressed in ASYMMETRY® Observations are those of the authors and do not necessarily reflect the position of Shell Capital Management, LLC. The use of this website is subject to its terms and conditions.
In economics, inflation is an increase in the prices of goods and services in an economy.
When the general price level rises, each unit of currency buys fewer goods and services; consequently, inflation corresponds to a reduction in the purchasing power of money.
You may not see the value of your money change online like you do with your investment fund values changing daily, but it’s changing.
Inflation is a real risk for everyone, but it’s worse for people who have their money earning a low rate of interest at a bank or another low-yield fixed asset.
If someone believes they are being a “conservative investor” by investing money in an interest-bearing bank account, it’s only because the bank statement doesn’t show the real value of money after inflation.
The latest inflation report shows U.S. Inflation is 9%, three times higher than the long-term average of 3.25%, so if someone is only earning 3% on a CD, the value of their money is 6% less than it was.
But that’s not the main point of this observation, it’s just one of many reasons the trend in prices is important.
The US Inflation Rate is the percentage a chosen basket of goods and services purchased in the US increases in price over a year. Inflation is one of the metrics used by the US Federal Reserve to gauge the health of the economy. Since 2012, the Federal Reserve has targeted a 2% inflation rate for the US economy and may make changes to monetary policy if inflation is not within that range. A notable time for inflation was the early 1980’s during the recession. Inflation rates went as high as 14.93%, causing the Federal Reserve led by Paul Volcker to take dramatic actions.
As an investment manager applying trend systems to global markets, I see it much more granular. I’m applying computerized trend systems to a wide range of global currencies, commodities, stocks, and bond markets, so I see the directional trend changes and shifts in momentum. Although I’ve automated the process of monitoring all these global markets, I still like to review the pictures as charts to see what is going on.
I ranked the S&P GSCI Indices by short-term momentum to see which are trending up the most, so we’ll start there.
I think it’s well known that many commodities markets had been trending up this year, but as we’ll see, many of these markets are now in downtrends.
I’ll share these trends in a way that makes it obvious that commodities aren’t just tradable markets, but they impact all of us, and commodities are interconnected. For example, the price of soybeans impacts livestock.
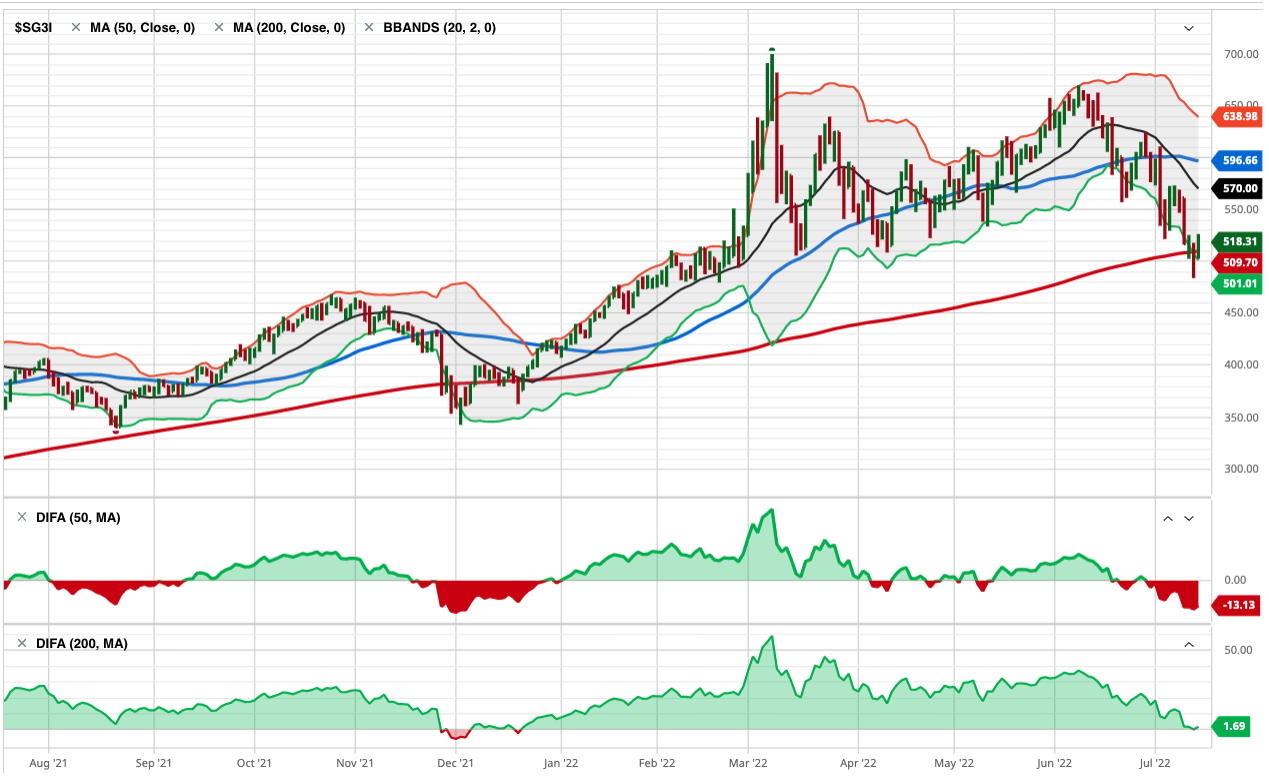
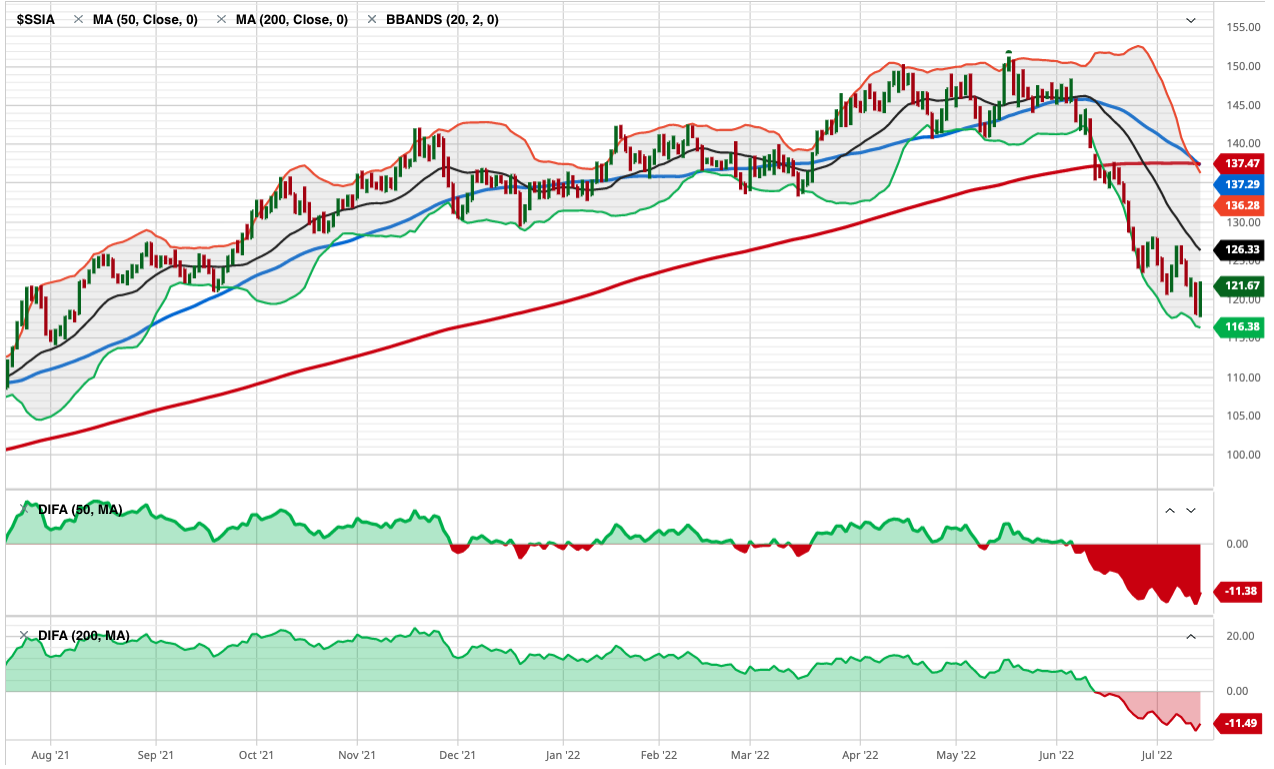
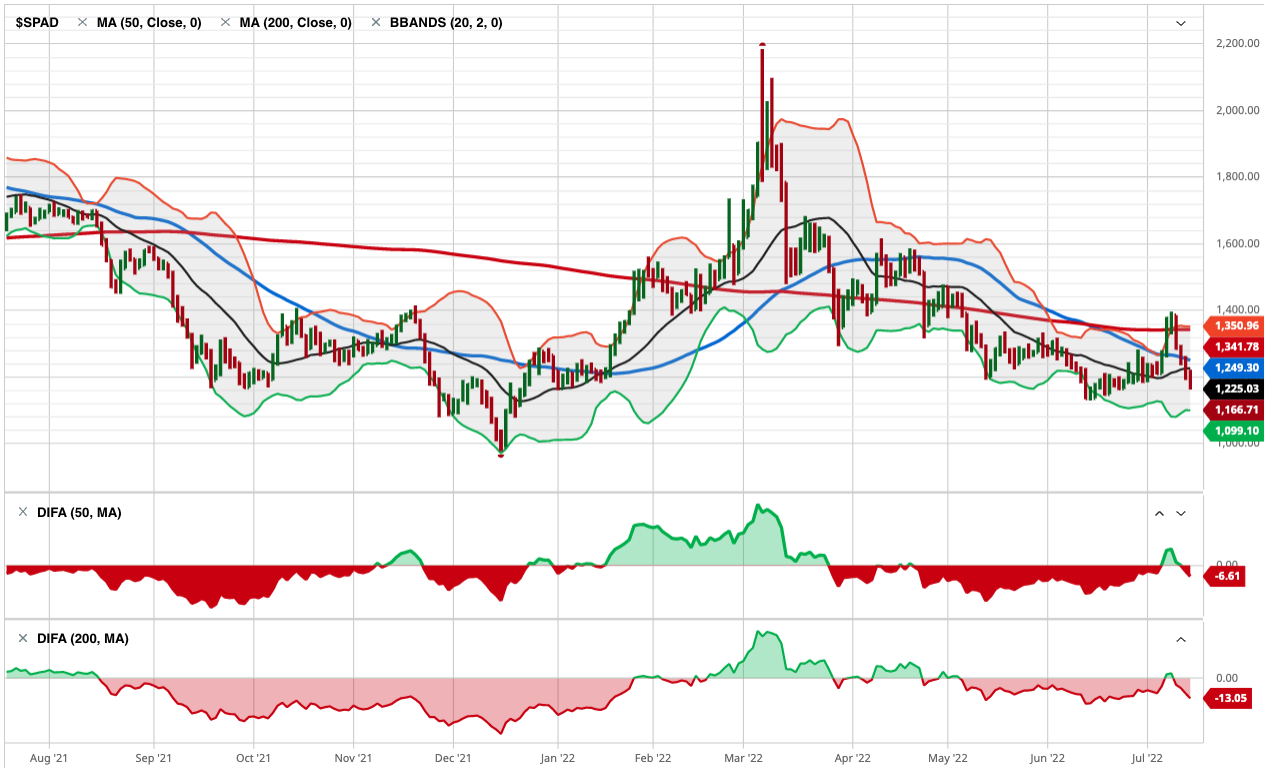
The S&P GSCI Feeder Cattle Index provides investors with a reliable and publicly available benchmark for investment performance in the feeder cattle market. S&P GSCI Feeder Cattle Index is in an uptrend as defined by above the 50 and 200-day moving averages. In fact, in the lower two frames, I include the percent above or below the 50 and 200-day average, and Feeder Cattle is about 5% above its 50-day average and 8% above its 200-day average price.
Feeder Cattle is the strongest uptrend over the past three months. It only gets worse from here.
Feeder Cattle
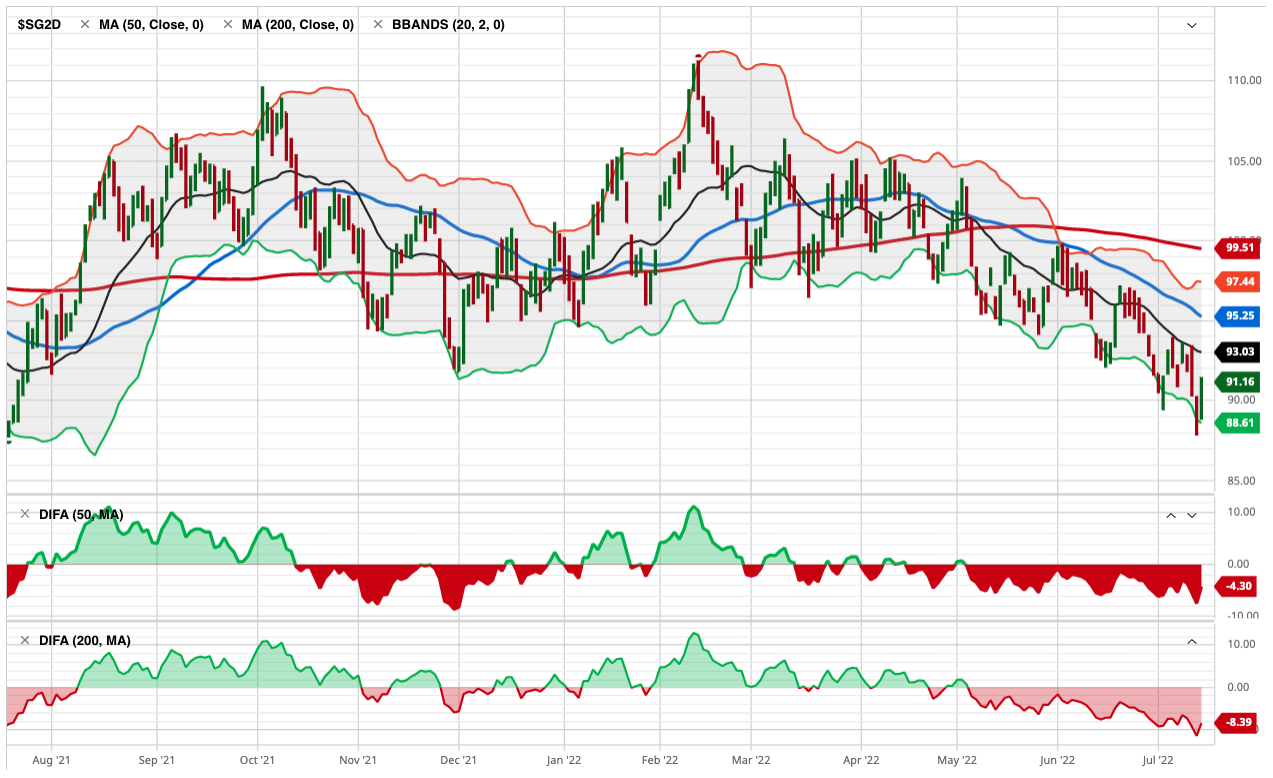
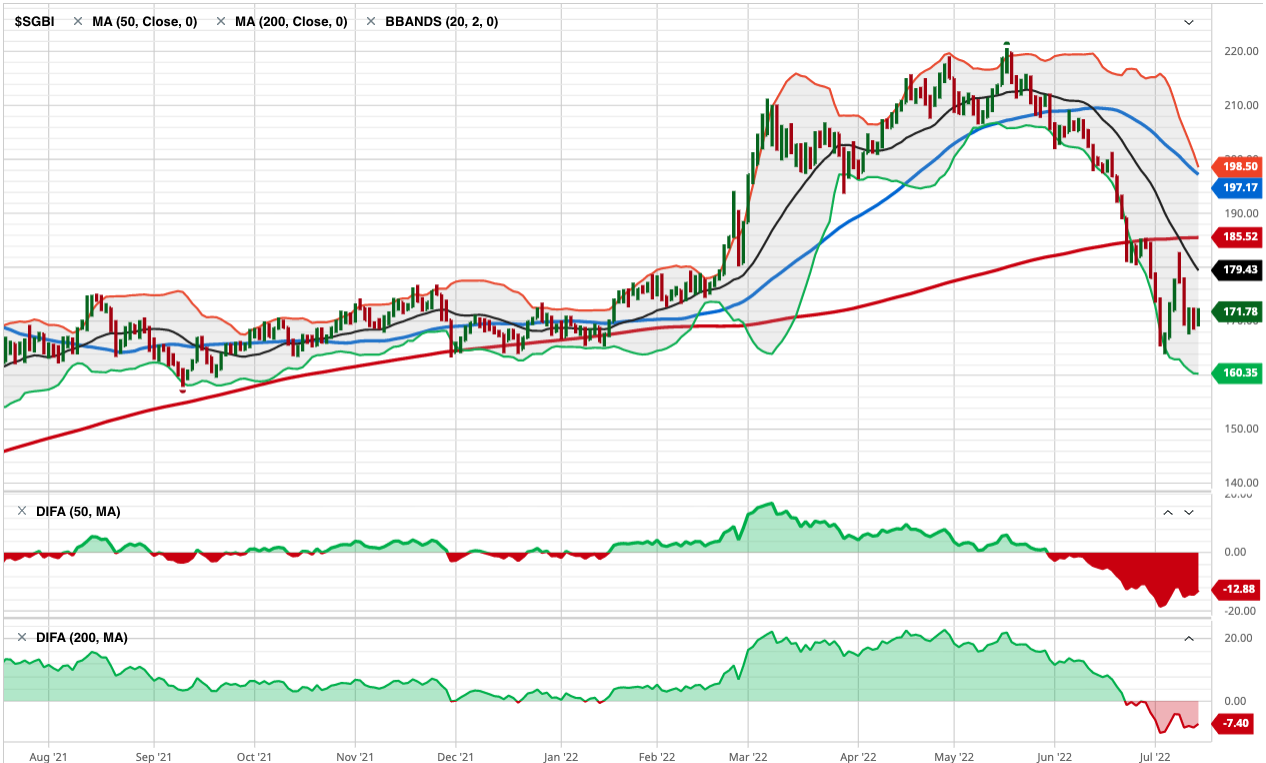
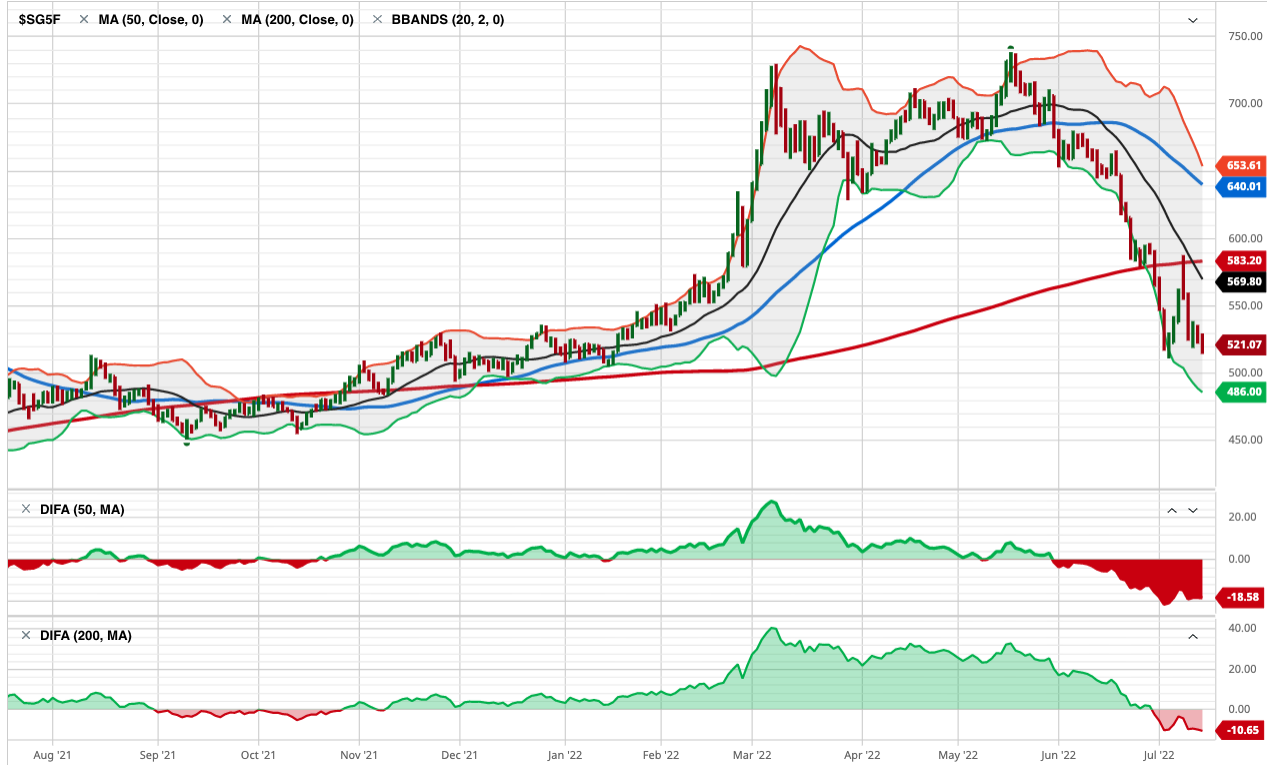
S&P GSCI All Cattle Index is a broader basket of cattle, and it too is in an uptrend after breaking out of a multi-month base.
All Cattle
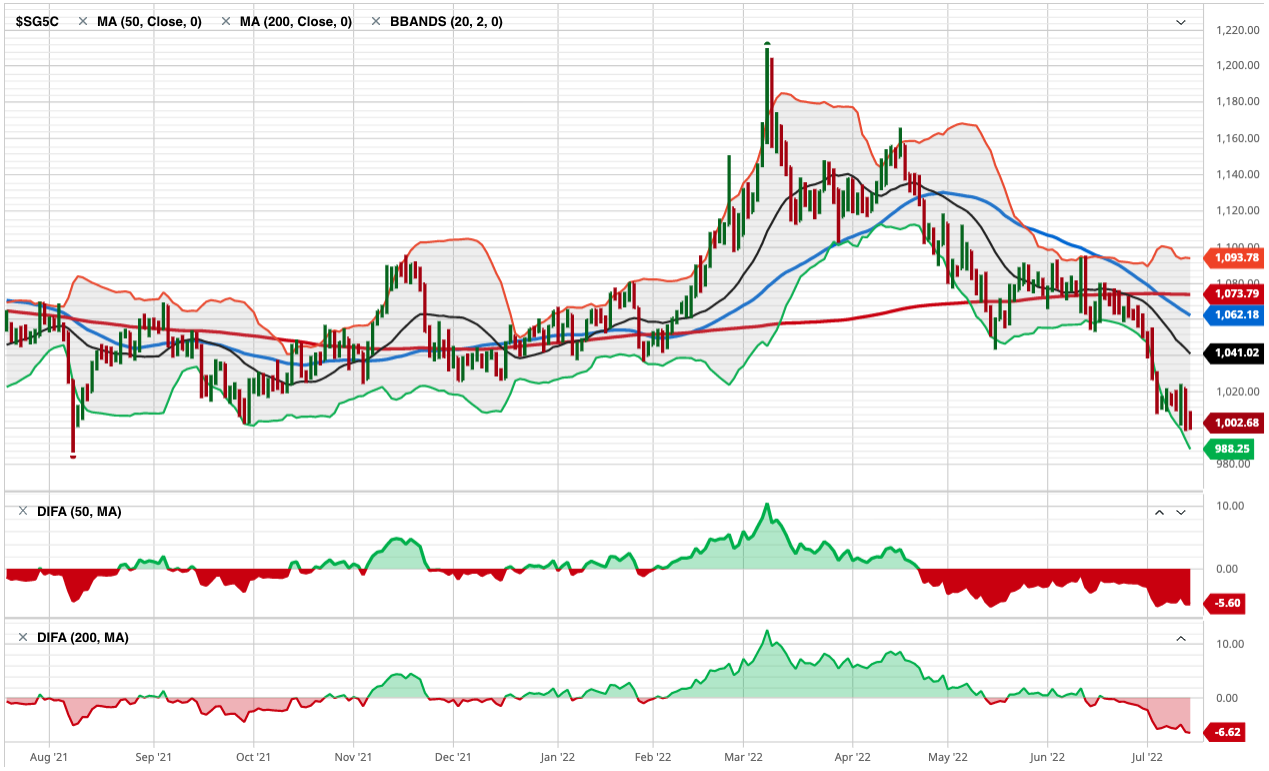
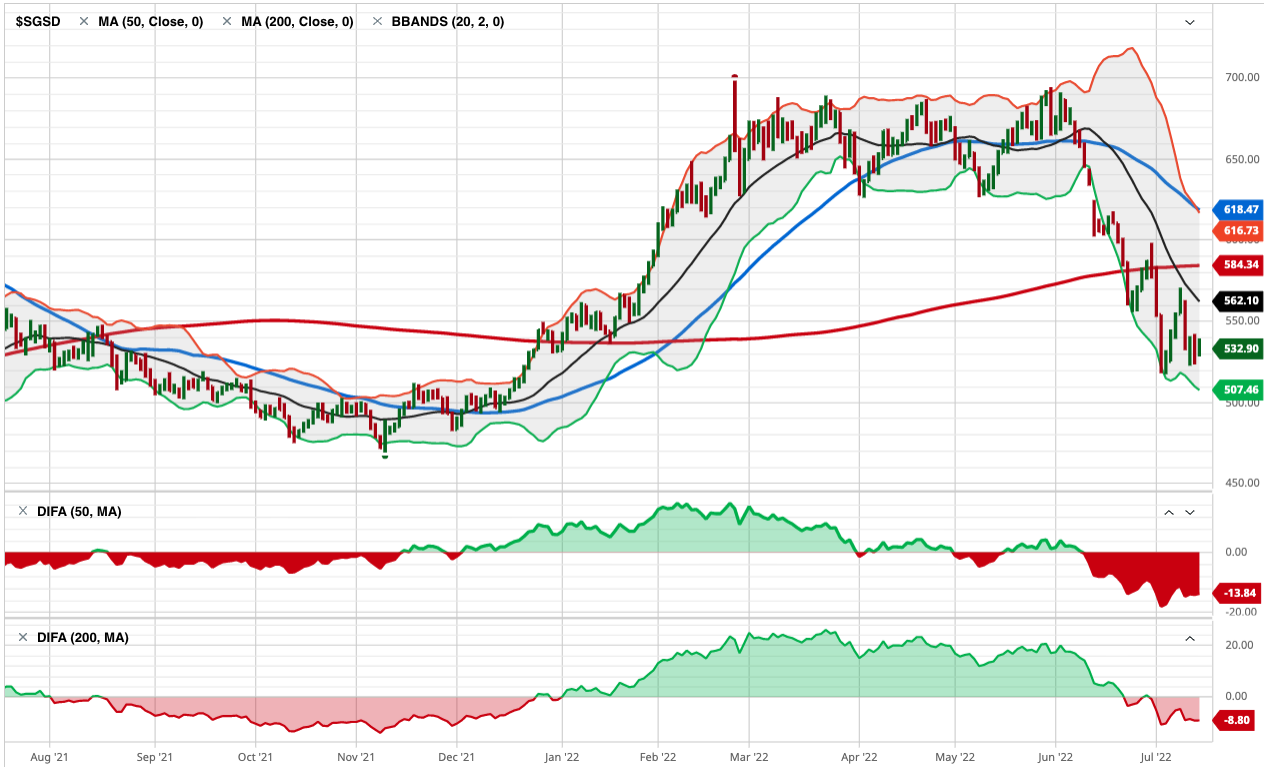
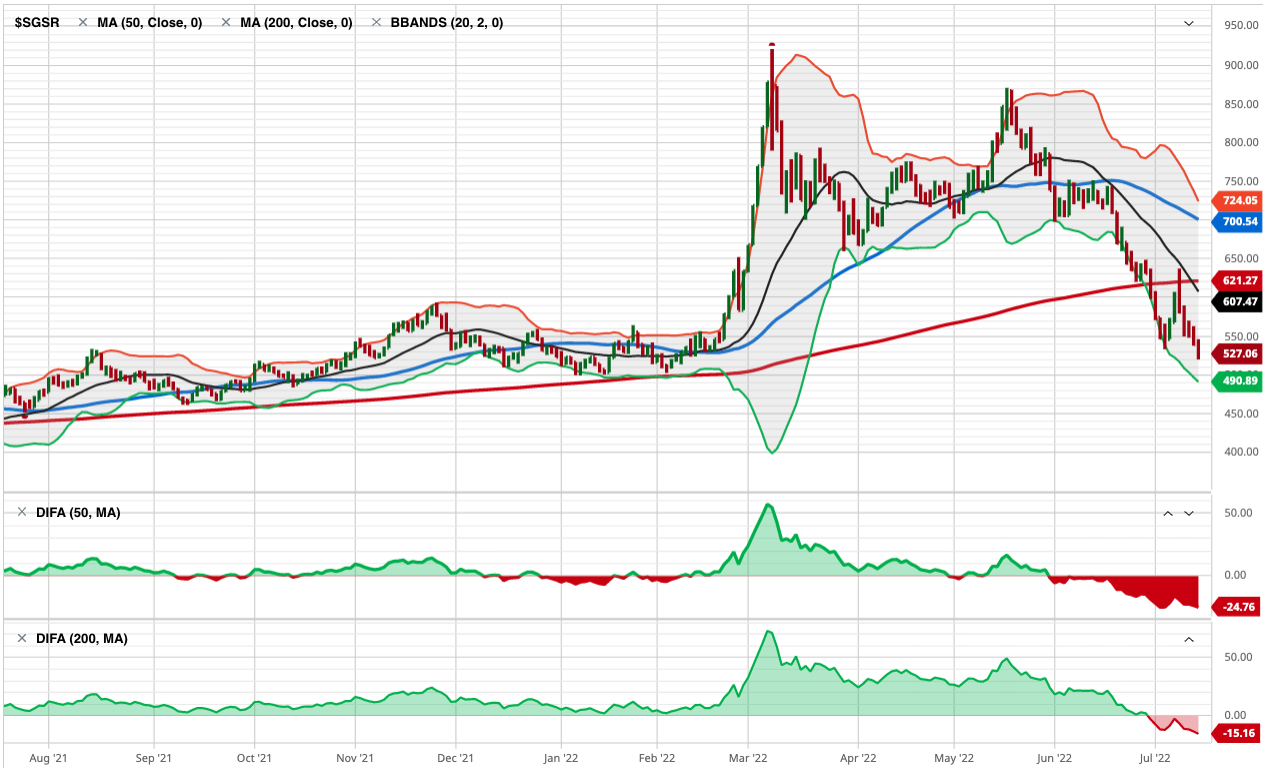
Live Cattle represented by S&P GSCI Live Cattle Index looks very similar, and is an uptrend, but not an all-time new high as it’s still below the February high.
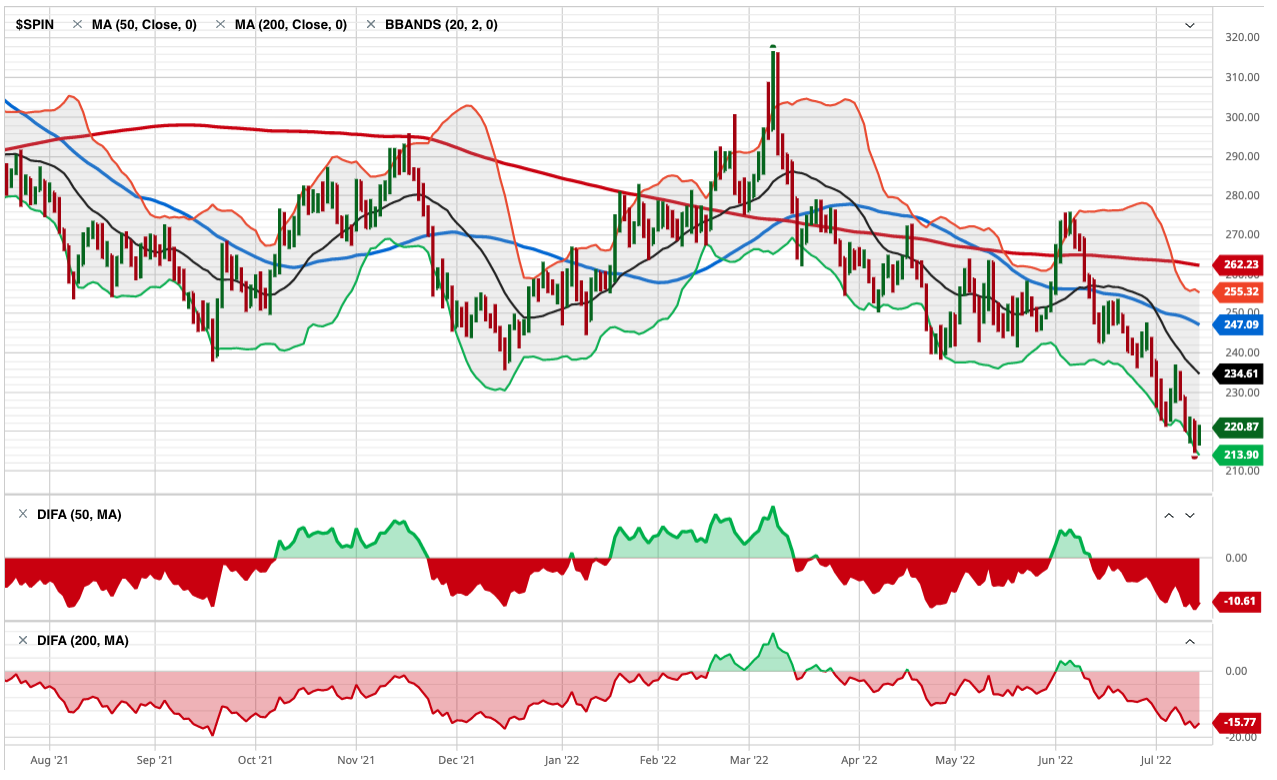
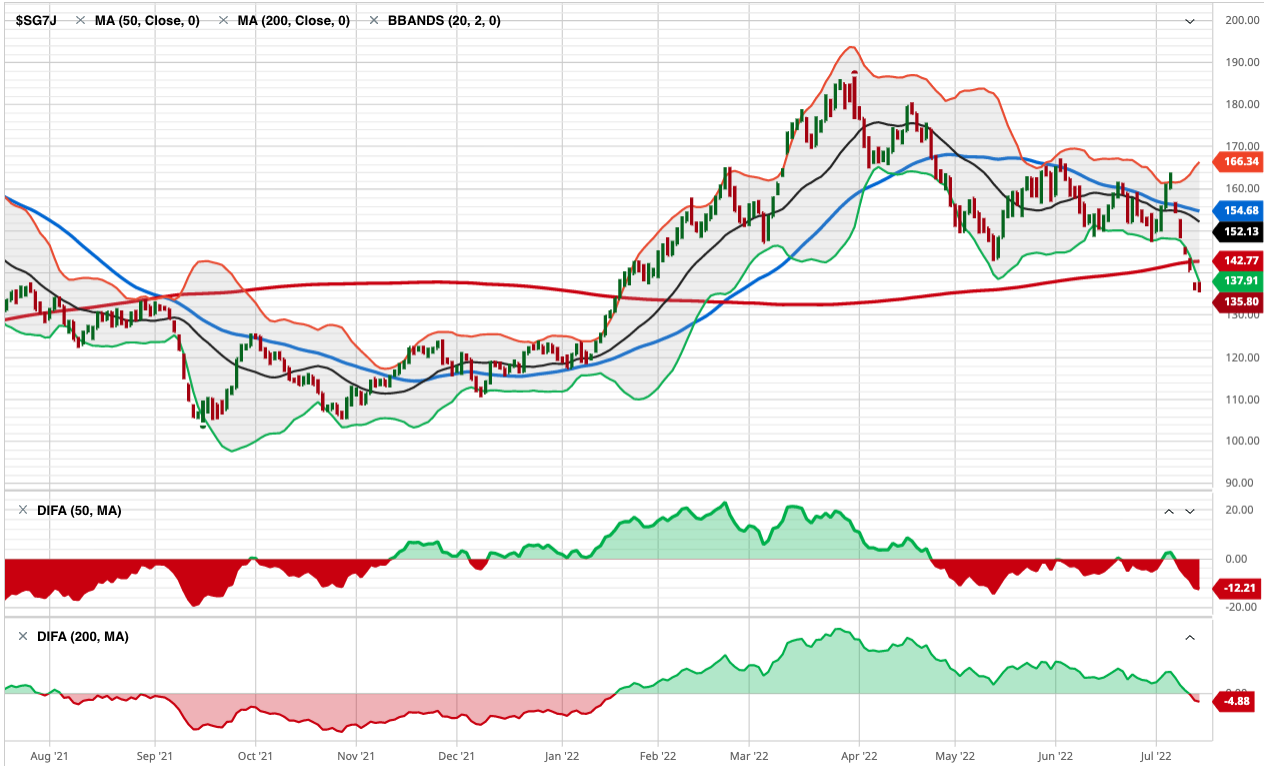
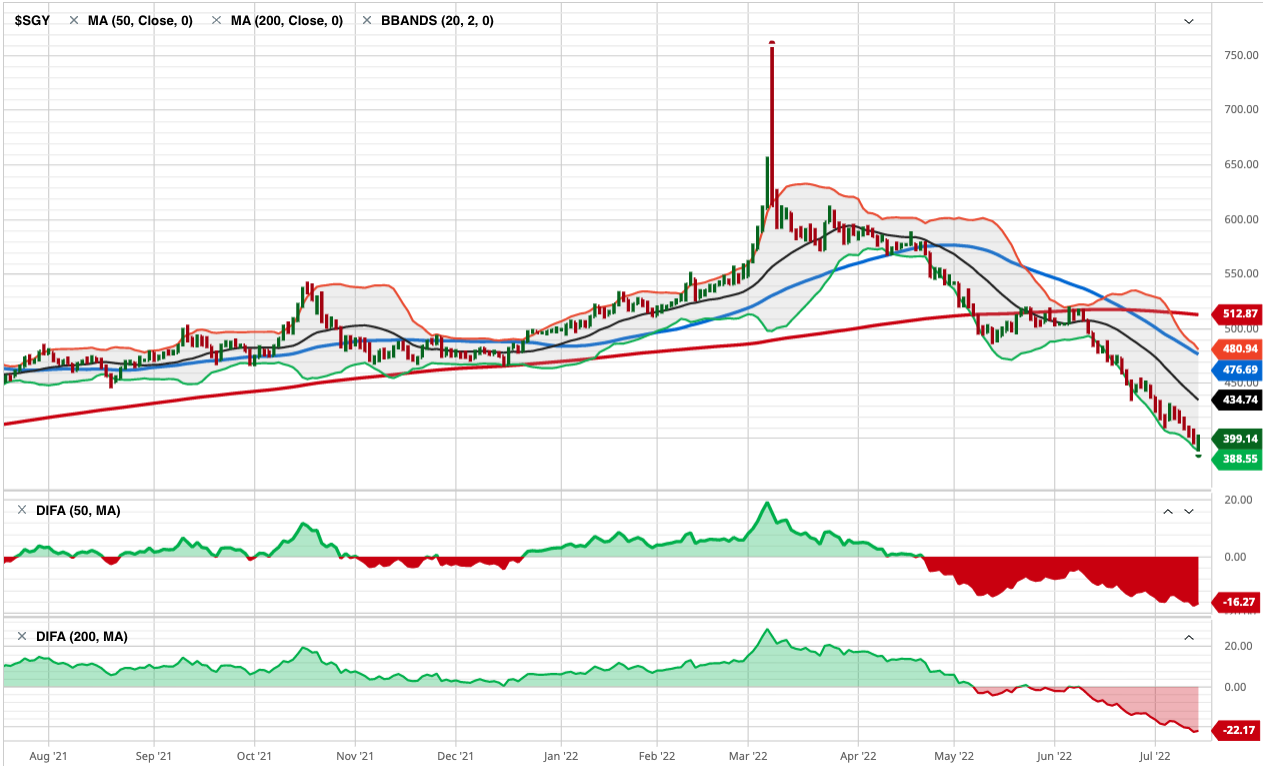
Here’s where the weakness in these commodities trends begins. The S&P GSCI Gas Oil Index is in an intermediate-term uptrend; It’s 20% above the 200-day average. But the recent decline pushed it 6% below the 50-day average. The Gas & Oil index is in a primary uptrend, but short-term pullback. Longer-term trends begin with a shorter-term trend, so we’ll see how it trends from here.
Heating oil is represented by the S&P GSCI Heating Oil Index. Like gas and oil, it’s in a primary uptrend, but a short-term downtrend.
Now we’re getting into commodities with a negative price momentum over the past 3 months.
S&P GSCI Sugar Index is in a non-trending, volatile period over the past year, and it’s right at the 50 and 200-day average.
The S&P GSCI Livestock Index, a sub-index of the S&P GSCI, provides investors with a reliable and publicly available benchmark for investment performance in the livestock commodity market. Livestock is another market that’s lost its upward momentum over the past three months, and one to watch for a breakout.
S&P GSCI Natural Gas Index is in a primary uptrend, but recent downtrend in the short term. It tapped its 200-day average and is trending back up, but nearly 7% below where it was three months ago.
I ranked these trends by three-month momentum, so all of the commodities up to this point were outperforming the broad commodity index we know as S&P GSCI Total Return Index. My three-month momentum ranking is completely arbitrary, but it signaled many of these trends had changed recently.
The S&P GSCI Total Return Index is in a primary uptrend as defined by a level above its 200-day average, but it’s in a downtrend since it peaked in June.
S&P GSCI Total Return Index is what many global macro asset managers managing global macro hedge funds use as a benchmark for commodities, so the rest of these trends are more granular looking inside this broader index made up of these other indices.
S&P GSCI Energy Index is in a primary uptrend but has declined materially over the past month.
S&P GSCI Unleaded Gasoline Index is a big one that impacts Americans and our personal economy. S&P GSCI Unleaded Gasoline Index is in a primary uptrend but has corrected a lot these past five weeks. Once again, we see a commodity trend tapping the 200-day moving average, so a breakout below it will signal a changing primary trend.
Coffee is in a downtrend. S&P GSCI Coffee Index is below the 50 and 200 average, signaling it’s in both a short-term and intermediate-term downtrend. This may help explain why Latin American countries like Brazil’s stock index is down, too. Latin America makes a lot of the world’s coffee.
Unless you’re a long/short commodity trader like a CTA trend follower who aims to capitalize on these downtrends as much as the uptrends, this is one of the rare times downtrends are something to cheer on.
S&P GSCI Crude Oil Index is in a short-term downtrend, but a primary uptrend.
Meanwhile, S&P GSCI Cocoa Index is in a downtrend across both time frames.
Hey Crude, as in Brent Crude. We have a downtrend in S&P GSCI Brent Crude Index over the short run after a volatile non-trending period.
An interesting Intermarket analysis this year has been the trend in Gold. Gold is seen by many market participants as a store of value and a safe haven, but S&P GSCI Gold Index is in a downtrend after a sharp uptrend around March. You can probably see how applying multiple time frames can be useful in observing these trends.
By and large, the metals like precision metals are in downtrends.
S&P GSCI Platinum Index is in a downtrend.
Soft commodities, or softs, are commodities such as coffee, cocoa, sugar, corn, wheat, soybean, fruit and livestock. The term generally refers to commodities that are grown, rather than mined. You can see how some of the commodity markets tracked by indices are very granular focused on one single market trend, and others are a basket of commodities within a sector.
S&P GSCI Softs Index has shifted from a quiet uptrend to a volatile downtrend.
A biofuel is any fuel that is derived from biomass, that is, plant or algae material or animal waste.
After an uptrend breakout around March, S&P GSCI Biofuel Index has trended back to the same level it started.
Some of the most common products produced with soybeans are tofu, soy milk, soy sauce, and soy flour. Approximately 85% of soybeans grown around the world are used to make vegetable oils that are either sold to consumers or used commercially according to The Spruce Eats. The USDA says “Just over 70 percent of the soybeans grown in the United States are used for animal feed, with poultry being the number one livestock sector consuming soybeans, followed by hogs, dairy, beef and aquaculture.”
You can probably see how interconnected all this stuff is.
S&P GSCI Soybeans Index is in a downtrend after an uptrend started at the beginning of this year. Hopefully, this lower animal feed cost will help lower the prices of the livestock that are in uptrends.
Lead is still widely used for car batteries, pigments, ammunition, cable sheathing, weights for lifting, weight belts for diving, lead crystal glass, radiation protection and in some solders, according to RSC.org.
S&P GSCI Lead Index is in a downtrend, so I guess we’ll eventually see the price of ammo and car batteries decline, too. Overall, lead has been a non-trending volatile market the past year, but it’s now more decisively in a dowtrend.
Lean Hog is a type of hog (pork) futures contract that can be used to hedge and to speculate on pork prices.
S&P GSCI Lean Hogs Index has trended into a downtrend, so your bacon price may improve.
Palladium is one of a number of metals starting to be used in the fuel cells to power things like cars and buses as well as in jewelry and in dental fillings and crowns.
S&P GSCI Palladium Index is in a downtrend.
Grains are used around the world and are also called cereals, and are the most important staple food. According to NatGeo, humans get an average of 48 percent of their calories, or food energy, from grains. Grains are also used to feed livestock and to manufacture some cooking oils, fuels, cosmetics, and alcohols.
S&P GSCI Grains Index is in a downtrend after it broke up with momentum going into this year. If you like to eat and drink alcohol, this is great news as it seems the prices should drift back to where they were.
Wheat is used for white bread, pastries, pasta, and pizza, so this downtrend in S&P GSCI Wheat Index is a welcome change.
Dr. Copper is market lingo for the base metal that is reputed to have a “Ph. D. in economics” because of its ability to predict turning points in the global economy.
S&P GSCI Copper Index is in a strong downtrend, so if its reputation holds true, the Ph. D. in economics suggests a global economic slowdown is ahead.
The Royal Society of Chemistry says aluminum is used in a huge variety of products including cans, foils, kitchen utensils, window frames, beer kegs and airplane parts.
If the trend in S&P GSCI Aluminum Index is a guide, the price of your next beer keg or airplane should drift lower. Aluminum is in a downtrend.
Industrial Metal alloys are known for their strength, durability, and corrosion resistance, so engineers, architects, and others in the industrial field use these alloys to construct buildings, wires, pipes, bridges, machines, and much more according to Wieland.
S&P GSCI Industrial Metals Index shows industrial metals are in a downtrend with great momentum.
Industrial metals are down so much I’ll show a two-year chart to see the price is back to 2020 levels.
Last but not least is cotton. I think we all know what cotton is used for. The price of clothes should see some decline with S&P GSCI Cotton Index in such a downtrend.
What we’ve observed is many commodity markets were in uptrends, but have more recently trended down. Not all of these necessarily impact the Consumer Price Index, but we certainly use most if not all of them one way or another.
Commodities are real “stuff”, and the prices of much of this stuff are no longer as elevated as it was. If this flows into lowering prices of the stuff we buy, then we’ll see inflation fall from here.
If inflation trends down from here, it’ll be positive for stocks and bonds and may result in the Federal Reserve pausing its aggressive interest rate hikes.
Now you know why we aren’t long commodities at this point.
Investor sentiment (about stocks) is so negative right now, that any slight improvement in inflation may spark an uptrend, then the extremely bearish positioning may drive short covering to keep the trend going a while.
Let’s see how it all unfolds.
Mike Shell is the Founder and Chief Investment Officer of Shell Capital Management, LLC, and the portfolio manager of ASYMMETRY® Managed Portfolios. Mike Shell and Shell Capital Management, LLC is a registered investment advisor focused on asymmetric risk-reward and absolute return strategies and provides investment advice and portfolio management only to clients with a signed and executed investment management agreement. The observations shared on this website are for general information only and should not be construed as investment advice to buy or sell any security. This information does not suggest in any way that any graph, chart, or formula offered can solely guide an investor as to which securities to buy or sell, or when to buy or sell them. Securities reflected are not intended to represent any client holdings or recommendations made by the firm. In the event any past specific recommendations are referred to inadvertently, a list of all recommendations made by the company within at least the prior one-year period may be furnished upon request. It should not be assumed that recommendations made in the future will be profitable or will equal the performance of the securities on the list. Any opinions expressed may change as subsequent conditions change. Please do not make any investment decisions based on such information, as it is not advice and is subject to change without notice. Investing involves risk, including the potential loss of principal an investor must be willing to bear. Past performance is no guarantee of future results. All information and data are deemed reliable but are not guaranteed and should be independently verified. The presence of this website on the Internet shall in no direct or indirect way raise an implication that Shell Capital Management, LLC is offering to sell or soliciting to sell advisory services to residents of any state in which the firm is not registered as an investment advisor. The views and opinions expressed in ASYMMETRY® Observations are those of the authors and do not necessarily reflect the position of Shell Capital Management, LLC. The use of this website is subject to its terms and conditions.


You must be logged in to post a comment.