
The first step to understand something and to draw distinctions between them is to define the words we use. This isn’t always and easy task since many words don’t have a clear definition that everyone agrees on. In fact, I write my own definitions for many of the specialized topics I speak of and list them in the “definitions” pages of this website. I find that thinking deeply about the meaning of a word is useful. That is especially true for me, since I develop and operate quantitative decision making systems and program them to automatically generate the answer. Once I’ve done that, I can operate it across global markets and an unlimited number of securities and do it with a level of precision and consistency not found in humans. When I say “quantitative systematic decisions” that are processed by a computer algorithm, I think many people envision a computer doing everything on its own. That’s because most people don’t develop a program, they use one someone else developed. I’m writing this using Microsoft Word, but I am an operator of Word, but not a developer. It was just there. I don’t think about or understand what went on behind the scenes to create it. What you may not consider is that a human has to tell the computer program what it will do. I create the algorithm, which is a series of processes: if this input, then that output. You can probably see how that series can be a mile long if we’ve thought about possibilities everyday for a decade. To do that requires me to think very deeply about every single detail because software doesn’t know what to do until I tell it. The only way it will fail is if we leave something out and it has no way to move forward – no answer for the input. This gives me a unique advantage from the start: I have probably thought far more deeply about everything I do than those who spend every day trying to figure out what to do next because I am putting my thinking into more than just a trading plan, I’m putting it into a trading system. A computer needs very precise instructions to operate. A human with a “rules-based” plan has a lot of room for error because it doesn’t have to be so precise – they can make it up as they go and do one thing today and another tomorrow.
You can probably see where I am coming from when I do the “play with words”. In this case, we don’t need perfect definitions everyone agrees with to get the point.
What is education? Wikipedia defines education as:
Education in its general sense is a form of learning in which the knowledge, skills, and habits of a group of people are transferred from one generation to the next through teaching, training, or research. Education frequently takes place under the guidance of others, but may also be autodidactic. Any experience that has a formative effect on the way one thinks, feels, or acts may be considered educational.
What is knowledge? Wikipedia defines knowledge as:
Knowledge is a familiarity with someone or something, which can include facts, information, descriptions, or skills acquired through experience or education. It can refer to the theoretical or practical understanding of a subject. It can be implicit (as with practical skill or expertise) or explicit (as with the theoretical understanding of a subject); it can be more or less formal or systematic.[1] In philosophy, the study of knowledge is called epistemology; the philosopher Plato famously defined knowledge as “justified true belief.” However, no single agreed upon definition of knowledge exists, though there are numerous theories to explain it. Knowledge acquisition involves complex cognitive processes: perception, communication, association and reasoning; while knowledge is also said to be related to the capacity of acknowledgment in human beings.
What is skill? Wikipedia defines skill as:
A skill is the learned ability to carry out a task with pre-determined results often within a given amount of time, energy, or both. In other words the abilities that one possesses. Skills can often be divided into domain-general and domain-specific skills. For example, in the domain of work, some general skills would include time management, teamwork and leadership, self motivation and others, whereas domain-specific skills would be useful only for a certain job. Skill usually requires certain environmental stimuli and situations to assess the level of skill being shown and used.
Since we are speaking of skill, let’s also define luck: Luck or chance is an event which occurs beyond one’s control, without regard to one’s will, intention, or desired result. Luck can be good or bad. If skill is what we intentionally do and some degree of control in the outcome from our actions, luck is the part beyond our control. A good rule of thumb is: if you can’t lose on purpose, it’s luck. For example, a roulette table is luck. You can’t win or lose on purpose. Poker is skill-based games were we can apply probability and money management toward a better outcome. If you want to lose, you can.
What is experience? Wikipedia defines experience:
Experience comprises knowledge of or skill of some thing or some event gained through involvement in or exposure to that thing or event. The history of the word experience aligns it closely with the concept of experiment. For example, the word experience could be used in a statement like: “I have experience in fishing”.
The concept of experience generally refers to know-how or procedural knowledge, rather than propositional knowledge: on-the-job training rather than book-learning. Philosophers dub knowledge based on experience “empirical knowledge” or “a posteriori knowledge”.
A person with considerable experience in a specific field can gain a reputation as an expert.
What is an expert? Wikipedia defines an expert:
An expert is someone widely recognized as a reliable source of technique or skill whose faculty for judging or deciding rightly, justly, or wisely is accorded authority and status by their peers or the public in a specific well-distinguished domain. An expert, more generally, is a person with extensive knowledge or ability based on research, experience, or occupation and in a particular area of study. Experts are called in for advice on their respective subject, but they do not always agree on the particulars of a field of study. An expert can be, by virtue of credential, training, education, profession, publication or experience, believed to have special knowledge of a subject beyond that of the average person, sufficient that others may officially (and legally) rely upon the individual’s opinion. Historically, an expert was referred to as a sage (Sophos). The individual was usually a profound thinker distinguished for wisdom and sound judgment.
Experts have a prolonged or intense experience through practice and education in a particular field. In specific fields, the definition of expert is well established by consensus and therefore it is not necessary for an individual to have a professional or academic qualification for them to be accepted as an expert. In this respect, a shepherd with 50 years of experience tending flocks would be widely recognized as having complete expertise in the use and training of sheep dogs and the care of sheep. Another example from computer science is that an expert system may be taught by a human and thereafter considered an expert, often outperforming human beings at particular tasks. In law, an expert witness must be recognized by argument and authority.
Research in this area attempts to understand the relation between expert knowledge and exceptional performance in terms of cognitive structures and processes. The fundamental research endeavor is to describe what it is that experts know and how they use their knowledge to achieve performance that most people assume requires extreme or extraordinary ability. Studies have investigated the factors that enable experts to be fast and accurate
We can now draw a few distinctions here. A person with education is one who has been taught by others or learned from others. Any experience that changes the way one thinks, feels, or acts may be considered educational. You can have an education in investment, trading, and finance, but that may indicate you have gained some knowledge, but not necessarily skill or experience. Knowledge is when we actually understand something and are familiar with it. It seems one way to gain new knowledge is through education – learning from others, researching, etc. Experience comes from the word experiment, so it is knowledge of or skill of some thing gained through involvement in and exposure to that thing. We have experienced it before, or not. Experience can have a wide range of magnitude. Many investors and traders may believe looking at charts for a few hours over a few years makes them experienced. But imagine the difference if they’ve been doing it for several hours a day for two decades. The more experience we have, the more we get in the zone. Experience creates the flow zone: when we have done something so many times we don’t have to think about doing it, we just do. Like driving a car. We don’t think of putting on the brake, but a new driver does. Someone who has an excellent driving record for many years is an expert. Experts have a prolonged or intense experience through practice and education in a particular field. There are different degrees of expert. A professional race car driver is a different level of expert than a person who has just been driving to work every day for years. In racing, you have to be very good to become a professional. In the asset management industry, that isn’t necessarily the case. Investment advisers who work with individual investors often don’t show their potential clients their actual past performance history since they’ve been a professional. They can instead show potential clients performance of something that they didn’t actually invest in when it had good results or even make up past performance with hypothetical and back-tests. A race car driver can’t do that.
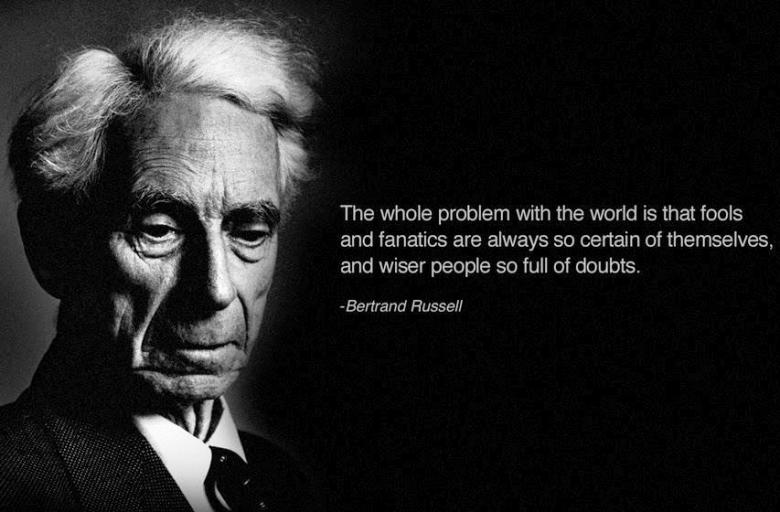
I point out these words and draw some distinctions because I am amazed on the magnitude of overconfidence people have when it comes to portfolio management decision-making. For example, I say that I consider an “expert” portfolio manager one who has spent all of his or her time making tactical trading decisions daily for more than a decade and has an excellent actual performance history doing it. This expert has examined well over 10,000 charts with knowledge of how markets interact and how price trends begin and end. An expert portfolio manager developed computer programs designed to define global market trends, separate them out, and enter and exit them while controlling risk systematically. The expert has been operating those systems with discipline for more than a decade and the outcome from that is his or her good track record.
If we define it that way, then we can get an idea where we fit in regard to education, knowledge, skill, expertise, and experience.


You must be logged in to post a comment.