Since May, we observe that global market indexes have diverged. While some markets are still trending up, others are trending down. Prior to 2013, many markets were generally trending together. The current U.S stock bull market is now 52 months old from from its March 2009 bear market low. If history is a guide, it’s closer to the end (read: The S&P 500 Stock Index at Inflection Points). One of the things we see near the end of a major trend change is some world markets start to reverse down. For example, going in to 2008 it was Financials and REITs (real estate). As we see in the chart, U.S. stocks are still trending up for now, but emerging markets and all categories of bonds and Real Estate Investment Trusts (REITs) are weak. Rising interest rates = falling bond prices and falling interest rate sensitive markets like REITs. The diversification of global asset allocation over this period has actually resulted in more downside risk rather than reducing it. Bonds have been in a rising trend for the past 30 years, so when stocks drop -50% exposure to bonds haves helped to offset the losses for asset allocators who mix stocks and bonds. If bonds are changing to a downtrend as it appears they are, bonds may not be a crutch in the next bear market. In fact, they may inflate losses.
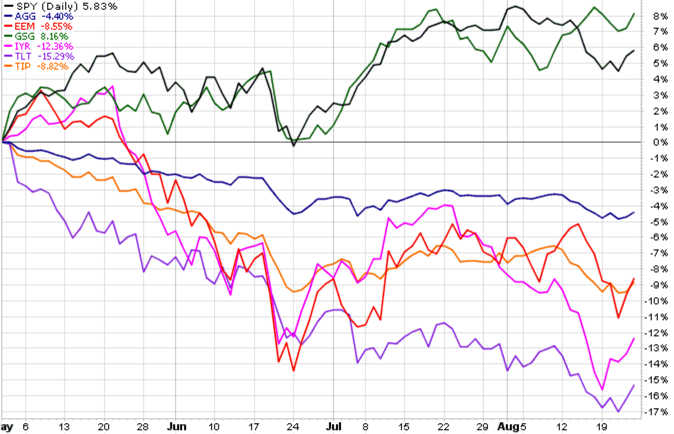
If you aren’t familiar with the index symbols for the markets in the table in the top left:
- iShares Barclays 20+ Year Treasury Bond (TLT)
- iShares Core Total US Bond Market ETF (AGG)
- iShares Barclays TIPS Bond (TIP)
- iShares U.S. Real Estate (IYR)
- SPDR S&P 500 Stock Index (SPY)
- iShares MSCI Emerging Markets (EEM)
If you have any questions or comments, contact me.
