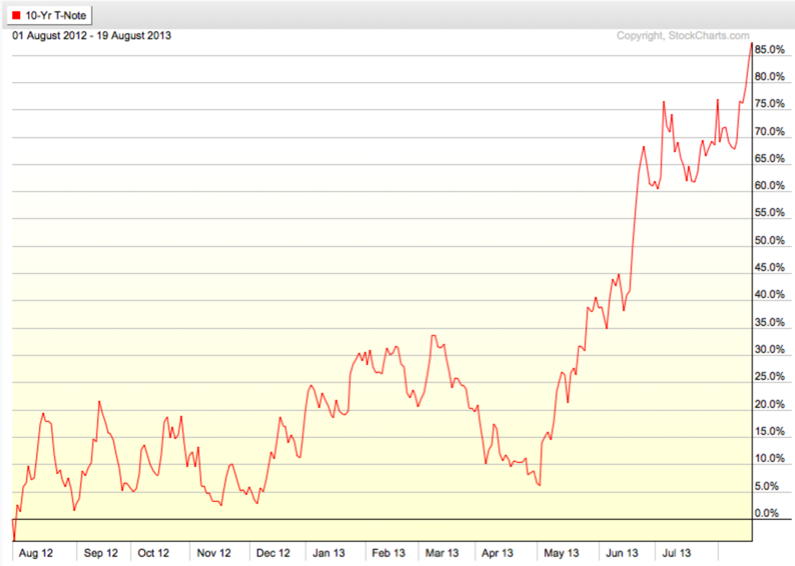
First, we view 15 Year Chart of the 10 Year U.S. Treasury Note Yield (interest rate) (Symbol: $TNX). Keep in mind this chart reflects the rate of change in the interest rate, not the price trend. If we define a downtrend as “lower highs, lower lows” the 15 year trend for interest rates has been down. But since 2012, the trend has sharply turned up – though that isn’t the first time.

Next, we zoom in t0 view the magnitude of the interest rate on the 10 Year U.S. Treasury Note Yield since its low a year ago in August 2012. The interest rate on the 10 year treasury has gained 85%. The current yield is about 2.88%.
Next we look at the long term U.S. Treasury Bond Yield – the 30 year. Long terms rates have been in a downtrend the last 15 years, but have recently trended up sharply.

Understanding the implications of a reversal in the trend of interest rates is critical to a global macro fund manager. A large part of my global tactical decisions is identifying direction trend changes. and understanding how markets interact with each other. For example, we can see below how rising rates significantly impact the price value of bonds.
Below, we observe the total return (price trend + interest) of a wide range of different styles of bond ETFs.
- iShares Barclays 20+ Year Treasury Bond (TLT)
- iShares Core Total US Bond Market ETF (AGG)
- iShares S&P National AMT-Free Municipal Bond (MUB)
- iShares Barclays TIPS Bond (TIP)
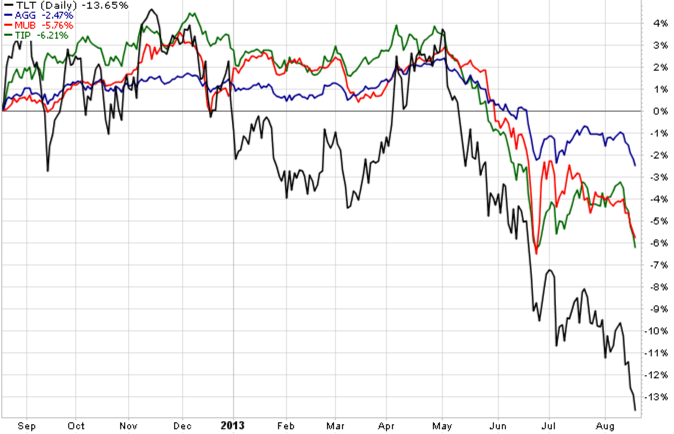
Clearly, they have recently been in a downtrend with U.S. Government bonds down the most at -13.65% over the past year.
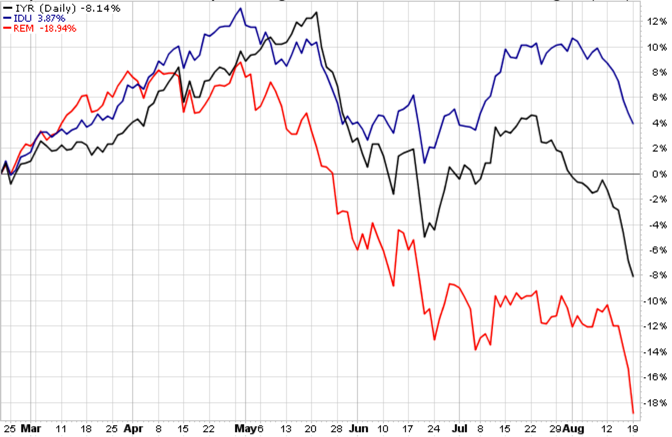
Finally, we observe some markets and sectors that are very sensitive to changes in interest rates.
- iShares Mortgage Real Estate (REM): provides exposure to U.S. residential and commercial mortgage real estate investment trusts (REITs), which trade like stocks and invest in real estate directly
- iShares U.S. Real Estate (IYR): exposure to U.S. real estate stocks and real estate investment trusts (REITs), which trade like stocks and invest in real estate directly.
- iShares U.S. Utilities: exposure to U.S. utilities stocks.
Eventually the Federal Reserve will stop their “Quantitative Easing” program of buying bonds. You know how supply and demand works: when demand dries up, price goes down…

Pingback: Interest Rate Trend « Asymmetry Observations
Pingback: Asymmetry Observation: Global Markets Diverge Since May « Asymmetry Observations
Pingback: 133 Years of Long Term Interest Rates « Asymmetry Observations