I observed many headlines pointing out that March 9th is the 8th anniversary of the current bull market in U.S. stocks.
The rising trend in stocks is becoming one of the longest on record. It is the second longest, ever.
Looking at it another way, March 9, 2009 was the point that stock indexes had fallen over -50% from their prior highs.
Since most of the discussion focuses on the upside over the past 8 years, I’ll instead share the other side so we remember why March 9, 2009 matters.
‘Those who cannot remember the past are condemned to repeat it.’
– George Santayana
When investors speak of the last bear market they mostly call it “2008” or “o8”.
However, the end of the last bear market was actually March 9, 2009 and the beginning was October 2007.
Below is a chart of the S&P 500 stock index from October 9, 2007 to March 9, 2009. The price decline was -56%.
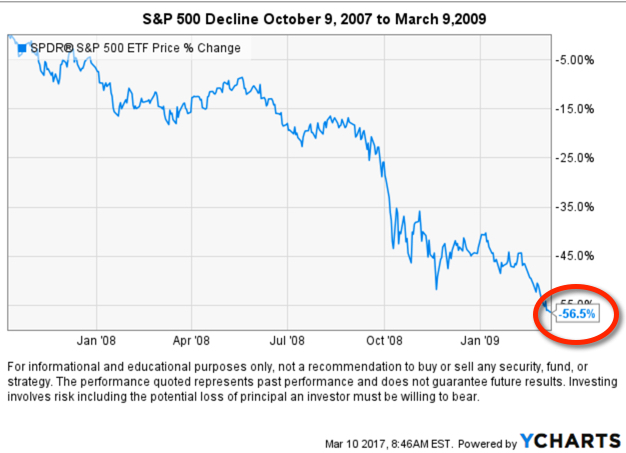
No one knew that March 9, 2009 was the lowest it would go. It could have gotten much worse.
Talking only about the gains since the low leaves out the full story.
When we research price trends, we must necessarily consider the full market cycle of both rising and falling trends. For example, below is the price trend since the peak nearly 10 years ago on October 9, 2007. Even after such a large gain, the Risk-to-Reward Ratio isn’t so good if you had to hold through the big loss to achieve it. That is, investors had to experience -56% on the downside for how much gain?
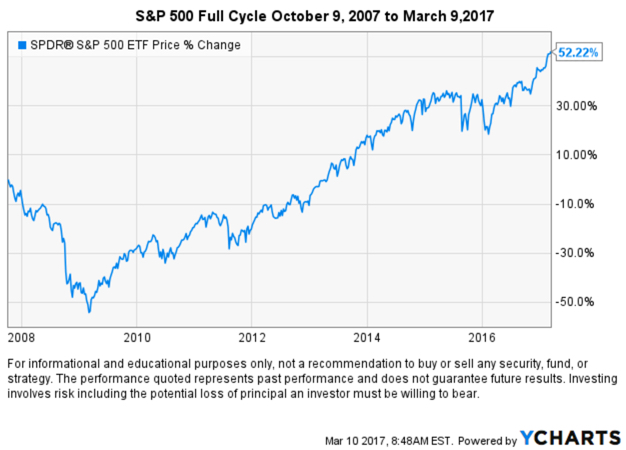
It isn’t the upside that causes so much trouble, it’s the downside.
That’s why we must manage risk to increase and decrease exposure to the possibility of gain and loss.

You must be logged in to post a comment.