
Many studies show that investors have poor results over the long haul including both bull and bear markets. For example, DALBAR has been conducting their annual Quantitative Analysis Of Investor Behavior study for 22 years now.
DALBAR’s Quantitative Analysis of Investor Behavior (QAIB) has been measuring the effects of investor decisions to buy, sell and switch into and out of mutual funds over both short and long-term time frames. The results consistently show that the average investor earns less – in many cases, much less – than mutual fund performance reports would suggest.
Their goal of QAIB is to improve investor performance by pointing out the factors that influence behaviors that determine the outcome of investment or savings strategies. They conclude individuals have poor results for two primary reasons:
- Lack of capital investment.
- Investor Psychology.
If someone doesn’t save and invest some of their money, they’ll never have a chance to have good long-term results. However, they find the biggest reason for poor results by investors who do invest in the markets over time is investor psychology. Investors tend to do the wrong thing at the wrong time, especially at market extremes.
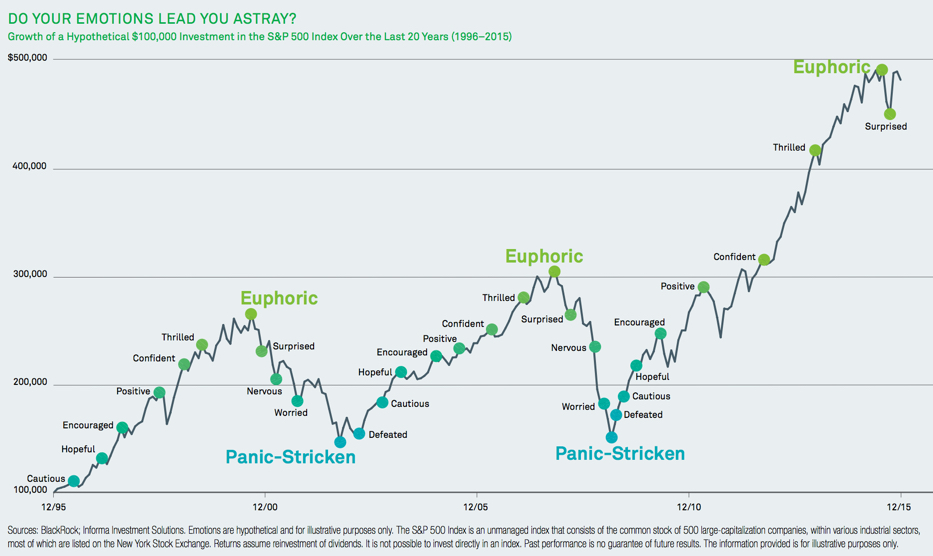
The chart below illustrates how investors tend to let their emotions lead them astray. The typical “bull market” for stocks may last four or five years. After investors keep hearing of rising market prices and headlines of “new highs” they want to invest more and more – they become euphoric. The may get more “aggressive”. However, those gains are in the past. Market trends are a good thing, but they can move to an extreme high (or low) and then reverse. Investors feel euphoria just as the stock market is getting “overvalued” at the end of a market cycle.
Look at that chart: what big trend do you think happens next?
 Source: Investing and Emotions
On the downside, investors panic after large losses. There are many ways that investors get caught in this loss trap. For example, some are told to “stay in the market” so they hold on beyond their uncle point and then tap out. After they sell at much lower prices, they are too afraid to “get back in.” They are “Panic-Stricken.” They don’t discover the actual risk of their passive asset allocation until it’s too late and their losses are larger than they expected.
Investors need to know their real tolerance for loss before the loss happens. Then, they need to invest in a program that offers a matching level of risk management, so they don’t lose so much they tap out and lock in significant losses. If they reach their uncle point and tap out, they have an even more difficult challenge to get back on track.
You want to be greedy when others are fearful. You want to be fearful when others are greedy. It’s that simple. – Warren Buffett
The chart above shows twenty-one years of the historical return of the S&P 500 stock index. Look at the graph above to see the points this happens. It shows an idealized example of investor emotions as prices trend up and down. As prices trend up, investors initially feel cautious, then hopeful, encouraged, positive, and as prices move higher and higher, they feel confident and thrilled to the point of euphoric. That’s when they want to get “more aggressive” when they should be doing the opposite. The worst investors actually do get more aggressive as they become euphoric at new highs, and then they get caught in those “more aggressive” holdings as the markets decline -20%, -30%, -40%, or more than -50%.
After such investment losses investors first feel surprised, then as their losses mount they feel nervous, then worried, then panic-stricken. But this doesn’t happen so quickly. You see, larger market declines often take a year or two to play out. The most significant declines don’t fall in just a few months then recover. The significant declines we point out above are -50% declines that took 3 – 5 years or more to get back to where they started. So, they are made up of many swings up and down along the way. If you look close at the chart, you’ll see those swings. It’s a long process – not an event. So few investors notice what is happening until it’s well in the past. They are watching the daily moves (the leaf on a tree) rather than the bigger picture (the forest).
So, investors get caught in a loss trap because the swings along the way lead them astray. Their emotions make them oscillate between the fear missing out and the fear of losing money and that’s why investors have poor results over a full market cycle. A full market cycle includes a major peak like the Euphoric points on the chart and major lows like the Panic-Stricken points. Some investors make their mistakes by getting euphoric at the tops, and others make them by holding on to falling positions too long and then panicking after the losses are too large for them.
At Shell Capital, I manage an investment program that intends to avoid these mistakes. I prefer to avoid the massive losses, so I don’t have panicked investors. And, we don’t have to dig out of large holes. That also necessarily means we don’t want to get euphoric at the tops. I want to do the opposite of what DALBAR finds most people do. To do that, I must necessarily be believing and doing things different than most people – a requirement for good long term results. But, creating exceptional investment performance over an extended period of ten years or more isn’t enough. We also have to help our investor clients avoid the same mistakes most people make. You see, if I am doing things very differently than most people, then I’m also doing it at nearly the opposite of what they feel should be done. Our investors have to be able to deal with that, too.
If you are like-minded, believe what we believe, and want investment management, contact us. This is not investment advice. If you need individualized advice, please contact us
Source for the chart: BlackRock; Informa Investment Solutions. Emotions are hypothetical and for illustrative purposes only. The S&P 500 Index is an unmanaged index that consists of the common stock of 500 large-capitalization companies, within various industrial sectors, most of which are listed on the New York Stock Exchange. Returns assume reinvestment of dividends. It is not possible to invest directly in an index. Past performance is no guarantee of future results. The information provided is for illustrative purposes only.

You must be logged in to post a comment.